Gravity Flow Dynamic Method for Pectin Extraction from Sunflower Head using Sodium Chloride
Received: 04-Jan-2017 / Accepted Date: 24-Jan-2017 / Published Date: 31-Jan-2017
Abstract
A gravity flow dynamic method was applied for pectin extraction from sunflower head (SFH) residues, byproducts of sunflower oil process. Sodium chloride was used as an ion exchange reagent to decoupling the divalent metal ions that bridge the polyanionic pectin with other components in sunflower cell wall tissues. In comparison with sodium hexametaphosphate (SHMP) that is popularly used for sunflower pectin extraction, sodium chloride can be obtained from domestic resources at low cost, is easily dissolved in water at higher concentrations without causing undesired viscosity increases that, in turn, makes this new extraction procedure simpler, more efficient, and cost-effective. This study also demonstrated that the dynamic method was more efficient than the standard static method with respect to pectin yield, processing time, and energy-consumption. Molecular characterization showed that SFH pectin obtained by the new method had higher galacturonic acid content and higher molecular weight.
Keywords: Sunflower; Pectin; Ion exchange; Extraction; Rheology
418529Introduction
Pectin has a long history of use in food applications, such as jam preparation that can be traced back to two centuries ago [1]. In the food industry, pectin is used as a food additive, gelling and thickening agent, stabilizer, preserver, and as substitutes in many health foods. The Food and Agricultural Organization of the United Nations recommended pectin as a safe food additive that is acceptable without limitation for daily intake [2]. Pectin’s can be found in cell wall tissues of all higher plants. Pectin’s sold in today’s market are mostly made from citrus peels or apple pomace which are byproducts of juice processing. In the cell walls of apple, citrus, or sugar beet, the macromolecular chains of pectin undergo hydrophobic interactions, hydrogen bonding and other chemical or physical interactions with other macromolecules such as cellulose, hemicellulose, or proteins. Such interactions leave 70% to 90% of the galacturonic acid units present in pectin to contain methyl ester groups. Citrus and apple derived pectin can be extracted by aqueous acid or base [3,4] or by digestion with a mixture of microbial enzymes [5,6]. Technologies that have been used during acid extraction include ultrasonic, microwave, autoclave, or extrusionassisted extractions [7-15]. Pectin thus obtained retains a higher degree of esterification (DE). Pectin can also be extracted from sunflower head residues (SFH, containing 15% to 24% pectin in dry weight). Since pectin interacts with other cell wall components in sunflower heads via ionic cross-linking, it can be isolated from SFH by ion-exchange methodology. SFH pectin is characterized by a lower DE than apple or citrus pectin.
High DE pectin gels in the presence of high sugar concentrations (>55% w/w) whereas low DE pectin gels in the presence of divalent metal ions. With an increase in the awareness that obesity is a poor health factor, low-calorie and low-sugar foods have started to replace high calorie and high sugar foods in the market place. This has promoted the use of SFH pectin in the food industries. The low DE nature of SFH pectin has increased its applications in healthy and functional foods. Such applications include the manufacture of low sugar beverages and jellies, low calorie yogurts and confectionery jelly products. In addition, gels from low DE pectin are thermally reversible. That makes SFH pectin more valuable than high DE pectin from other sources in many food processes, such as bakery jams sterilizing and milk pasteurizing.
Static ion exchange is the standard methodology to extract pectin from SFH residues. Extraction with aqueous sodium hexametaphosphate (SHMP) is often used for the removal of calcium and magnesium divalent metals [16,17]. Numerous combinations of different solution pH, operational time, temperature, and solid/solvent ratios have been investigated as systems for the extraction of pectin from the heads of several different sunflower varieties. Examples of these varieties are Helianthus annuus L. var. Cargill (N. Dakota, USA) [18,19], Cnel Pringles (Buenos Aires, Argentina) [20], and Goegan (Iran) [21].
To develop an economically effective and environmentally friendly method to extract SHF pectin, we used aqueous sodium chloride from rock salt, instead of SHMP, to remove Ca++ and Mg++ divalent ions from raw SFH residues that was followed by acidic pectin extraction [22]. The capability of sodium chloride to remove the divalent ions from SFH was compared with that of using SHMP. Furthermore a gravity flow dynamic method was applied for the extraction of SFH pectin. The efficacy of the dynamic method was compared with that of static method [23]. Pectin thus obtained was evaluated for galacturonic acid content and other molecular characteristics.
Materials and Methods
Sunflower heads and chemicals
Sunflowers (Helianthus annuus, Avangard) were harvested from a suburb of Dushanbe, Tajikistan. The de-seeded heads were sun-dried, ground to particles with the diameter of 0.6 mm to 1.0 mm using a laboratory mill. Prior to use, the SFH particles were dried in an air-circulated oven at 110°C, for 16 h, then placed in zipped plastic bags stored in desiccators over calcium oxide.
Sodium Chloride from rock salt was obtained from a local market (Dushanbe, Tajikistan) and purified by re-crystallization prior to use. Sodium hexametaphosphate and other chemicals were purchased from Sigma-Aldrich.
Deionized (D.I.) water was prepared by ion exchange columns (Millipore).
SFH pretreatment and Pectic Polysaccharides (PP) extraction
Prior to ion exchange reaction, soluble components in SFH residues were removed by washing with water (25 L/kg) followed by a mixture of water and ethanol (1/3, v:v; 25 L/kg) at 75°C for 15 minutes in each step [16,17]. The washed SFH particles were subjected to calcium removal followed by pectin extraction using acidic solutions at various pH values. Both static and kinetic methodologies were used to obtain pectin.
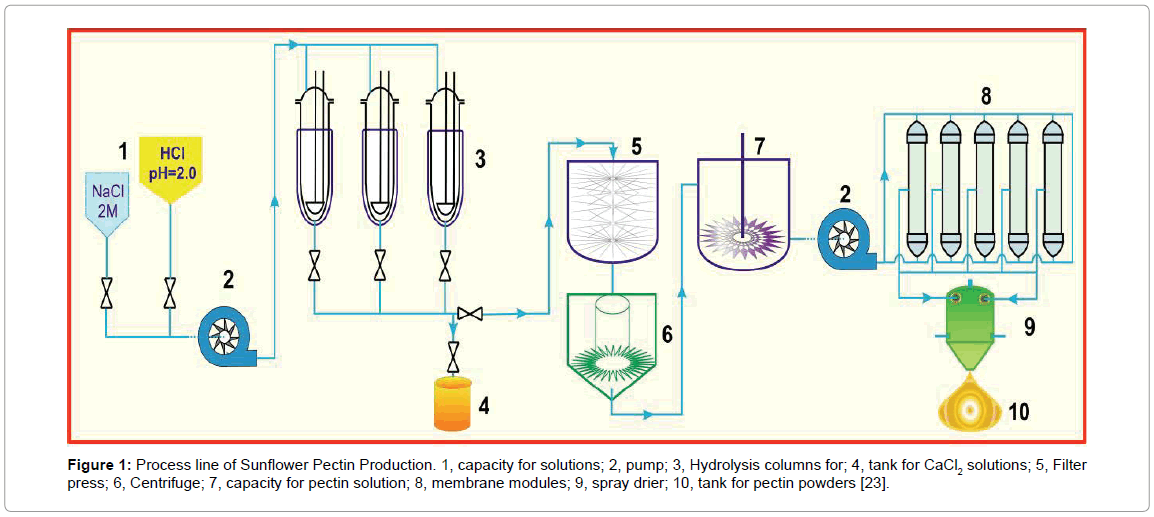
Dynamic method: As illustrated in Figure 1, the washed SFH particles (25 g) were loaded into a glass column (diameter 3.5 cm), which was gently tapped to ensure that it was tightly filled. Sodium chloride solutions (600 ml, pH 7 ± 0.2) with the concentrations of 4, 8, and 12% (w/v) were allowed to flow through the column at 2.0 ml/min at 75°C. This step removed divalent ions from the cell walls of SFH residues and the side-chain carboxylic groups in the pectic polysaccharides (PP) were ionized as Na+ form, which was followed by elution with HCl solutions (pH 1.8-5.5) to obtain PP. The elution was performed at various flow rates at 75°C.
Figure 1: Process line of Sunflower Pectin Production. 1, capacity for solutions; 2, pump; 3, Hydrolysis columns for; 4, tank for CaCl2 solutions; 5, Filter press; 6, Centrifuge; 7, capacity for pectin solution; 8, membrane modules; 9, spray drier; 10, tank for pectin powders [23].
The eluents were collected, cooled to room temperature, centrifuged at 6000 rpm for 60 minutes. This step separated PP into two phases, pectin gel (PG) in the bottom from soluble pectin (PS) in the top. The PS phase was pumped to a reservoir and diluted with 2-fold deionized (D.I.) water. The diluted pectin solution was then forced to pass through a set pf hollow fiber membrane module (MiniKross Sampler Hollow Fiber Module 100 KD PS, KrossFlow, USA). The concentrated pectin solution thus obtained was dried by a commercially available spray drier to form pectin powder (100 μm to 500 μm).
Static method: The washed SFH particles (25 g) were placed into a conical flask equipped with a reflux condenser, 600 ml of NaCl solutions (pH 7 ± 0.2) with the concentrations of 4, 8, and 12% (w/v) were added, and then the mixtures were stirred at room temperature for 24 hours. After removing the NaCl solution, the extraction was carried out by stirring the powders in acidic water with solution pH ranging from 1.5 to 5.5 for 60 to 90 minutes for several changes at 85°C. The extracts were collected for pectin analysis as described in the previous paragraph.
For comparison purpose, SHMP was used to extract calcium ions by kinetic and static methods under the same conditions.
Analytical methods
Ash content and Ca++/Mg++ content: Ash content in raw SFH and treated SFH was measured by the method described in the Official methods of Analysis of the Association of Official Analytical Chemistry [22]. Briefly, 10 g SFH sample was placed in a furnace, incinerated at 525°C for 4 h; cooled to room temperature and stored in a desiccator over calcium oxide. The contents of calcium ions and magnesium ions in both of the untreated and treated SFH powders were determined by titration with EDTA [23].
Swelling behavior: The swelling properties of SFH particles were determined by immersing a sample (1.0 g) in 50 ml D.I. water at room temperature for 48 h. The weight of the swelled samples was recorded after removing the surface water by tapping with Tissue Wiper. The swelling degree was then calculated according to (Ww -Wd)/Wd × 100%, where Ww and Wd were the weights of wet sample and dry sample, respectively [24].
Anhydrogalacturonic acid (AGalA) content and the degree of methyl esterification of the galacturonic acid groups of pectin (DE): AGalA content in dry pectin samples, eluents (kinetic method), and extraction solutions (static method) was determined by the Sulfamate/3-phenylphenol colorimetric method [25] with an UV/ VIS spectrophotometer (Thermo Spectronic, UK) at 520 nm. The DE of pectin was analyzed by a method provided by CP Kelco [26]. DE was then calculated by comparison of the amounts of carboxylic acid groups before and after de-esterification.
HPSEC and molar mass detection: Waters HPSEC (Waters Inc., Milford, MA, USA) delivery system with 2-Channel Vacuum Degasser coupled with a ViscoStar model differential pressure viscometer (Wyatt Technology, USA), a Waters 2410 differential refractometer (RI), and two PL-Aquagel size exclusion columns (OH-60 and OH-40) in series and an auto sampler (717 Plus Auto Injector, Waters) were used. Dry samples (2 mg/ml) were dissolved in mobile phase (0.05 M NaNO3), centrifuged at 20,000 g for 30 minutes and filtered through a 0.22 μm Millex HV filter (Millipore Corp., Bedford, MA). The flow rate was 0.8 ml/min and the injection volume was 100 μl. Sample was run in triplicate. Column effluents were detected by ViscoStar, and a RI Detector in series. The electronic outputs from the detectors were connected to separate serial ports in the same personal computer in a manner which permitted data to be collected and processed by ASTRA 5.3.4.13 (Wyatt Technology) and Breez (Waters) software simultaneously. The columns were calibrated using a series of Pullulan standard samples (range of Mw: 30-900 × 103). Values of Mw and Mz were obtained using universal calibration. The refractive index increment (dn/dc) used was 0.134 ml/g in 0.05 M NaNO3 [27]. The experiments of pectin extraction and characterization were repeated 6 to 12 times. The most repeatable data were collected and the average was used for result interpretation.
Results and Discussion
bAsh, calcium and magnesium content in SFH residues
SFH residues had an ash content of 11.5 %, from which the amount of calcium and magnesium was found to be 1.95% and 0.77%, respectively (Table 1). Similar values were found by Edrees et al. [28]. SFH residues were washed with water and water/ethanol solutions to remove minerals, pigments, fats, and waxes [16,17]. As shown in Table 1, the ash content of SFH dropped from about 11.5% to 7% after washing. The removal of minerals and fat and wax reduced interactions between cell wall components. Thus the structure of SFH was loosened, facilitating water penetration and water absorption. This structural change was evident by the increase in degree of swelling from 2.7% for unwashed SFH to about 3.2% for the SFH washed with water and water/ethanol (Table 1). Since Ca++ and Mg++ were mainly bound to the carboxyl groups in the galacturonic acid segments of pectin, it is not surprised, the fraction of Ca++ and Mg++ in the ash of washed SFH was increased from 1.95% and 0.77% before washing to 2.02% and 0.98%, respectively.
| Treatment | Ash content, % | Ca++, % | Mg++, % | Swelling, % |
|---|---|---|---|---|
| Non-treated SFH | 11.47 | 1.95 | 0.77 | 2.72 |
| Washed with water/alcohol | 7.22 | 2.02 | 0.58 | 3.04 |
| Washed with water, then with 8.0 % NaCl | 8.95 | 0.72 | 0.14 | 3.47 |
| Washed with water, then with 2.5% SHMP | 8.23 | - | - | 3.31 |
Table 1: Ash, Ca++ and Mg++ contents in SFH residues.
Interestingly, the use of NaCl or SHMP solutions to treat the waterprewashed SFH resulted in an increase in ash content which was 8.9% for those washed with NaCl and 8.3% for those washed with SHMP, in comparison with 7% in ash content of those just washed with water and water/ethanol. These results could be attributed to the uptake of Na+ by polysaccharides in SFH residues which occurred by ionic exchange during the washing process. Table 1 shows that washing with water/ethanol could not remove Ca++ and Mg2+ ions whereas washing with 8.0% sodium chloride removed 64% of Ca++ and 82% of Mg++ from the SFH. No quantitative data was available for Ca++ and Mg++ removal from SFH by SHMP, due to the quarantine nature of SHMP presented in the washing solution. Nevertheless it could be estimated by comparing the ash content of SFH washed with SHMP and with NaCl. As shown in Table 1, the ash content in NaCl washed SFH is higher than SHF washed with SHMP. The difference could be attributed to more Na+ uptake from NaCl rather than from SHMP in the wash. In other words, we concluded that less Ca++ and Mg++ were removed by SHMP than by NaCl. Such a conclusion was reasonable in that the concentration of Na+ in 8% NaCl was about 3 times as many as that in 5.0% SHMP, although the ionic strength of 5.0% SHMP was much higher than 8% NaCl. Although both NaCl and SHMP were water soluble, NaCl dissolved in water much more readily than SHMP. It should be noted that 5.0% of SHMP was highly viscose. In fact it was difficult to make highly concentrated SHMP solutions and treat SFH with it. In the following experiment, no SHMP solutions with the concentration higher than 5.0% were used. In addition, since the Ca++ content in SFH residues were much higher than Mg++ content, the chemical association of pectin with other components in SFH tissue was mainly via Ca++ chelating, in the following experiment we mainly investigated the effect of Ca++/Na+ ion exchange on the pectin yield and the molecular characteristics of obtained pectin.
Ca++ ions isolation from SFH by NaCl and SHMP
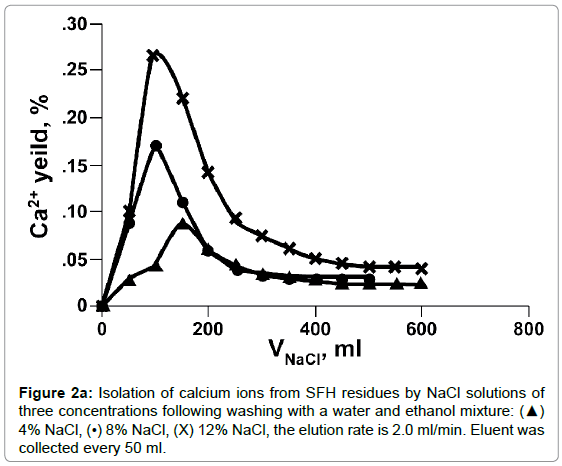
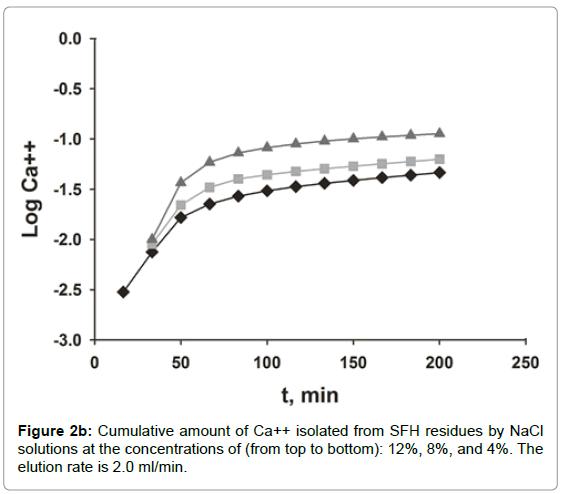
The dissociation of Ca++ from SFH residues by various concentrations of NaCl solution was evaluated by dynamic and static methods. As shown in Figures 2a and 2b, the efficacy of the calcium isolation depended on the concentration and volume of the NaCl solutions used. In Figure 2a, the curves of calcium measured in fractions of isolation solutions vs. NaCl volume displayed an asymmetrical bell shaped profile. Initially, the amount of calcium released to solutions increased quickly, reached the peak, and then dropped sharply. Beyond 200 ml, the amounts of calcium measured in the isolation solutions decreased more slowly and finally level off. Doubling the concentration of NaCl from 4% to 8%, doubled the amount of calcium isolated, also, the elution peak shifted to the left, from 150 ml to 100 ml. When the salt concentration increased to 12%, the concentration of Ca++ at the peak maximum was tripled compared that eluted with 4% NaCl. Nonetheless, the peak position did not change. Calcium isolated from SFH could also be expressed as the cumulative amount of calcium removed vs. the elution time (Figure 2b). As we can see, at a fixed elution time, the use of a more concentrated NaCl solution removed more calcium ions from SFH. For example, about 90% of calcium was isolated in 3 h by elution with 12% NaCl; while only 65% and 58% of Ca++ ions in SFH residues were replaced by 8% and 4% NaCl solutions, respectively, for the same elution period. For an isolation solution with a fixed concentration, the isolation efficiency decreased as elution time passed. The cumulative curves in Figure 2b appeared to emulate first order exponential curves. Initially, the removal of Ca++ was relatively slow (data not shown). Shortly thereafter, there was an exponential increase in Ca++ removal with time. There was a marked decrease in the rate of Ca++ removal at 75 minutes for the use of 12% NaCl solution. The remoal rate of Ca++ in the 25-75 minutes range was larger than the rate of removal below 25 minutes or above 75 minutes. The cumulative isolation curves for using 8% and 4 % NaCl isolation solutions also emulated first order exponential curves but with smaller rate constants. Clearly these results indicated that ion exchange between Na+ in the solution and Ca++ on the cell wall tissues of SFH residues was strongly dependent on the electrolyte concentration of the solvents.
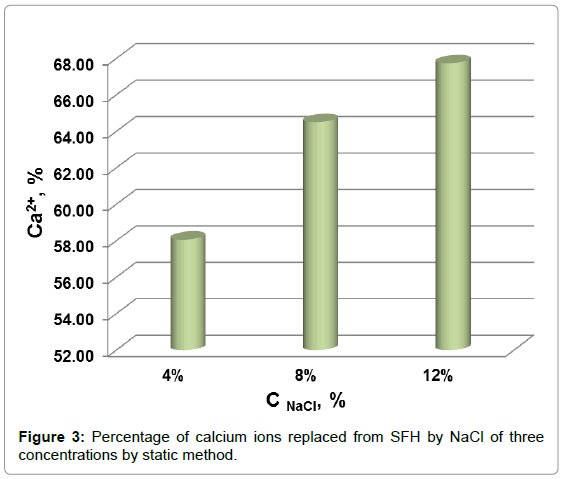
The percentage of calcium removed from SFH residues by NaCl in static mode are shown in Figure 3. The amount of isolated calcium increased from 58% to 64% when the concentration of NaCl in solution increased from 4% to 8%. Increasing the NaCl solution to 12% increased the percentage of calcium extracted to 68%. In comparison of Figure 3 to Figure 2, it can be found that the total amounts of Ca++ isolated from SFH by the static and dynamic methods were roughly the same, when NaCl solutions of same concentration were applied. However, it took much less time by dynamic method than static method to remove same amount of calcium ions. For example, about 64% of calcium could be removed by 8% NaCl in 3.5 h by a dynamic method; while to isolate the same amount of calcium using 8% NaCl by a static method required 18 h. These results showed that applying a gravity flow dynamic method to replace Ca++ with Na+ ions from SFH rather than a static method saves energy and labor.
Acid Hydrolysis of SFH and PP extraction
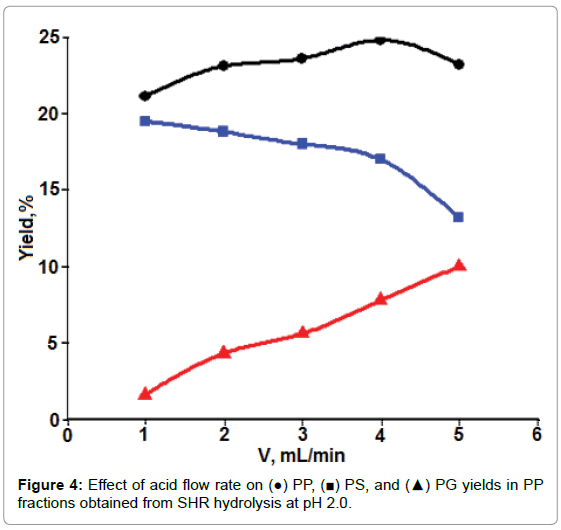
Dynamic mode: Figure 4 shows the influence of flow rate of acidic solutions on PP extraction, as well as on the yields of PS and PG in PP. More PP (the amount of PS + PG) was obtained at a higher flow rate than at the lower one under the present experimental conditions.
Furthermore, more PG and less PS were obtained when the flow rate was increased. In the case of acidic extraction of PP, PS, and PG from SFH after removing chelating reagent of divalent metal ions, there were more than one process that could occur by allowing acidic solutions to flow through. These included PP release (or intermolecular dissociation) from other cell wall polymers, diffusion of released PP through the network of other cell wall polysaccharides, and the degradation of higher molecular weight PP into small molecules. Mass diffusion and intermolecular dissociation were the processes with more or less physical/mechanical characteristics. The increase in such mechanical forces, such as eddy currents or stir rate, would certainly accelerate mass transfer. These forces were favored by an increase in flow rate [29,30]. In contrast, the acid degradation of PP is a chemical reaction that requires a relatively longer contact time period [31]. Presumably, this could explain why increasing the flow rate of the extraction solution caused an increased amount of PP with decreased PS/PG ratios. For convenience, the flow rate of 3.0 ml/min was chosen for acidic hydrolysis in following experiments in an attempt to evaluate the effects of other parameters, such as solution pH and ionic strength on the yields of PS and PP.
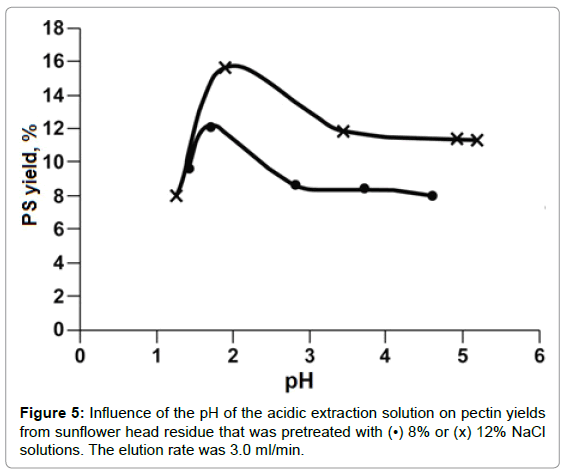
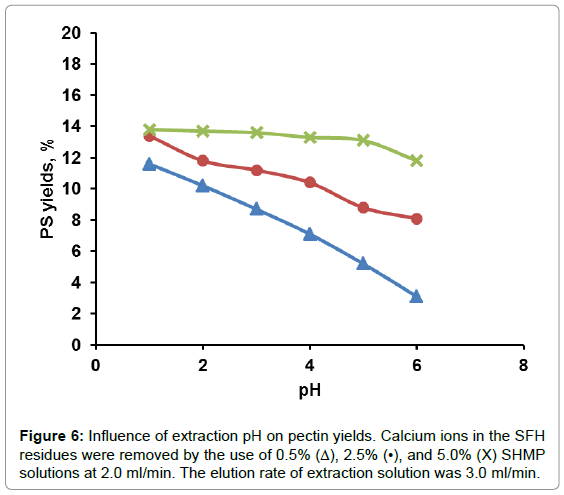
The effect of solution pH on PS yield is shown in Figure 5. At solution pH values around 1.5-2.0, PS yields reached a maximum. Beyond that pH range, PS yield decreased up to pH 3. At solution pH values ranging from 4 to 5, PP degradation was inhibited. There was no further change in PS yield could be detected. The extremely acidic solution, for example, at pH 1.2, pectin degradation supposedly should be accelerated, however, much less amount of PS were detected than that at pH 2 or higher. This could be attributed to small molecules weight PP that generated at extremely acidic solution and were alcohol soluble and couldn’t be moved out by aqueous solution. From these results, acidic solution at pH 2 was chosen as the optimal hydrolysis solution. From Figure 5, it also could be learned that at a fixed pH value more PS was hydrolyzed-produced from SFH that was pretreated with a higher rather than a lower concentrated NaCl solution. As shown in Table 1, the more Ca++/Mg++ removed from the 3D structure, the loser the cell wall structure the SFH residues became; thus facilitating the release of PP from SFH tissues and enhancing mass transportation through the structure. This trend was also observed from the hydrolysis of SFH residues that were pretreated with SHMP solutions with various salt concentrations (Figure 6). PS yields decreased with the increase in pH values of the hydrolysis solution from pH 2 to pH 6, and with the decrease in SHMP concentration used in the decoupling step. Furthermore, the comparison of Figure 5 to Figure 6 revealed that more PS was extracted from SFH residues that were pretreated with 8% NaCl than with 5.0% SHMP solutions. This finding confirms the previous conclusion that more Ca++/Mg++ ions were replaced by Na+ ions from 8% NaCl solution than from 5.0% SHMP solution (Table 1).
Galacturonic acid (GalA) content is the most important component in determining the physical, chemical, and biological properties of pectin [32], pectin gels [33], and other pectin-derived substances [34,35]. Table 2 summarizes the effects of salts in solutions used to remove Ca++ and Mg++, and pH values of the elution solutions used in the followed step of acidic extraction on the anhydrogalacturonic acid (AGalA) content in soluble pectin fractions (PS). In general, AGA content in extracted PS decreased with increasing pH values. Typically, AGalA content increased with the increase in salt concentration of the isolation solutions except in a few cases where small variations were observed for samples pretreated with 2.5 and 5.0% SHMP solutions. Table 2 also showed some differences in AGalA content between samples pretreated with NaCl and SHMP; however, no meaningful analysis could be performed unless further study is conducted.
| pH of Elution Solution |
Concentration of SHMP in isolation solutions, % |
Concentration of NaCl in isolation solutions, % |
||||
|---|---|---|---|---|---|---|
| 0.5 | 2.5 | 5.0 | 4.0 | 8.0 | 12.0 | |
| 1.60 | 66.4 (0.3) | 68.6 (0.2) | N/D | 67.4 (2.4) | 69.2 (2.2) | 69.4 (4.3) |
| 2.00 | 65.0 (0.2) | 66.4 (3.3) | 68.0 (4.1) | 64.2 (1.3) | 68.2 (3.1) | 66.6 (0.3) |
| 3.50 | 62.0 (1.4) | 65.2 (2.9) | 67.2 (3.2) | 63.2 (0.7) | 65.4 (0.1) | 66.5 (5.2) |
| 5.60 | 58.2 (0.5) | 64.6 (2.5) | 66.0 (0.8) | 60.8 (4.1) | 62.6 (1.6) | 66.0 (0.8) |
Table 2: Effects of salt concentrations and solution pH on AGalA content in PS (%).
Static mode: For the purpose of comparison to the dynamic method, the static method was applied to the extraction of pectic polysaccharides from SFH residues after calcium ions in the residues were isolated either by NaCl solutions or by SHMP solutions. The resultant PP in the extraction solutions was analyzed for PS, PG, and AGalA contents (Table 3). Consistent with extraction results from the dynamic method, results from the static method showed that more PS was extracted from the SFH residues by NaCl pretreatment than by SHMP. When NaCl solution was used for isolation, PS yield increased with increased NaCl concentration. Similar results were also observed for SFH treated with SHMP solution, except for a few exceptions. Furthermore, pH values of the extraction solutions, as well as the types and the concentrations of isolation solutions gave similar results on AGA content in PS fractions as was found by the dynamic method (Table 2). Finally, more PS was obtained from SFH residues by the dynamic method than by the static method, when the extraction solution was at pH 2.0.
| pH of acidic extraction solutions |
% NaCl in isolation solutions | PP yield, % | AGalA, % in PS |
% of SHMP in isolation solutions | PP yield, % | AGalA, % in PS |
||
|---|---|---|---|---|---|---|---|---|
| PG | PS | PG | PS | |||||
| 1.6 | 4.0 | 2.1 | 8.7 | 60.2 | 0.5 | N/D | 5.6 | 58.5 |
| 8.0 | 2.2 | 11.2 | 58.8 | 1.5 | N/D | 6.4 | 62.9 | |
| 12.0 | 1.4 | 13.6 | 69.6 | 2.5 | N/D | 7.8 | 60,4 | |
| 2.0 | 4.0 | 0.4 | 7.1 | 57.2 | 0.5 | N/D | 4.7 | 54.4 |
| 8.0 | 1.0 | 10.4 | 55.2 | 1.5 | N/D | 5.3 | 62.0 | |
| 12.0 | 0.8 | 13.3 | 66.0 | 2.5 | N/D | 6.5 | 62.6 | |
| 3.5 | 4.0 | 0.1 | 5.2 | 54.2 | 0.5 | N/D | 3.6 | 50.4 |
| 8.0 | 0.3 | 8,8 | 50.4 | 1.5 | N/D | 4.5 | 60.0 | |
| 12.0 | 0.8 | 13.1 | 66.7 | 2.5 | N/D | 5.3 | 60.4 | |
Table 3: Pectin yield and GalA content in hydrolytic solutions prepared by the static method.
Molecular characterization of pectin prepared from SFH residues by kinetic method: Based on the above experiments, sunflower pectin was prepared with the dynamic model, using 8% NaCl as the isolation solution at a flow rate of 2.0 ml/min at 70°C followed by extraction with pH 2 acidic solutions at a flow rate of 3.0 ml/min at 85 °C. Extraction fractions, 50 ml for each, were collected. PP was separated into PS and PG. These were analyzed for viscosity, [η], number-average molecular weight (Mn), weight-average molar weight (Mw), and molecular polydispersity (Mw/Mn). Table 4 shows Mw and [η] of the pectin in PS obtained from the first 8 fractions of the eluents. Fractions 3, 4 and 5 had the highest values of Mw among the 8 fractions collected. Their Mw values ranged from 146 to 162 K Da with relatively large polydispersities. These fractions as a group also showed higher intrinsic viscosities, [η]. Consequently, the PG of correlative fractions had lower Mw values. It should be noted that the molecular weight detected by universal calibration correlated very well with that obtained from the MALS method (compare sample #6 and #6* in Table 4). It demonstrates the efficacy of applying a simple instrumental method using ViscoSatr coupled with refractive index detection and the universal calibration procedure in detecting Mw and MWD of biopolymers.
| PP fractions | PS | PG | ||||||
|---|---|---|---|---|---|---|---|---|
| Mwx10-3 Dalton |
Mzx10-3 Dalton | Mw/Mn | Rhw, nm | a** | Mwx10-3 Dalton |
Mw/Mn | Mzx10-3, Dalton |
|
| 1 | 124.3 | 1386 | 8.6 | 8.7 | 0.43 | 33.2 | 7.5 | 89 |
| 2 | 95.4 | 738 | 5.3 | 8.3 | 0.46 | 39.5 | 3.8 | 126 |
| 3 | 152.7 | 2022 | 8.8 | 9.2 | 0.45 | 48.2 | 3.3 | 228 |
| 4 | 145.5 | 1901 | 6.6 | 8.8 | 0.44 | 40.5 | 3.8 | 122 |
| 5 | 161.5 | 1887 | 12.2 | 9.1 | 0.43 | |||
| 6 | 127.3 | 1600 | 7.3 | 8.7 | 0.44 | |||
| 6* | 129.0 | - | 3.13 | 20 | - | |||
| 7 | 76.8 | 820 | 23.2 | 7.2 | 0.39 | |||
| 8 | 87.0 | 921 | 13.3 | 7.5 | 0.40 | |||
Table 4: Molecular characteristics of SFH pectins obtained by HPSEC examination.
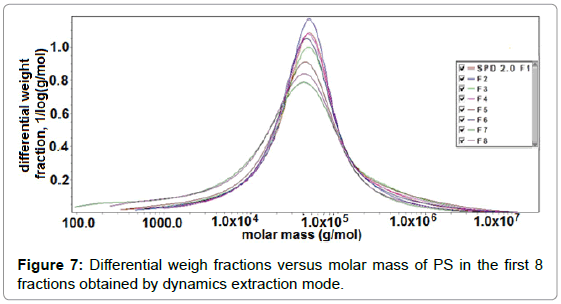
It was also found that there was a lack of correlation between Mw obtained by capillary viscometer (data not shown) and that from SEC. Possibly this lack of correlation could be attributed to much higher concentrations being measured by capillary viscometer than by SEC. It has been shown that pectins undergo concentration dependent aggregation [36]. Differential weight fraction as a function of molar mass for the 1st eight fractions collected as obtained by dynamic extraction is shown in Figure 7. ASTRA software allowed assessment of the molecular shape based on the measured molar mass and rms radius. A plot of log rms radius against the log of the molar mass, called a Conformation Plot, showed the relationship between the two quantities. The slope of this graph gave a good estimate of the shape. The slope was approximately 0.33 for hard spheres or compact molecules. Random coils or less compact molecules often have slopes in the range of 0.5 - 0.6, whereas rods or highly extended molecules had a slope which was approximately 1.0. The shape factor, “a”, in series of pectin fractions extracted at pH 2.0 and 1.2 respectively from SFH (Tables 4 and 5) ranged from 0.39 to 0.46. These values revealed that the soluble pectins ranged in size somewhere between that of a hard sphere and a random coil. Possibly, this size range was observed because all pectin fractions were highly aggregated due to their low DE. Furthermore, the large values of Mz also might be the indicative of macromolecular aggregation [37,38].
| PP fractions | Mwx10-3 Daltons | Mzx10-3 Daltons | Mw/Mn | [η], ml/g | Rhw, nm | a |
|---|---|---|---|---|---|---|
| 2 | 90.0 | 580 | 15.0 | 35.9 | 6.7 | 0.41 |
| 4 | 123.5 | 709 | 15.8 | 48.2 | 7.9 | 0.43 |
| 5 | 73.6 | 276 | 10.6 | 30.4 | 6.2 | 0.40 |
| 6 | 90.5 | 329 | 7.0 | 47.1 | 7.8 | 0.41 |
| 8 | 73.6 | 165 | 10.1 | 30.5 | 6.4 | 0.40 |
Table 5: Molecular characteristics of PS extracted from SHF residues with 8% NaCl followed by acidic solution at pH 1.2.
The molecular characteristics of PS obtained by hydrolysis at pH 1.2 are shown in Table 5. Comparing them with data shown in Table 4, confirmed that the higher acidic condition, i.e. pH 1.2, lead to pectin degradation, which is undesirable for most applications.
Conclusion
We have developed a gravity flow dynamic method for the extraction of pectin polysaccharides from SFH residues, a byproduct of sunflower oil processing. The procedure consisted of two steps. The first step was calcium isolation using an 8% NaCl solution, whereas the second step was an extraction of PS at pH 2.0. The dynamic method was more efficient than the static method with respect to pectin yield, processing time, and energy-consumed. In comparison with SHPM, NaCl was easier to dissolve in water. Thus one could apply NaCl solutions of a higher salt concentration than SHPM for calcium isolation. Consequently, more rapid calcium isolation was possible with NaCl than with SHMP. Therefore NaCl also expedited over SHMP the pectin extraction step which followed.
Sunflower is a major economic crop in Central Asia, where there are abundant rock salt reserves also available in the Fergana Valley area spreading across eastern Uzbekistan, Kyrgyzstan, and Tajikistan. The use of domestic chemicals to intensify pectin extraction from SFH residues should be able to further lower the cost of pectin production in those countries.
Acknowledgement
This study was supported by USDA-ARS Bio secure Engagement Project, T-1419/1420 with the Chemistry Institute of Tajikistan Academy of Sciences.
Mention of trade names or commercial products in this article is solely for the purpose of providing specific information and does not imply recommendation or endorsement by the U.S. Department of Agriculture. USDA is an equal opportunity provider and employer.
References
- Liu LS, Fishman ML, Kost J, Hicks KB (2003) Pectin-based systems for colon-specific drug delivery via oral route. Biomaterials 24: 3333-3343.
- Food and Agricultural Organization of the United Nations (1969) Nutrition Meeting. Rep Ser No 46A.
- Whistler RL, BeMiller JN (1973) Industrial gums-polysaccharides and their derivatives. New York: Academic press.
- Yalpani M (1988) Polysaccharides-synthesis,modification, and structure/property relations. New York.
- Zykwinska A, Boiffard MH, Kontkanen H, Buchert J, Thibault JF, et al. (2008) Extraction of green labeled pectins and pectic oligosaccharides from plant byproducts. J ArgFood Chem56: 8926-8935.
- PtichkinaNM, Markina OA, Rumyantseva GN (2008) Pectin extraction from pumpkin with the aid of microbial enzymes. Food Hydrocolloid22:192-195.
- Min B, Lim J, Ko S, Lee KG, Lee SH (2011)Environmentally friendly preparation of pectins from agricultural byproducts and their structural/rheological characterization. BioresourTechnol102: 3855-3860.
- Panchev I, Kirchev N, Kratchnov C (1988) Improving pectin technology. Int J Food SciTechnol 23: 337-341.
- Oosterveld A, Beldman G, Schols HA, Voragen AGJ(2000) Chracterization of arabinose and ferulic acid rich pectic polysaccharides and hemicelluloses from sugar beet pulp. CarbohydrRes 328: 185-189.
- Liu Y, Shi J, Langrish TAG (2006) Water-based extraction of pectin from flavedo and albedo of orange peels. ChemEng 120: 203-209.
- Shin HH, Kim CT, Cho YJ, Hwang JK (2005) Analysis of extruded pectin extraction from apple pomace by response surface methodology. Food Sci. Biotech14: 28-31.
- Fishman ML, Chau HK, Hoagland P, Ayyad K (2000) Characterization of pectin, flash-extracted from orange albedo by microwave heating under pressure. Carbohydr Res 323: 126-138.
- Miyamoto A, Cheng KC (1992) Extraction and physiochemical characterization of pectin from sunflower head residues. J Food Science57: 1439-1443.
- Wang K, Hua Y, Yang R, Kang T, Zhang W (2014) Hydrodynamic behavior and gelling properties of Sunflower head pectin in the presence of sodium salts. Food Hydrocolloid 36: 238-244.
- Hua Y, Wang K, Yang R, Kang T, Kang J, et al. (2015) Rheological properties of natural low-methoxyl pectin extracted from sunflower head. Food Hydrocolloids 49:122-128.
- Kim WJ, Sosulski F, Campbell SJ (1978) Formulation and characteristics of low-ester gels from sunflower pectin. J Food Sci 43: 746-749.
- Kim WJ, Sosulski F, Lee SCK (1978) Chemical and gelation characteristics of ammonia-demethylated sunflower pectins. J Food Sci 43: 2436-1439.
- Chang KC, Dhuranhar N,You X, Miyamoto A (1994) Sunflower head residue pectin extraction as affected by physical conditions. JFood Sci59: 1207-1210.
- Shi XQ, Chang KC, Schwarz JG, Wiesenborn DP, Shih MC (1996) Optimizing pectin extraction from sunflower heads by alkaline washing.BioresourTechnol58: 291-297.
- Iglesia MT, Lozano JE (2004) Extraction and characterization of sunflower pectin. J Food Eng 62: 215-233.
- MohamadzadehJ, Sadeghi-Mahoonak AR, Yaghbani M, Aalami M (2010) Extraction of pectin from sunflower head residues of selected iranian cultivars. World ApplSci J8: 21-24.
- Horwitz W (1970) Official Methods of Analysis of the Association of Official Analytical Chemistry 11th edition, Washington DC, USA.
- Yalpani M, (1988) Polysaccharides synthesis modifications and structure/property relations. Elsevier Science Publisher BV, New York, USA.
- Liu LS, Liu CK, Fishman ML, Hicks KB (2007) Composite films from pectin and fish skin gelatin or soybean flour protein. J. Agr. Food Chem55: 2349-2355.
- Filisetti TM,Carpita NC (1991) Measurement of uronic acids without interference from neutral sugars. AnalBiochem 197: 157-62.
- Fishman ML, Chau HK, Kolpak F, Brady JJ (2001) Agric Food Chem. 49: 4494-4501.
- Edrees M, Shaulkamy MS, Mabrouk SS, Abdel Fattah AF, (1976)QualitasPlantarum.25: 247-252.
- Marinsky JA, Marcus Y (1979) Ion exchange and solvent extraction Vol. 7, Marcel Dekker Inc. New York.
- Xi HD, Lu QS, Young FY, Liu LS (1982) Mechanism on ion exchange and solvent extraction Guangdong Science and Technology Publisher. Guangzhou China.
- Willats WGT, McCartney L, Mackie W, Knox JP Pectin (2001) cell biology and prospects for functional analysis. Plant MolBiol 47: 9-27
- Liu LS, Fishman ML, Hicks KB, Kende M (2005) Interaction of various pectin formulations with porcine colonic tissues. Biomaterials 26: 5907-5916.
- Liu LS, Won YJ, Cooke PH, Coffin DR, Fishman ML, Et al. (2004) Pectin/poly(lactide-co-glycolide) composite matrices for biomedical applications. Biomaterials 25: 3201-3210.
- Liu LS, Cooke PH, Coffin DR, Fishman ML, Hicks KB (2004) Pectin and polyacrylamide composite hydrogels: effect of pectin on structural and dynamic mechanical properties. J Appl Poly Sci 92: 1893-1901.
- Yoo SH, Fishman ML, Hotchkiss Jr AT, Lee HG (2006) Viscometric behavior of high-methoxy and low-methoxy pectin solutions. Food Hydrocoll 20: 62- 67.
- Podzimek S (2010) Light Scattering Size Exclusion Chromatography and Asymmetric Flow Field Flow Fractionation Powerful Tools for Characterization of Polymers and Nanoparticles. John Wiley & Sons Inc pp.359.
- Muhidinov ZK, Jonmurodov AS, Teshaev KhI, Fishman MLA (2011) Newfactor effecting gel strength of pectin. Wageningen the Netherlands.
Citation: Muhidinov ZK, Khalikov DK, Fishman ML, Liu LinShu (2017) Gravity Flow Dynamic Method for Pectin Extraction from Sunflower Head using Sodium Chloride. Biopolymers Res 1:101.
Copyright: © 2017 Muhidinov ZK, et al. This is an open-access article distributed under the terms of the Creative Commons Attribution License, which permits unrestricted use, distribution, and reproduction in any medium, provided the original author and source are credited.
Share This Article
Recommended Journals
Open Access Journals
Article Usage
- Total views: 11299
- [From(publication date): 0-2017 - Dec 22, 2024]
- Breakdown by view type
- HTML page views: 10430
- PDF downloads: 869
