Global Warming Climate Change and Sea Level Rise: Impact on Land Use Land Cover Features along UAE coast through Remote Sensing and GIS
Received: 16-Apr-2022 / Manuscript No. jee-22-61043 / Editor assigned: 18-Apr-2022 / PreQC No. jee-22-61043 (PQ) / Reviewed: 02-May-2022 / QC No. jee-22- 61043 / Revised: 06-May-2022 / Manuscript No. jee-22-61043(R) / Accepted Date: 12-May-2022 / Published Date: 12-May-2022 DOI: 10.4172/2157-7625.1000329
Abstract
Global warming induced eustatic rise in sea level is mainly by thermal expansion and addition of ice-melt water, respectively. Sea-level rise in Arabian Gulf which is a consequence of global warming will affect almost all the emirates in UAE. Although IPCC (2019) estimated a maximum possible sea-level rise of 1.1 m, other estimates shows a rise of ≥ 1m by the 2100 AD. The low-lying coastal zones are more vulnerable to rising sea levels as they face submergence or saltwater intrusion which affects different land use/land cover features. Geomatics based models on the possible impact of the predicted sea level rise on coastal Land Use/Land Cover (LULC) features are necessary to initiate appropriate mitigation plans. The present study is an attempt in this direction taking the UAE coast as an example. The LULC of the UAE coast was mapped through the interpretation of the Sentinnel-2 imagery from 2019. SRTM digital elevation models coupled with landform evidences have been used to interpolate contours at 1m interval, although vastly approximate, for the entire UAE coastal region. If the sea level rise by 1m, about 571 km2 area including present intertidal wetlands and shrubs, mangroves, built-up residential and under development areas would be effected along the study area of 500-km long UAE coast displacing about 85% inhabitants and their economic activities. The coastal areas of Abu Dhabi, Dubai, Umm Al Quwain, Ras Al Khaimah, and Fujairah would be the worst hit areas in the region.
Keywords
Sea-level rise; Possible impact on coastal land use/land cover; UAE Coast; Geo-spatial technology; GIS; Remote sensing
Introduction
Climate change postures a perilous challenge to the entire world today. The levels of carbon dioxide and climate change the world set for new records for global temperatures, hurricanes, and arctic sea ice loss in 2020 [1]. Anthropogenic activities of modern age such as deforestation, fossil fuel burning, draining of wetlands, adoption of modern technologies in farming etc., are the main reasons for the present degraded state of the global environment. Earlier, during the pre-industrial revolution times, the impact of these kind of activities on climate and environment are almost negligible and irrelevant. It is gauged that anthropogenic activities have triggered global average temperatures to rise by 1°C above pre-industrial levels, and with a likely range of 0.8°C to 1.2°C [2]. If the global warming persists at the current rate, it is apparent to reach 1.5°C between 2030 and 2052 [3]. Meanwhile, incontrovertible evidence of this climate crisis can be observed in a shrinking Greenland Ice sheet [3], increased ocean heat content [4] and a particular sensitive species shifting towards the pole [5]. Climate Change, Global Warming and more recently Climate Emergency have been, in the past decade and longer, terms tantamount with the greatest sustainability challenge of the 21st century [6-9].
The consequences of dangerously increased greenhouse gases like carbon dioxide in the atmosphere are already perceptible. At present, (April 2022) the atmospheric carbon dioxide levels are at 418.81 ppm (http:// co2now.org/) an increase of about 150 ppm from its pre-industrial levels of 270 ppm [10]. Atmospheric warming leads to increased evaporation of ocean water and the resultant rise in the water vapour content in the atmosphere would trap more heat setting in a cascading effect [11]. Warming of Earth to such a level as mentioned above would lead to severe consequences such as increasing frequency of extreme weather conditions like droughts, floods and heat waves than estimated before [12]. Moreover, as the global climate change affects regional climates, the water resources, agriculture and economy of the regions are, in turn, significantly affected [13].
Climate change vindication is a technological measure which aims to reduce the amount of anthropogenic emissions of greenhouse gases [14], it can be done in different ways: firstly the mitigation technologies, which focus on reducing fossil-based CO2 emissions, including nuclear power, renewable energies, and lastly carbon capture and storage [15,16], secondly, negative emissions technologies like afforestation, land management to increase and fix carbon in soils, enhanced weathering, bioenergy production with carbon capture and storage, which aim to capture and sequester atmospheric carbon to reduce carbon dioxide levels, DACCS (Direct Air Carbon Capture And Storage), and ocean fertilization [17-19] and finally geo engineering techniques that change the Earth’s radiative energy budget to stabilize or reduce global temperatures, such as stratospheric aerosol injection, and marine cloud brightening [20, 21]. Controlling in one way or the other and reversing climate change is expected to be a major concern and responsibility for mankind in the present century.
Alternatively, global warming also leads to eustatic sea level rise [22] due to thermal expansion of seawater and addition of ice-melt water [23-26]. As per Lindsey (2020) [27], based on the data captured by the National Oceanic and Atmospheric Administration (NOAA), sea levels rose by 1.4 mm/year most of the 20th century, and the process accelerated to 3.6 mm/year as per 2006-2015 data. For further accurate projections, modeling sea level rise requires the use of coupled iceatmosphere- ocean general circulation models. IPCC (2018) modelbased projections of global mean sea level rise (relative to 1986-2005) suggest an indicative range of 0.26 to 0.77 m by 2100 for 1.5oC of global warming and 0.36-0.88 m for 2oC. The very next year the IPCC (2019) projected a higher increase of 0.61-1.1 m by 2100 under the RcP8.5 scenario. Sea levels will continue to rise well beyond 2100, and the magnitude and rate of this rise will depend on future emission pathways. Some studies predicted as much as 7.5 m of sea level rise by 2200 in the case of instabilities [28]. The direct impact of the sealevel rise is on the different land use land cover features along the coastal zones, which, in-spite of being highly resourceful and densely populated, are low-lying and hence would be subjected to accelerated erosion and shoreline retreat due to increased wave strength as water depth increases near the shore [29,30], besides leading to saltwater intrusion into coastal groundwater aquifers, inundation of wetlands and estuaries and threatening historic and cultural resources as well as infrastructure [31]. The increased sea-surface temperatures would also result in frequent and intensified cyclonic activity and associated storm surges affecting the LULC features along the coastal zones [32, 33]. So the collaboration between sea level researchers and decision makes are important at this stage as the damage and disruption caused by coastal catastrophic disasters annually cost at least $ 390 billion in low and middle income countries. But $ 1 spent on disaster prevention can save $ 15 in future damages [34].
There is a direct relationship between the amount of CO2 emissions and economic growth in recent decades [35], the long term future of the world’s economy depends on moving away from the fossil fuels [36], as the Arabian Gulf countries emit ~ 5.5% of global CO2, a figure that has doubled since the 1980’s [37]. Socio-economic impacts of this global decision [38] on oil producers such as Arabian Gulf countries, is a matter of concern. At the juncture, the Arabian Gulf countries are facing with a dual dilemma relating to their role as a major supplier of fossil fuels and also its high sensitivity to the environmental impacts of global climate change for which these fuels are responsible [39]. Similar to other places in the world, the Arabian Gulf is also experiencing environmental degradation due to severe natural and anthropogenic stressors [40]. In the Arabian Gulf region, data from the Global Historical climatology Network monthly (GHcNm) for 357 stations suggested that the temperature over the region has increased by at least 2°C [37], coupled to that, even the sea surface temperatures are also in the increasing trend [41]. It is chronicled earlier that years 2020 and 2016 are tied as the warmest years since temperature records began. Continuing the warming trend, the globally averaged temperature in 2020 was 1.02°C warmer than the baseline 1951-1980 mean. The coastal regions of UAE is shallow and ranges between 5 to 15 m. The UAE also has extended coastal zones of less than 5 m depth. A UNDP (2010) report concluded that MENA is one of the region’s most vulnerable to climate change impacts. Alothman (2014) [43] showed atmospheric pressure changes of the order of 10 m bar in the Arabian Gulf corresponds roughly to an annual variation of 10 cm in sea level [44].
It’s well reported before that the extensive withdrawal of oil and gas and groundwater should promote land subsidence [43, 45]. This land subsidence apart from global warming induced Eustatic Sealevel rise, may also could accelerate the sea level rise impacts upon the coastal cities and low-land coastal areas in UAE. The ingress of tsunami waves is more likely to enter the Arabian Gulf through the Strait of Hormuz if strong marine earthquake occur, as the Arabian Gulf is close to the Makaran Subduction zone in the Sea of Oman, which is one of the structurally active geologic regions with anticipated marine earthquakes [46, 47]. The impact will be most significant along the Musandam Peninsula of Oman along within the UAE. Historically, the Arabian Gulf has experienced a sea transgression during the Late Holocene, where the inundation by 1-2 m sea level rise above the current level occurred along the Arabian Gulf coasts and covered conspicuous areas in southern Iraq [48]. The population of the Arabian Gulf countries is significantly concentrated near the coast in UAE, Qatar, Kuwait and Bahrain. Currently, more than 180 million people live in the Arabian Gulf countries, and in that more than 26 milllion live in its coastal zones [37].
However, UAE is particularly vulnerable to sea level rise as the DEM revealed that the low-lying UAE coastline is shallow-sloping (about 35 cm per km) therefore highly susceptible to potential flooding [49] of most of the populated areas as they are settled on low elevated terrains. With over 85% of the population and more than 90% of the UAE’s infrastructure situated within several meters of present day sea level [50], people are susceptible to flooding, erosion, saltwater intrusion, and loss of coastal ecosystems. As studied earlier, approximately 53.474 km2 of land reclamation occurred particularly in Dubai for the last 15 years [51].
The protection of low-lying areas against sea level rise, flooding and other phenomenon related to climate change is an extremely costly and complex process. When Netherlands started facing such threats, they are clearly capable to deal with it by following a long term defence strategy, even though around one-third of the country lies below sea level [52]. Same way Germany also invested a lot in coastal protection [53]. In responding to the effects of rising sea levels, it is imperative to know the area’s most vulnerable to flooding. This knowledge enables decisions on the protection of the key areas or withdrawal in the case of less important areas [54]. There are indications that sea levels are increasing along the Arabian Gulf coast too. Studies based on the analysis of long term tide gauge data from various stations in the Arabian Gulf regions, corrections/adjusted to the vertical land movements included, indicated that sea levels are rising at an average rate of 2.85 mm/year from 1993 onwards [37,55]. This rising in sea levels will definitely affect the UAE with pronounced erosion along certain sections of the coast. This study, therefore, is an attempt to map the areas that are directly affected by the predicted sea level rise by 1 meter and the magnitude of its impact on the different land use/ land cover features in various coastal sectors of UAE using the remote sensing and GIS techniques.
Study Area
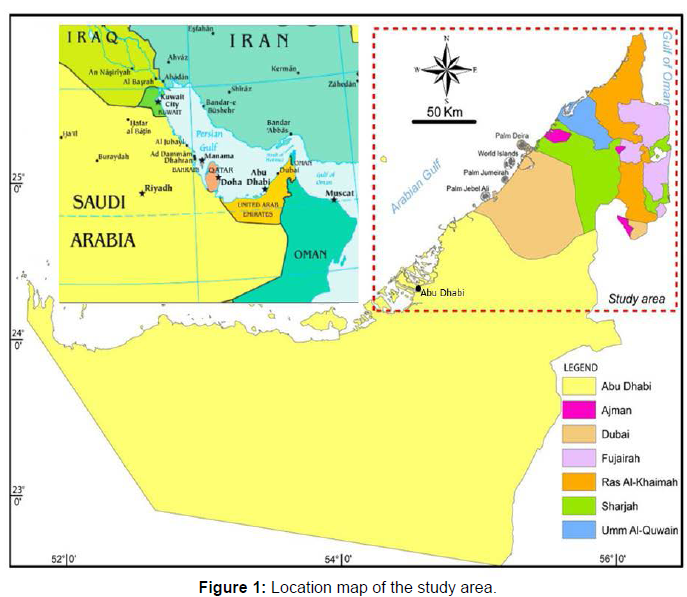
The United Arab Emirates (UAE) is part of the geographic region called as the Middle East. It consists land mass of 83000 km2, predominantly desert & mountains, bordering Oman to the east, Saudi Arabia to the south and west as well as sharing maritime borders with Islamic republic of Iran to the north and Qatar to the west. The Arabian Gulf is a large, warm, shallow semi-enclosed body of water with manifold oceanography and geomorphological history (Garland, 2010). The Arabian Gulf is an inland sea of an approximately 251,000 km2 with its longest axis of 816 km and its width comprising of 250- 300 km. The narrowest width of the Arabian Gulf is 56 km at the strait of Hormuz. The Arabian Gulf mostly a shallow water body, where its maximum water depth is around 100 m and its average depth is less than 50 m. The depth in the offshore zone of the Arabian side does not exceed 50 m [56]. The deepest region is very close to the Iranian side, with a maximum depth of about 80m. The UAE is a coalition of seven emirates consisting of Abu Dhabi (Capital), Dubai, Sharjah, Ajman, Umm Al Quwain (UAQ), Ras Al Khaiman (RAK), and Fujairah. The UAE is in-between 22°30’ and 26°10’ north latitude and 51° and 56°25’ east longitude. The UAE coastline is approximately more than 1000 km along the southern shore of the Arabian Gulf. The present study area is approximately 500-km-long coast of UAE (represented by dotted box in the Figure 1) including all the coastal Emirates (Figure 1). The shoreline for Abu Dhabi in the study area is taken around 146 km long out of approximately 500 km, as the south-western part of the Abu Dhabi is not much developed therefore there is no much population and activity in the southern part. UAE has the authority over almost 200 small islands, and an increasing number of near-shore man-made structures. Most of the structures which are natural and man-made islands like Saadiyat in Abu Dhabi is three meters above sea level. The predominant coastal sector north of UAE is characterized by headland-bay configuration with a large number of rock promontories (breakwaters) protrudes into the sea, especially along Fujairah and Ras Al Khaimah coast. The worth of the present infrastructures, mainly in the capital city of Abu Dhabi, Dubai and Ras-Al Khaimah, constructed on many natural and man-made islands is enormous. Especially Dubai and Abu Dhabi has a numerous near shore manmade and natural islands like Palm Jumeirah, Palm Jebel Ali, World Islands, Palm Deira, Saadiyat Island, Yas Island, which are the most attractive and touristic along the Coast. UAE is densely populated with Dubai city having 3,297,980, Abu Dhabi city consists of 1,807,000, Sharjah City 1,274,749, Ajman City 226,172, RAK City 115,949, UAQ City 61,700, Khor Fakkan 39,151 and Kalba 37,545 [51].
Materials and Methods
The overall aim of the present methodology is to develop an objective method to identify those land use/land cover features along the UAE coast at risk due to eustatic (global) sea-level rise. The impending sea-level rise is likely to increase before speedingup shoreline erosion and damage to seaside structures, therefore making UAE coast more susceptible in future. The sentinel images were geocoded and seamlessly assembled to form a single contiguous image of the entire 500 km-long coast. The image mosaic was then subset by taking the landward limit of the coast approximately upto 5-m contour. The land use / land cover features along the UAE coast within the approximate 5-m elevation have been interpreted and traced through onscreen digitization from Sentinnel-2 images covering the entire UAE. For this reason, all the land use classes up to Level III of the widely used National Remote Sensing center (NRSC) classification, are extracted to the extent discernible from the relatively high resolution Sentinnel-2 imagery, substantiated by extensive field observations. In order to generate an approximate 1-m contours, Digital Elevation Models (DEM) of the UAE coast, available from the Shuttle Radar Topographic Mission (SRTM) website (www.srtm.csi-cgiar.org), were downloaded from which contours at 1m interval were interpolated using 3-D Analyst module in ArcGIS software. The imprecisions in the contours generated have been adjusted to some extent, based on the landforms in the area (interpreted from the satellite imagery), and spot heights from the topographic maps. Later, 1-m contour is then overlaid on the land use/land cover features to extract data on the area statistics of various land use/land cover features getting effected due to SLR using standard GIS techniques.
Results
Considering the most accurate estimates on possible sea-level rise which is about 1.0m to 1.5 m [57, 58] at an average value of 1.24 m [59, 60] and 1m average estimated rise by 2100 AD [3], the minimum estimated rise of 1.0 m is taken in the present study to compute its possible impact on the existing land use/land cover along the UAE coast.
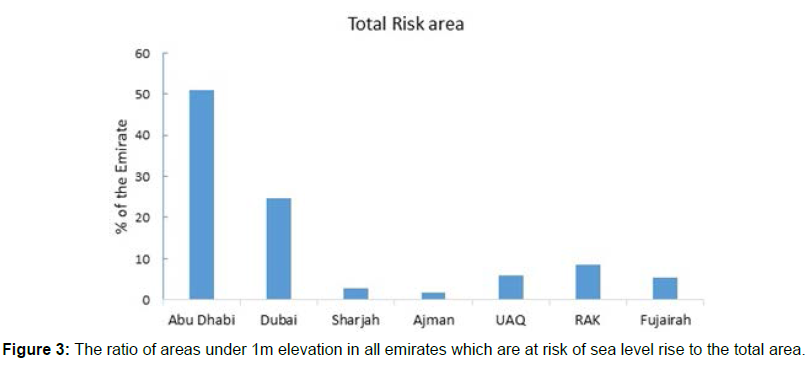
The calculations showed that the most of the area under 1 m contour in different emirates which are at risk from rising sea levels in the UAE are Abu Dhabi (47.96% of the total UAE area), Dubai (29.6%), Umm Al Quwain (5.5%), Ras Al Khaimah (7.8%), Fujairah (4.9%) and minimal in Ajman (1.63%) & Sharjah (2.61%) as shown in (Figure 3).
While the percentage analysis can give a quick overview of the ratio of inundation for each emirate, it would be safer to acknowledge the area in square kilometers to have a clear idea of the actual flooding. More specifically total coastal area of 291.9 km2 in Abu Dhabi might be flooded by 2100 AD, 141.51km2 in Dubai, 33.8km2 in UAQ, 48.3 km2 in RAK, 30.4 km2 in Fujairah, 16.01 km2 in Sharjah, and finally 10 km2 in Ajman respectively. Hence, Abu Dhabi, Dubai, UAQ, RAK, and Fujairah are the emirates with the highest loss in terms of coastal area extent.
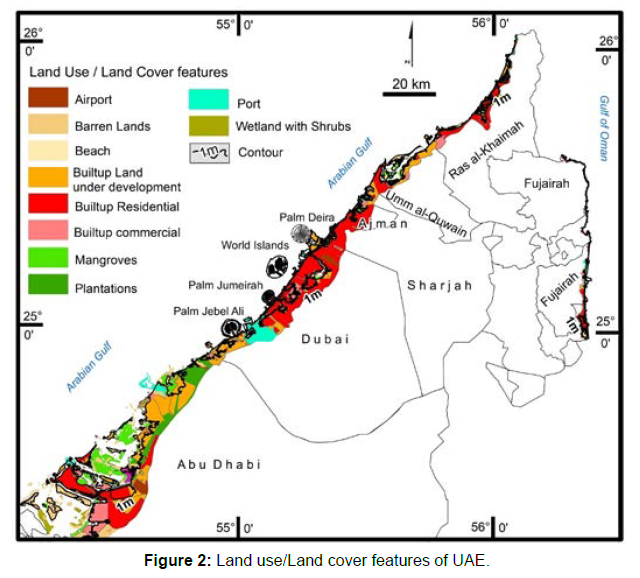
Coastal zones are most vulnerable for Land Use/Land Cover (LULC) changes in this rapid urbanization and industrialization epoch. It is necessary to study the LULC along the coastal zones in order to develop efficient management strategies. A LULC map (Figure 2) is essential to understand the different classes in a particular region in order to analyze the risk due to eustatic sea-level rise. LULC of a particular region is completely dependent on the anthropogenic activities [35] in addition to the climate changes. Urban areas along the shores of Abu Dhabi, Dubai, and Ras Al-Khaimah (RAK) makes the UAE coastal zone more susceptible to the impending sea-level rise. In the current study, a LULC map is prepared (which is below the approximate 5-m contour) by image interpretation and on-screen digitization of various features in ArcGIS 10.6 on 20 m spatial resolution Sentinel 2A image pertaining to 2019. From the LULC map, which is prepared for the entire coastal region of UAE, it can be seen that the LULC features under the 1-m elevation comprises of Built-upland residential covers 26% of the total area, most of it is distributed along the coast in Dubai, Abu Dhabi, UAQ and RAK. Built-upland under development is 22% in the entire UAE having 126 km2, which clearly shows the region is undergoing the construction boom. Industrial and commercial areas comprises of 5% of the total UAE area. Mangroves constitute of 23% along with 5.4% with mudflats and shrubs, and only 1% of the total area comprises of sandy beaches.
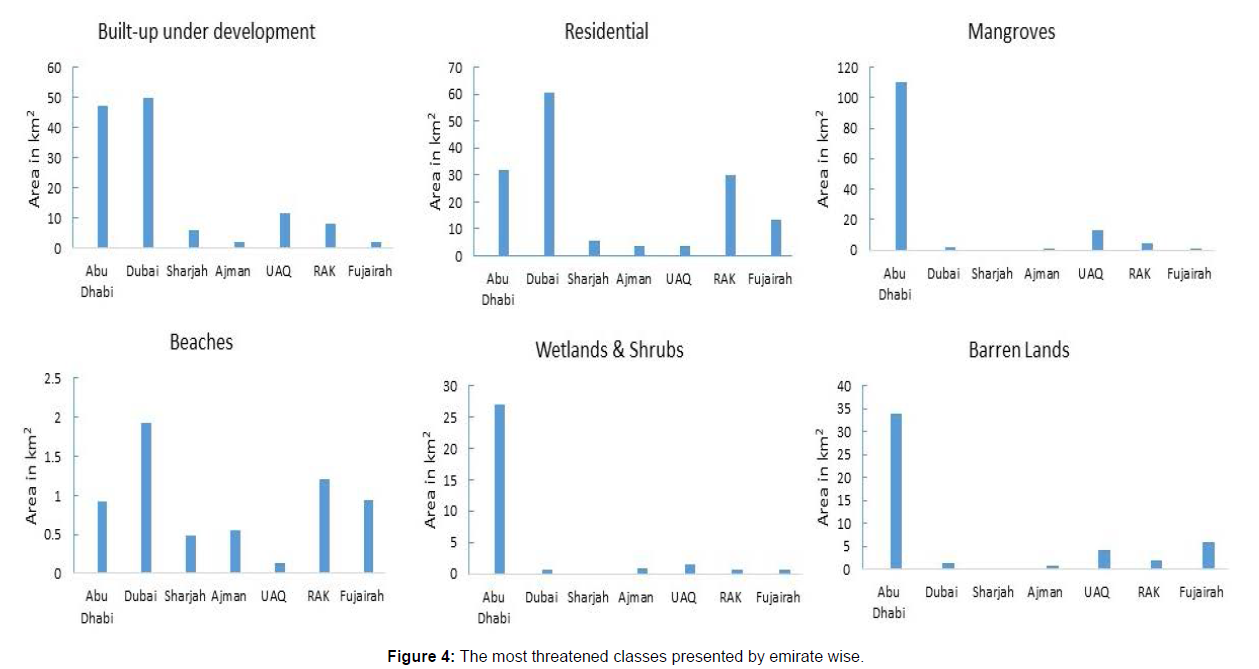
Then the total area at risk of sea level rise was calculated by land use/land cover classes adopted according to NRSC classification. The analysis showed that the classes most susceptible to rising sea levels are Built-up residential areas, mangrove areas and Built-up areas under development. More attention should be paid to urban areas (residential 24.3%, under-development, 27.15% and industrial, 4.7%) due to the concentration of population, since the effects of sea level rise are not limited to the land covering 303.73 km2 itself, but also to the people living there. Also one of the potential impacts of sea level rise is on the mangrove plantations as they have ecological, social and economic values. Mangroves comprises a total area of 131.69 km2 in the study area which corresponds to 21.5% respectively. For all other different land use/land cover classes which are vulnerable due to sea level rise is represented in the (Figure 4).
Discussion
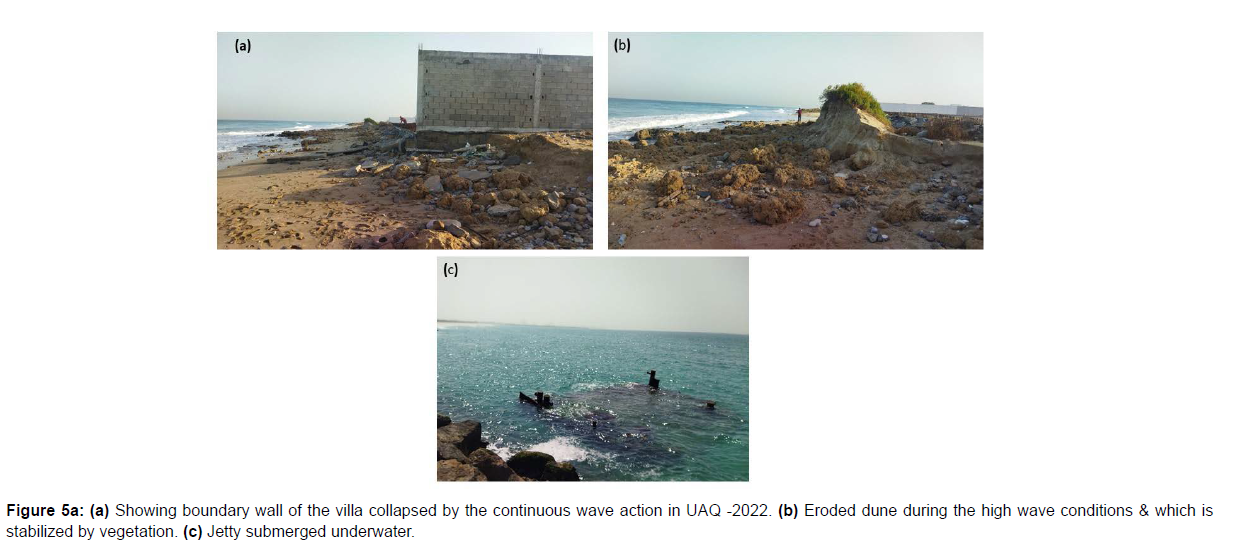
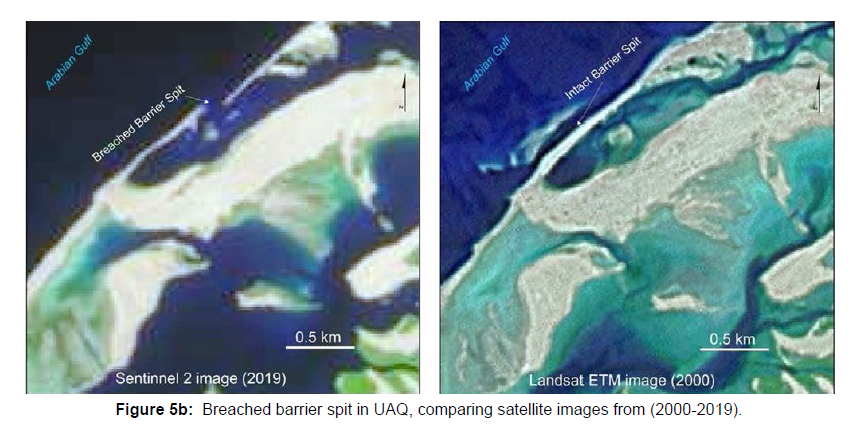
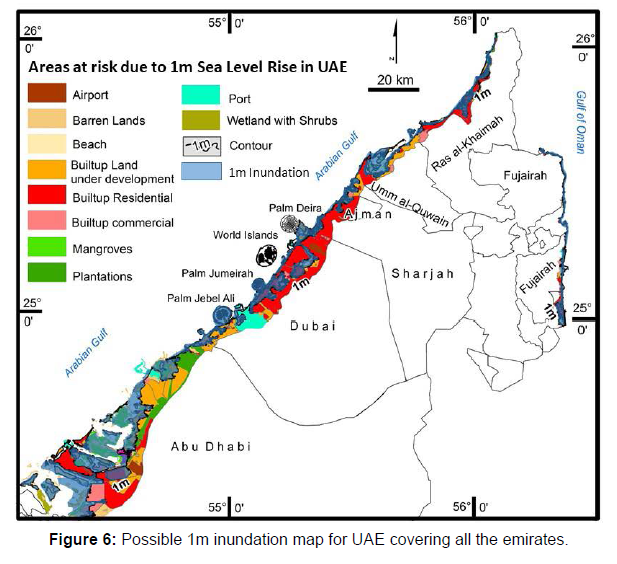
The study has confirmed that UAE is particularly vulnerable to sea level rise. Land use/land cover of the study area of UAE consists of mainly beaches, barren lands, built-up-residential, built-up-under development, built-up-commercial/industrial, mangroves, wetlands and shrubs, plantations and port facilities (Figure 2-LULC map for the entire UAE). The areas covered within the approximate 5 m and 1 m elevation along the study area of UAE coast is about 2003 km2 and 571 km2 (Table 1). Analyzing the context of some specific land use/ land cover classes like built-up residential areas and built-up under development both together occupies an area of 274.83 km2. During the field visits along the coast, alarmingly noticed already there is a conspicuous erosion observed along the Umm Al Quwain coast (Figure 5a), a compound wall of a villa got undermined due to the wave and tide energies impinge upon the wall and got collapsed. Also dunes stabilized by the vegetation got eroded which are substantiated with field evidences (Figure 5a): a jetty completely submerged in water & also noticed a conspicuous spit got eroded when compared between two satellite images from 2000 and 2019 (Figure 5b): In the Coastal Vulnerability Index analysis, calculated by [51] clearly stated that Umm al Quwain and its adjoining coastal areas are under high to very high-risk category. Aldogoml D [61] also specified that this area is experiencing widespread erosion. As mentioned earlier there is a huge construction boom in this region as clearly evident from LULC map especially in the northern part of Abu Dhabi where the built-up under development area is 47km2, south of Dubai 50 km2, north of UAQ 11.5km2. In this situation, there should be a long term defense strategy to overcome and protect the areas against the sea level rise. In this regard, there is an 1m sea-level rise inundation map prepared in order to illustrate the areas along the different emirates under threat (Figure 6), which will help the coastal managers to know the other areas which might affected in the near future. The significant other areas are essentially built-up area under development, residential areas and the mangroves. About (26%) of the area is under built-up residential areas which are fringing along the coast which makes it more prone as this area would be directly affected to the impending sea level rise in the future.
| Sea-level rise scenarios | |||
| S.No | Emirates | Area under (1m ) in Km2 | Area under (5m ) in Km2 |
|---|---|---|---|
| 1 | Abu Dhabi | 291.9 | 1007.2 |
| 2 | Dubai | 141.5 | 527.33 |
| 3 | Sharjah | 16.01 | 78.52 |
| 4 | Ajman | 10.4 | 48.2 |
| 5 | Umm Al-Quwain | 33.8 | 162.42 |
| 6 | Ras Al-Khaimah | 48.3 | 108.36 |
| 7 | Fujairah | 30.4 | 71.24 |
Table1: Emirates wise areas under 1m and 5m contours.
Conclusion
The Study revealed that the impending sea-level rise would seriously impair the built-up residential and under development activities along with mangroves in Abu Dhabi, Dubai, UAQ and RAK which are considered as the major cities where the maximum people dwell in. The land use/land cover map prepared using Sentinnel-2 images from 2019, coupled with elevation data generated from SRTM DEM’s indicated that built-up residential is the major land use activity in the region followed by built-up under development and mangroves vegetation which will bore the brunt when the sea levels rise. If the sea level rises by about 1.0 m as the predictions based on recent models indicated, an area of about 571km2 will be effected directly or indirectly, including 291.9km2 in Abu Dhabi, 141.5 in Dubai, 33.8 km2 in UAQ and 48.3km2 in RAK. Further, the major portion of the area 148.69km2 falls under Built-up residential, and 126.14km2 in built-up under development and 131.69km2 covers with mangroves. All this presents a huge challenge for all the emirates of UAE and requires to have a long-term policy of preventing or mitigating the effects of rising sea levels. Knowledge about how the structure of the land use/land cover will change after sea level rises is therefore necessary to be able to plan more judiciously. The next step in the research will be the analysis of various sea level rise scenarios as well as the time analysis of these changes. This will allow a better understanding of the processes that may take place in the UAE coastal zones in the coming decades.
Acknowledgement
This research has been supported by the National Water Center of the United Arab Emirates University. The authors would like to thank the editorial board of the journal as well as the reviewers for their professional support.
Conflicts of Interest
The authors declare no conflict of interest.
References
- World Meteorological Organization (2021). State of the Global Climate 2020. Technical report. World Meteorological Organization.
- Masson-Delmotte V, Zhai P, Roberts D, Skea J et al. (2018) Global Warming of 1.5_C. Annex I Matthews J B R (Ed.) IPCC In Press.
- IPCC (2019) Special Report on the Ocean and Cryosphere in a Changing Climate.
- Trewin B, Cazenave A, Howell S, Palmer MD et al. (2020) Headline indicators for global climate monitoring. Bull. Am Meteorol Soc 102: E20-E37.
- Hastings RA, Rutterford L A, Freer JJ, Simpson SD et al. (2020) Climate change drives poleward increases and equatorward declines in marine species. Curr Biol 30: 1572e2-1577e2
- Munasinghe M (2010) Addressing the sustainable development and climate change challenges together: applying the sustainomics framework. Procedia Social Behavl Sci 2: 6634-6640.
- Kyte R (2014) Climate Change Is a Challenge for Sustainable Development. Gaidar Forum Moscow, Russian Federation.
- Princiotta FT, Loughlin DH (2014) Global climate change: the quantifiable sustainability challenge. J Air Waste Manag Assoc 64: 979-994.
- Martens P, Mcevoy D, Chang CT (2016) Climate change: responding to a major challenge for sustainable development. Sustainability Science.
- Wigley, TM L (1983) The pre-industrial carbon dioxide level. Climate Change 5: 315-320.
- Dash SK, Hunt J C R (2007) Variability of climate change in India. Curr Sci 93: 782-788.
- Smith JB, Stephen HS, Oppenheimer M, Yohe GW, Hare W (2009) Assessing dangerous climate change through an update of the Intergovernmental Panel on Climate Change (IPCC) “Reasons for Concern”. Proceedings of the National Academy of Sciences of the United States of America 106: 4133-4137.
- Shekhar MS, Chand H, Kumar S, Srinivasan K, Ganju A (2010) Climate change studies in the western Himalaya. Ann Glaciol 51: 105-112.
- Fawzy S, Osman AI, Doran J, Rooney DW (2020) Strategies for mitigation of climate change: a review. Environ Chem Lett 18: 2069-2094.
- Ricke K, Millar R, Macmartin DG (2017) Constraints on global temperature target overshoot. Sci Rep 1-7.
- Bustreo C, Giuliani U, Maggio D, Zollino G (2019) How fusion power can contribute to a fully decarbonized European power mix after 2050. Fusion Eng Des 146: 2189-2193.
- Goglio P, Williams AG, Balta-Ozkan N, Harris NR, Williamson P, et al. (2020) Advances and challenges of life cycle assessment (LCA) of greenhouse gas removal technologies to fight climate changes. J Clean Prod 244: 118896.
- Khalidy R, Santos RM (2021) The fate of atmospheric carbon sequestrated through weathering in mine tailings. Miner Eng 163: 106767.
- Lezaun J (2021) Hugging the shore: tackling marine carbon dioxide removal as a local governance problem. Front Climate 3: 684063.
- Lockley A, Mi Z, Coffman DM (2019) Geoengineering and the blockchain: coordinating carbon dioxide removal and solar radiation management to tackle future emissions. Front Eng Manag 6: 38-51.
- Osman AI, Hefny M, Maksoud MA, Elgarahy AM, Rooney DW (2020) Recent advances in carbon capture storage and utilisation technologies: a review. Environ Chem Lett 19: 797-849.
- Allen JC, Komar PD (2006) Climate controls on US west coast erosion processes. J Coast Res 22: 511-529.
- Meehl GA, Washington WM, Collins WD, Arblaster JM, Hu A, et al. (2005) How much more global warming and sea level rise? Science 307: 1769-1772.
- Pardaens AK, Gregory JM, Lowe JA (2011) A model study of factors influencing projected changes in regional sea level over the twenty-first century. J Clim Dyn 36: 9-10.
- Rignot E, Velicogna I, Van den Broeke M, Monaghan A, Lenaerts J (2011) Acceleration of the contribution of the Greenland and Antarctic ice sheets to sea level rise. Geophys Res Lett 38: 5.
- McKay NP, Overpeck JT, Otto-Bliesner BL (2011) The Role of Ocean Thermal Expansion in Last Interglacial Sea Level Rise. Geophysical Research Letters. American Geophysical Union (AGU) 38:14.
- Lindsey R (2020) Climate Change: Global Sea Level. Climate Gov.
- Bamber J L, Oppenheimer M, Kopp RE, Aspinall WP, Cooke RM (2019) Ice sheet contributions to future sea-level rise from structured expert judgment. Proc Natl Acad Sci USA 116: 11195-11200.
- Pirazzoli PA (1996) Sea-level changes: the last 20,000 years. Chichester: Wiley.
- Pye K, Blott SJ (2006) Coastal processes and morphological change in the Dunwich-Sizewell area, Suffolk, UK. 2006. J Coast Res 22: 453-473.
- Pendleton EA, Thieler ER, Williams SJ (2004) Coastal vulnerability assessment of Cape Hettaras National Seashore (CAHA) to sea level rise. USGS Open File Report 2004-1064.
- Wu S, Yarnal B, Fisher A (2002) Vulnerability of coastal communities to sea-level rise: a case study of cape May county, New Jersey, USA. Climate Research 22: 255-270.
- Unnikrishnan A S, Rup Kumar K, Fernandes SE, Michael G S, Patwardhan SK et.al (2006) Sea level changes along the Indian coast: observations and projections. Current Science 90: 362-368.
- Healy A, Malhotra N (2009) Myopic voters and natural disaster policy. Am Pol Sci Rev 103: 387-406.
- Granados JAT, Ionides EL, Carpintero O (2012) Climate change and the world economy: short-run determinants of atmospheric CO2. Environ Sci Pol 21: 50-62.
- Murray J, King D (2012) Climate policy: oil's tipping point has passed. Nature 481: 433.
- Beni AN, Marriner N, Sharifi A, Azizpour J, Kabiri K, et al. (2021) Climate change: A driver of future conflicts in the Persian Gulf Region.
- United-Nations (2015) Paris Agreement. In: https://unfccc.int/process-and-meetings/the-paris-agreement/the-paris-agreement.
- Zenghelis D (2006) Stern Review: the Economics of Climate Change. HM Treasury, London, England.
- Van Lavieren H, Burt J, Cavalcante G, Marquis E, Benedetti L, et al. (2011) Managing the Growing Impacts of Development on Fragile Coastal and Marine Ecosystems: Lessons from the Gulf. UNU-INWEH, Hamilton, ON, Canada.
- Burt JA, Paparella F, Al-Mansoori N, Al-Mansoori A, Al-Jailani H (2019) Causes and consequences of the 2017 coral bleaching event in the southern Persian/Arabian Gulf. Coral Reefs 38: 567-589.
- UNDP (2010) Mapping of Climate Change Threats and Human Development Impacts in the Arab Region. United Nations Development Programme, Regional Bureau for Arab States, Arab Human Development Report, UNDP.
- Alothman A, Bos M, Fernandes R, Ayhan M (2014) Sea level rise in the north-western part of the Arabian Gulf. J Geodyn 81: 105-110
- Mathers E L, Woodworth PL (2004) A study of departures from the inverse-barometer response of sea level to air-pressure forcing at a period of 5 days. QJR Meteorol Soc 130: 725-738
- Gurevich AE, Chilingarian GV (1993) Subsidence over producing oil and gas fields, and gas leakage to the surface. J Pet Sci Eng 9: 239-250.
- Heidarzadeh M, Pirooz MD, Zaker NH, Yalciner AC (2009) Preliminary estimation of the tsunami hazards associated with the Makran subduction zone at the north western Indian Ocean. Nat Hazards 48: 229-243.
- El-Hussain I, Omira R, Al-Habsi Z, Baptista MA, Deif A, et al. (2018) Probabilistic and deterministic estimates of near-field tsunami hazards in northeast Oman. Geosci Lett 5: 1-13.
- Lambeck K (1996) Shoreline reconstructions for the Persian Gulf since the last glacial maximum. Earth Planet. Sci Lett 142: 43-57.
- Melville-Rea H, Eayrs C, Anwahi N, Burt JA, Holland D, et al. (2021) A Roadmap for Policy-Relevant Sea-Level Rise Research in the United Arab Emirates. Front Mar Sci 8: 670089-670090.
- Al Ahbabi F (2017) Department of Urban Planning and Municipalities. Plan Maritime: Abu Dhabi coastal and marine framework plan. Abu Dhabi p. 238.
- Subraelu P, Yagoub MM, Sefelnasr A, Nageswara Rao K, Allamsatti RS, et al. (2021) Sea-level Rise and Coastal Vulnerability: A Preliminary Assessment of UAE Coast through Remote Sensing and GIS. J Coast Zone Manag. 24: 477-480.
- Katsman CA, Sterl A, Beersma JJ (2011) Exploring high-end scenarios for local sea level rise to develop flood protection strategies for a low-lying delta the Netherlands as an example. Climatic Change 109: 617- 645.
- Sterr H (2008) Assessment of Vulnerability and Adaptation to Sea-Level Rise for the Coastal Zone of Germany. J Coast Res 242: 380-393.
- Thomsen Dana C, Smith, Timothy F, Keys, Noni (2012) "Adaptation or Manipulation? Unpacking Climate Change Response Strategies". Ecol Soc 17: 3-5.
- Prandi P, Meyssignac B, Ablain M, Spada G, Ribes A, et al. (2021) Local sea level trends, accelerations and uncertainties over 19930-2019. Sci Data 8: 1-12.
- Hereher ME (2020) Assessment of climate change Impacts on sea surface temperatures and sea level rise. The Arabian Gulf Climate 8: 50-52.
- Strohecker K (2008) World sea levels to rise 1.5 m by 2100: scientists, a New scientist news service and Reuters publication.106: 21527-21532.
- Milne GA, Gehrels WR, Hughes CW, Tamisiea ME (2009) Identifying the causes of sea-level rise. Nat Geosci 2: 471-478.
- Vermeer M, Rahmstorf S (2009) Global sea level linked to global temperature. Proceedings of the National Academy of Sciences of the United States of America. 106: 21527-21532.
- Rahmstorf S (2010)A new view on sea level rise. Nature Reports Climate Change. 8: 50-52.
- Aldogoml D, Albesher S, Al Mansoori S, Nazzal T (2020). Assessing Coastal Land Dynamics along UAE shoreline using GIS and Remote Sensing Techniques. IOP Conf. Series: Earth and Environmental Science 540: 012031.
Indexed at, Google Scholar, CrossRef
Indexed at, Google Scholar, CrossRef
Indexed at, Google Scholar, CrossRef
Indexed at, Google Scholar, CrossRef
Indexed at, Google Scholar, CrossRef
Indexed at, Google Scholar, CrossRef
Indexed at, Google Scholar, CrossRef
Indexed at, Google Scholar, CrossRef
Indexed at, Google Scholar, Crossref
Indexed at, Google Scholar, Crossref
Indexed at, Google Scholar, Crossref
Indexed at, Google Scholar, Crossref
Indexed at, Google Scholar, Crossref
Indexed at, Google Scholar, Crossref
Indexed at, Google Scholar, Crossref
Indexed at, Google Scholar, CrossRef
Indexed at, Google Scholar, CrossRef
Indexed at, Google Scholar, CrossRef
Indexed at, Google Scholar, CrossRef
Indexed at, Google Scholar, CrossRef
Indexed at, Google Scholar, CrossRef
Indexed at, Google Scholar, CrossRef
Indexed at, Google Scholar, CrossRef
Indexed at, Google Scholar, CrossRef
Indexed at, Google Scholar, Crossref
Indexed at, Google Scholar, Crossref
Indexed at, Google Scholar, Crossref
Indexed at, Google Scholar, Crossref
Indexed at, Google Scholar, Crossref
Indexed at, Google Scholar, Crossref
Citation: Subraelu P, Sefelnasr A, Yagoub MM, Sherif M, Ebraheem AA, et al. (2022) Global Warming Climate Change and Sea Level Rise: Impact on Land Use Land Cover Features along UAE coast through Remote Sensing and GIS. J Ecosys Ecograph 12: 329. DOI: 10.4172/2157-7625.1000329
Copyright: © 2022 Subraelu P. This is an open-access article distributed under the terms of the Creative Commons Attribution License, which permits unrestricted use, distribution, and reproduction in any medium, provided the original author and source are credited.
Select your language of interest to view the total content in your interested language
Share This Article
Recommended Journals
Open Access Journals
Article Tools
Article Usage
- Total views: 11000
- [From(publication date): 0-2022 - Dec 06, 2025]
- Breakdown by view type
- HTML page views: 10292
- PDF downloads: 708

