GIS Based Mapping and Spatial Distribution of Tuberculosis in Punjab, Pakistan
Received: 22-Mar-2021 / Accepted Date: 05-Apr-2021 / Published Date: 12-Apr-2021
Abstract
Tuberculosis (TB) is known as a disease that prone to spatial clustering. Recent development has seen a sharp rise in the number of epidemiologic studies employing Geographical Information System (GIS), particularly in identifying TB clusters and evidences of etiologic factors. This retrospective population-based study was conducted to analyze spatial patterns of TB incidence in Punjab province, Pakistan. TB notification data from 2007 to 2017 collected from TB clinics throughout the province was used along with population data to reveal a descriptive epidemiology of TB incidences. Spatial distribution of the disease was observed by using ArcGis. Machine learning algorithms like ANN, SVM and Maximum Entropy were used to predict the presence of the disease with a prediction power of 82%, 75% and 78% respectively. This study has also shown a heterogeneous pattern of the disease over the years with some consistently high risked areas. This study can be very helpful for policy makers to refine their policies for successful eradication of the disease.
Keywords: Tuberculosis; Geographical information system; Spatial distribution; Ecological niche modelling
Introduction
Tuberculosis (TB) is and infectious disease caused by the bacillus Mycobacterium tuberculosis (M.tb), infects over two billion people worldwide (90% latent infection; 10% active-disease). Approximately, 10 million new active-TB patients emerge from those latently infected every year, 1.7 million die, making TB the largest infectious disease killer [1]. TB spreads through air droplets when people who are infected with TB expel bacteria into the air by coughing or sneezing. It typically affects the lungs (pulmonary TB) but can also affect other body organs (extra pulmonary TB).
Pakistan with a population of 212 million ranks 5th among 22 high burden countries, accounting 61% of the burden with an incident rate of 265/100,000 population [1]. TB is a multifactorial disease with spatial and temporal distribution. Despite significant advances in TB control, for example, in diagnosis and treatment and innovative research, TB continues to be a major public health problem in most low-and middleincome countries like Pakistan [2]. Therefore it is very important to diagnose the disease at an early stage with new and cost-effective methods. It is also very important to monitor the disease pattern based on spatial and temporal distribution. Geographic Information System (GIS) can be used to develop effective medical control and care for TB and set up control programs for other infectious diseases [3]. Examination of spatial data analysis method can assist in visualizing spatial distribution, identifying spatial outliers, investigating patterns of spatial distribution (clusters or hot spots) via Geographic Information System (GIS) [4].
M.tb transmission often occurs within a household or small community because prolonged duration of contact is typically required for infection to occur, creating the potential for localised clusters to develop [5]. However, geospatial TB clusters are not always due to ongoing person-to-person transmission but may also result from reactivation of latent infection in a group of people with shared risk factors [6]. Spatial analysis and identification of areas with high TB rates (clusters), followed by characterization of the drivers of the dynamics in these clusters, have been promoted for targeted TB control and intensified use of existing TB control tools [7].
TB differs from other infectious diseases in several ways that are likely to influence apparent spatial clustering. For example, its long latency and prolonged infectious period allow for significant population mobility between serial cases [8]. Thus, M.tb infection acquired in a given location may progress to TB disease in an entirely different region, such that clustering of cases may not necessarily indicate intense transmission but could rather reflect aggregation of population groups at higher risk of disease, such as migrants [8]. Similarly, M.tb infection acquired from workplaces and other congregate settings can be wrongly attributed to residential exposure, as only an individual’s residence information is typically recorded on TB surveillance documents in many settings [9,10].
Identifying heterogeneity in the spatial distribution of TB cases and characterizing its drivers can help to inform targeted public health responses, making it an attractive approach [11]. However, there are practical challenges in appropriate interpretation of spatial clusters of TB. Of particular importance is that the observed spatial pattern of TB may be affected by factors other than genuine TB transmission or reactivation, including the type and resolution of data and the spatial analysis methods used [12,13]. For instance, use of incidence data versus notification data could give considerably different spatial pattern , as the latter misses a large number of TB cases and could be skewed towards areas with better access to health care in high-burden settings [14]. Thus, spatial analysis using notification data alone in such settings could result in misleading conclusions .Similarly, the type of model used and the spatial unit of data analysis are important determinants of the patterns identified and their associations [4,15]. That is, different spatial resolutions could lead to markedly different results for the same dataset regardless of the true extent of spatial correlation [16-19].
In almost all sciences geographical epidemiology of infectious disease, ecological niche models have been extensively used for spatial and temporal disease vector analysis. To our knowledge, no such study has been performed in Pakistan which is a TB endemic country. Therefore, present study was conducted in Punjab, largest province of Pakistan to find out statistically suspected areas and hotspot regions by utilizing Ecological niche models by using GIS, ANN and other computational models.
Materials and Methods
Study area
This study was performed on the Province Punjab, which is the largest province of Pakistan by population, located at 31.1704° North latitude and 72.7097° East longitude. It occupies an area of 205,344 square kilometers (Km2) and an estimated population of 110,012,442 (2017 census) which is more than 50% of Pakistan [20]. Population growth rate of Punjab is 2.13% with a population density of 536 per Km2. Punjab is largely industrial and agricultural land comprising of 36 districts with 30% urban and 70% rural population [21].
TB case data
Data of confirmed TB cases examined and registered as smearpositive pulmonary TB case from all the districts of Punjab was taken from National Reference Lab (NRL). The data is available online on NRL databases [22]. Throughout the Punjab, more than 300 TB diagnostic facilities have been established by the National TB control Program (NTP) since 2006. Data for newly diagnosed and registered cases of Pulmonary TB (PTB) with AFB (Acid Fast Bacilli) smearpositive microscopy results was taken from all the TB centers of 36 districts of Punjab from 2007-2017.
Geographic localization data
For data analysis, locality with the TB cases was used as a geographic unit. The georeferenced came from the latitude-longitude projection system obtained from google maps.
Climatic data
Bioclimatic variables of the study area with current were downloaded from an online Worldclim website They also predict the climatic change globally with a reasonable degree of confidence from present to future till 2050 with a resolution of 1 km. With the use of past data and trends of climatic change, bioclimatic layers were prepared for temperature and precipitation [23,24]. This helped to understand the difference between present and the forthcoming patterns of weather and hence the spatial and temporal distribution of TB. From BioClim data (1-19 layers) layer, data for layer 8.9, 18 and 19 were not used in analysis because they created odd spatial artefacts [25].
Data processing and modelling
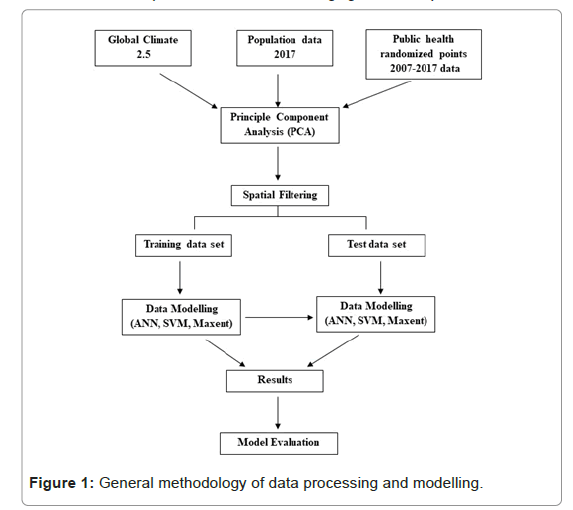
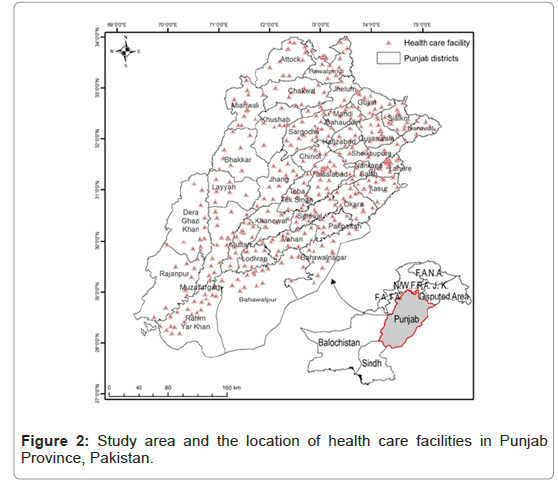
General methodology of data processing and modelling is in Figure 1. All public health facility centers were georeferenced to exact their location in the Punjab province (Figure 2). Data for all the cases notified to TB health care centers from 2007-2017 was visualized by plotting graphs and making maps. There are 483 TB centers in 36 districts of Punjab, it was assumed that location of patients is from 15 km vicinity of these health care centers. So, random points were generated within the 15 km boundary of each center depending upon the number of cases reported. We cleaned the occurrences by overlapping the random points with the population Layer for 2017 (downloaded from the Land Scan and settlement maps. Spatial rarefication of data was done by using SDM toolbox. Finally, 901 points were generated that were used for mapping [26]. This data set was randomly divided into two data sets of equal sizes. One was used as a test data set and the other was the training dataset. Based on population consensus 2017 of Pakistan, the incident rate of TB for 2017 was also calculated for all the districts [27]. Principal Component Analysis (PCA) was performed on climatic variables using all the dimensions of 15 layers. PCA 1, 2, 3,4,5,6 were used for final analysis. Furthermore, masks were created on GIS (Ascii) to uniform the layers of bioclimatic and population layer [28].
Computational modeling
Computation system open Modeller version 1.1.0 was used for niche modeling of disease modelling. This software has various algorithms which are used under different conditions for different analysis as per requirement. In the present study bioclim, ANN and SVM, GARP, Environmental distance and Maximum Entropy models were used. All output ASCII files were transformed into raster grid by using ArcGIS 10.1. In evaluating the outputs of a study, the most essential period is the official numerical test to create if models are able to expect autonomous subsets of existence data better than random prospects (Reference). Partial Receiver-Operating Characteristic (ROC) method was utilized for accuracy assessment as they mitigate at least some of the faults of classical ROC methods (Reference). Acceptable omission error threshold of E=10 was used in 1000 replicate of 50% bootstrap resampling to create if the ROC and AUC (area under the curve) ratio was beyond 1.0. Use of online tools at assisted in computing partial ROCs which were assessed by direct count of the proportion of replicate analyses with an AUC ratio ≤ 1.0. The model was cut down by means of outputs and enhanced comparability between exhibiting methods with the application of omission error-scaled threshold. If there exists an error within the existing data, it helps in lessening the percentage involved by the suitable omission rate E, hence, we discovered T100-E for E=5% and E=10%, such that higher acceptable omission rate values recognize smaller areas and higher assurance in its aptness.
Results
Data visualization and spatial distribution
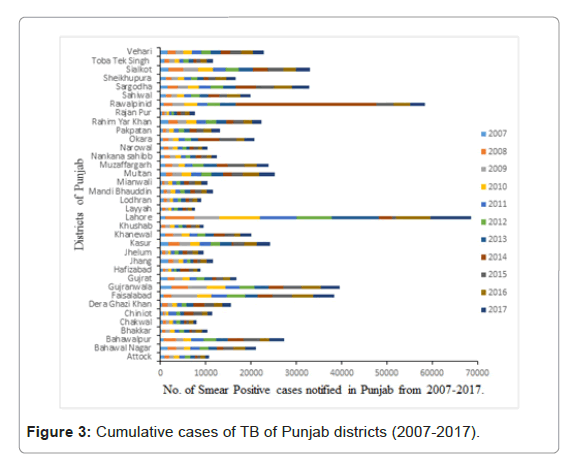
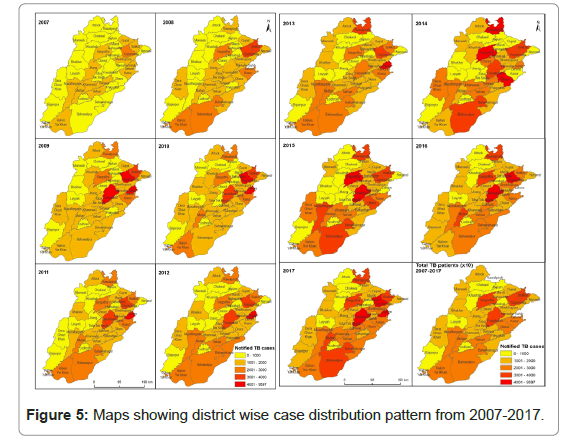
From 2007-2017, all notified AFB smear-positive cases diagnosed by 484 TB diagnostic centers from 36 districts of Punjab were included in the present analysis (Figure 2). Throughout the study period, a total of 718878 new smear positive pulmonary TB cases were registered and notified to NTP. Maximum number of 92166 cases in 2014 and the minimum number of 35616 cases in 2007 were reported (Figure 3). Unfortunately, throughout the study period an increasing trend of TB notification has been observed which was at its peak in 2014 (Figure 4). Maps were constructed to observe the spatial distribution of the disease (Figure 5). Cumulatively, five districts of Punjab were identified as hotspots with the highest rate of TB case notification were Faisalabad, Gujranwala, Lahore, Rawalpindi and Sargodha throughout the study.
Model performance
Initial analysis of correlations using Pearson’s correlation between environmental variables four pairs of variables were found that had Pearson’s correlation coefficients >0.9 as shown in (Table 1). Four variables that were removed from the analysis were mean temperature of wettest quarter, mean temperature of driest quarter, precipitation of warmest quarter and precipitation of coldest quarter. Rest of fifteen environmental variables were used for analysis with TB patient’s data. Correlation with r=0.9 were considered as significant. Three bioclimatic variables i.e mean temperature of coldest quarter, precipitation of wettest quarter and precipitation of driest quarter were considered significant variables that impact TB distribution or abundance. Globally, TB has shown a seasonal pattern which is correlated with temperature. Precipitation was found to be least significant or important.
| Bio | 1 | 2 | 3 | 4 | 5 | 6 | 7 | 10 | 11 | 12 | 13 | 14 | 15 | 16 | 17 |
|---|---|---|---|---|---|---|---|---|---|---|---|---|---|---|---|
| 1 | |||||||||||||||
| 2 | 0.7 | ||||||||||||||
| 3 | 0.7 | 0.8 | |||||||||||||
| 4 | 0.3 | 0.5 | 0.1 | ||||||||||||
| 5 | 0.9 | 0.7 | 0.5 | 0.5 | |||||||||||
| 6 | 0.7 | 0.1 | 0.3 | 0.2 | 0.5 | ||||||||||
| 7 | 0.5 | 0.8 | 0.4 | 0.8 | 0.7 | -0.1 | |||||||||
| 10 | 0.7 | 1.0 | 0.8 | 0.5 | 0.7 | 0.1 | 0.8 | ||||||||
| 11 | 0.9 | 0.6 | 0.7 | 0.1 | 0.8 | 0.8 | 0.3 | 0.6 | |||||||
| 12 | -0.7 | -0.8 | -0.7 | -0.5 | -0.6 | 0.1 | -0.6 | -0.8 | -0.6 | ||||||
| 13 | -0.6 | -0.8 | -0.6 | -0.5 | -0.6 | 0 | -0.7 | -0.8 | -0.5 | 0.9 | |||||
| 14 | -0.7 | -0.7 | -0.6 | -0.4 | -0.6 | -0.3 | -0.5 | -0.7 | -0.6 | 0.8 | 0.8 | ||||
| 15 | 0.4 | 0.1 | 0.5 | -0.4 | 0.2 | 0.6 | -0.2 | 0.1 | 0.5 | -0.1 | 0 | -0.3 | |||
| 16 | -0.6 | -0.8 | -0.6 | -0.6 | -0.6 | 0 | -0.7 | -0.8 | -0.5 | 0.9 | 0.9 | 0.8 | 0 | ||
| 17 | -0.7 | -0.7 | -0.7 | -0.4 | -0.6 | -0.3 | -0.5 | -0.7 | -0.6 | 0.9 | 0.8 | 0.9 | -0.3 | 0.8 |
Note: Correlations above r = 0.9 are shown in blue highlights. Variables 8,9,18 and 19 were removed due to known spatial artifacts.<
Table 1: Pearson’s product moment correlation matrix of Environmental (bioclimatic) variables.
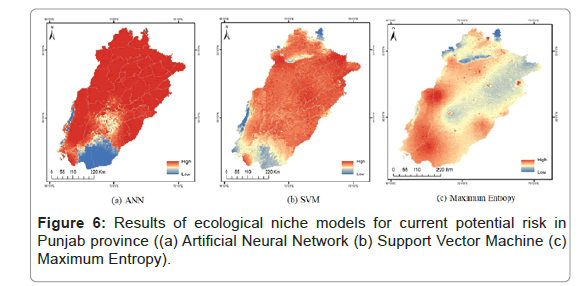
In modelling, to predict the hotspot regions of TB, the data has 999 records from which 50% was used a training set and 50% was used as a test set. The accuracy of the tests and power to identify the hot spot regions with high abundance of TB was found to be 82.60%, 75.43% and 78.81% for ANN, SVM and Maximum Entropy (Table 2 and Figure 6).
| Current Predicted Area (% age) | |||
|---|---|---|---|
| Algorithm model | Low risk | Medium risk | High risk |
| ANN | 10.11 | 7.24 | 82.65 |
| SVM | 8.47 | 16.1 | 75.43 |
| Maximum entropy | 0.18 | 21.01 | 78.81 |
Table 2: Prediction power of different algorithms.
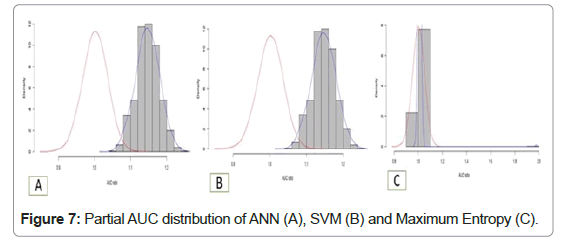
Statistics for partial AUC were calculated at 0.05 and 0.5 p-value and it showed that ANN and SVM have a higher significant probability of prediction the diseased area as compared to maximum entropy. The partial AUC curve among the density and AUC ratio are shown in figures for all final models. SVM and ANN models output shows the normal distribution which is always greater than 1.00, however maximum entropy results have P-value 0.225 (Table 3 and Figure 7).
| Algorithm model | AUC | Partial AUC | P-Value | |
|---|---|---|---|---|
| 0.05 | 0.05 | 0.5 | ||
| ANN | 1.0974 | 0.5476 | 0.499 | 0.005 |
| SVM | 1.1471 | 0.5728 | 0.4993 | 0.005 |
| Maximum entropy | 1.0101 | 0.5041 | 0.499 | 0.225 |
The p-value for the difference between means (AUC random and AUC partial) is 0***
Table 3: AUC and Partial AUC values of ANN, SVM and Maximum Entropy models.
Discussion
TB is a complex and multifactorial disease and is still a public health challenge inspire of the recent advances [29]. Like many epidemiological researches, this study has used GIS for spatial distribution pattern of the disease across the most populated province (Punjab) of Pakistan (Figure 5). Many studies have been performed using modern neural networks in various fields like image and speech recognition and processing of natural language [30-33]. Deep neural networks have been extensively used in personalized clinical care, diabetic retinotherapy, classification of skin cancers and cluster analysis of TB and drug resistance patterns [31,34]. Many researchers have performed studies on spatial and temporal distribution of TB using GIS, ANN and other computational analysis methods. Spatial auto-correlation statistics have been commonly used to understand the spatial distribution and spatial structure of TB incidence as well as they allow for examining spatial dependence or auto-correlation in spatial data [35-37]. Such kind of data mining approaches can be very helpful in timely diagnosis of TB and initiation of TB therapy. According to the WHO global TB report, 2019, India, Indonesia, China, Philippines, and Pakistan are the top five countries with 56% TB prevalence of the world [1]. Timely TB diagnosis to reduce transmission and initiation of treatment to improve the outcomes for TB patients is essential, especially in high burden countries [38,39]. Classification and clustering algorithms are working efficiently with good precision in the prediction of the tuberculosis diagnosis. Presence of MTB and patient’s data may support such model up to large extents. When handling high-dimensional classification problems, different modeling approaches may be used. Earlier works have applied multivariate logistic regression, classification trees and ANN for predicting TB and MDRTB [40-45].
In the present study various computational algorithms like ANN, SVM and Maximum Entropy were used for the prediction of hotspots of TB areas with a sensitivity of 82.60%, 75.43% and 78.81%. ANN has the higher capability for prediction with 3.11 AUC value at 0.5 p value (Figures 5 and 6). The utilization of such tools in observing and predicting the disease pattern is very helpful for observing the spatial and geographic patterns of the disease. We have observed a heterogeneous spatial pattern of TB in the present study. In some districts of the province it has been observed that clusters of TB are persistent on annual basis based on the spatial analysis of the study area. In addition, the result also offers useful information on the existing epidemiological situation of tuberculosis. These findings related to the identification of hot spots of TB can be beneficial to the public health policy makers of that province in intensifying their remedial procedures of the identified areas and also in planning future strategies for an effectively control the spread of the disease.
Conclusion and Limitations
Our study had several limitations. Firstly, the data was extracted from official surveillance database where there is the possibility that many cases might not be reported in some regions. The routine diagnostic and notification systems might miss the cases as majority of the time in rural areas persons infected with TB generally do not look for early treatment and may stay untreated or are treated by private practitioners who do not convey TB cases to local or state authorities supervising the data. Secondly, this study was conducted on the source that used the ecological design. It focused on the grouped population instead of individuals since precise locations of the individual patients were not known, which is considered a limiting factor in accurately predating the spatial distribution. The confound collaboration among the numerous factors at the individual level was intrinsically compromised in this study. However, this type of analysis can provide useful information about easily obtainable data from other consistent happenings like announcements and census. Thirdly, in almost all districts majority of the sites that reporting data to NTP were from government hospital like DHQ, THQ or BHUs. The data form public sector hospital and private labs was insufficient which can change the disease pattern. Fourthly, actual data of climatic variables like temperature, precipitation, humidity, aerosols, and pollutants is very important to include in the studies that involve disease mapping.
Acknowledgement
The authors would also like to National TB Control Program and Bioclime for availability of the data bases.
Conflict of Interest
None
Ethical Approval
No ethical approval was required as all the data analyzed were publicly available.
Author Contribution Statement
Concepftuaflfizaftfion: AK, MNC, MAS, UA, SS
MeftThodoflogy: AK, MNC, MAS, UA, RA, SS
Software: AK, UA
Validation: AK, MNC, MAS, UA
Formal analysis: AK, MNC, UA, RA
Invesftfigaftfion: AK, MAS, UA, RA, SS
Resources: AK, MNC
Dafta Curaftfion: AK, MAS, UA,RA, SS
Wrfiftfing orfigfinafl draft: AK, UA, SS
Visualization: AK, MNC, UA
Supervision: AK, MNC
Project Administration: AK, MNC
References
- WHO (2019) Global TB report.
- Arsang-Jang S, Mansourian M, Amani F , Jafari-Koshki T (2017) Epidemiologic trend of smear-positive, smear-negative, extra pulmonary and relapse of tuberculosis in iran (2001-2015); a repeated cross-sectional study. J Res Health Sci 17: e00380.
- Mollalo A, Mao L, Rashidi P, Glass GE (2019) A GIS-based artificial neural network model for spatial distribution of tuberculosis across the continental united states. Int J Environ Res Public Health 16: 157.
- Shaweno D, Karmakar M, Alene KAA, Ragonnet R, Clements ACA, et al. (2018) Methods used in the spatial analysis of tuberculosis epidemiology: A systematic review. BMC Med 16: 193.
- Verma A, Schwartzman K, Behr MA , Zwerling A , Allard R, et al. Accuracy of prospective space-time surveillance in detecting tuberculosis transmission. Spat Spatiotemporal Epidemiol 8:54.
- Haase I, Olson S, Behr MA, Wanyeki I, Thibert L, et al. (2017) Use of geographic and genotyping tools to characterise tuberculosis transmission in Montreal. Int J Tuberc Lung Dis 11: 632-638.
- Yates TA, Khan PY, Knight GM, Taylor JG, McHugh TD, et al. (2016) The transmission of Mycobacterium tuberculosis in high burden settings. Lancet Infect Dis 16: 227-238.
- McBryde ES, Denholm JTD (2012) Risk of active tuberculosis in immigrants: Effects of age, region of origin and time since arrival in a low-exposure setting. Med J Aust 197: 458-461.
- Middelkoop K, Bekker L, Morrow C, Lee N, Wood R (2014) Decreasing household contribution to TB transmission with age: A retrospective geographic analysis of young people in a South African township. BMC Infect Dis 23: 221.
- Middelkoop K, Bekker L, Morrow C, Zwane E, Wood R (2009) Childhood tuberculosis infection and disease: A spatial and temporal transmission analysis in a South African township. S Afr Med J 99: 738-743.
- Keshavjee S, Dowdy D, Swaminathan S (2015) Stopping the body count: A comprehensive approach to move towards zero tuberculosis deaths. Lancet 386: e46-7.
- Sasson C, Michael T, Cudnik MT, Nassel A, Semple H, et al. Identifying high-risk geographic areas for cardiac arrest using three methods for cluster analysis. Acad Emerg Med 19: 139-146.
- Shaweno D, Trauer JM, Denholm JT, McBryde ES (2017) A novel Bayesian geospatial method for estimating tuberculosis incidence reveals many missed TB cases in Ethiopia. BMC Infect Dis 17: 662.
- Dangisso MH, Datiko DG, Lindtjørn B (2015) Accessibility to tuberculosis control services and tuberculosis programme performance in southern Ethiopia. Glob Health Action 20: 29443.
- Clements ACA, Lwambo NJS, Blair L, Nyandindi U, Kaatano G, et al. Bayesian spatial analysis and disease mapping: Tools to enhance planning and implementation of a schistosomiasis control programme in Tanzania.Trop Med Int Health 11: 490-503.
- Wubuli A, Xue F, Jiang D, Yao X, Upur H, et al. (2015) Socio-demographic predictors and distribution of pulmonary tuberculosis (tb) in xinjiang, china: a spatial analysis. Clinical Trial 10: e0144010.
- Manley D, Flowerdew, Steel D (2006) Scales, levels and processes: Studying spatial patterns of British census variables. Comput Environ Urban Sys 30: 143-160.
- Pfeiffer D (2008) Spatial analysis in epidemiology.
- Kirby RS, Delmelle E, Eberth JM (2017) Advances in spatial epidemiology and geographic information systems. Ann Epidemiol 27: 1-9.
- Machine C. (2017) Census of Pakistan.
- Population profile. (2017).
- Lab NR. (2019).
- Fick SE, Hijmans RJ (2017) World Clim 2: New 1‐km spatial resolution climate surfaces for global land areas. Int J Climatol 37: 4302-4315.
- Harris I, Jones PD, Osborn TJ, Lister DH (2013) Updated high‐resolution grids of monthly climatic observations: The cru ts3.10 dataset. Int J Climatol 34: 623-642.
- Alkishe AA, Peterson AT, Samy AM (2017) Climate change influences on the potential geographic distribution of the disease vector tick Ixodes ricinus. PLOS One 12: e0189092.
- Brown JL, Bennett JR, French CM (2017) SDM toolbox 2.0: The next generation python-based GIS toolkit for landscape genetic,biogeographic and species distribution model analyses. Peer J. 5:e4095.
- Statistics PBO (2017) Population Census.
- Godefroid M, Cruaud A, Rossi J, Rasplus J (2015) Assessing the risk of invasion by tephritid fruit flies: intraspecific divergence matters. PLoS One 10: e0135209.
- Dheda K, Gumbo T, Maartens G, Dooley KE, McNerney R, et al. (2017) The epidemiology, pathogenesis, transmission, diagnosis, and management of multidrug-resistant,extensively drug-resistant, and incurable tuberculosis. Lancet Respir Med S2: 30079.
- Krizhevsky A,Sutskever I, Hinton GE (2012) Image net classification with deep
- convolutional neural networks. ACM Dig Lib 1: 1097-1105.
- Esteva A, Kuprel B, Novoa RA, Justin Ko, Swetter SM, et al. (2017) Dermatologist-level classification of skin cancer with deep neural networks. Nature 542: 115-118.
- Khan MT, Kaushik AC, Linxiang Ji, Malik SI, Ali S, et al. (2019) Artificial neural networks for prediction of tuberculosis disease. Front Microbiol 10: 395.
- Sadr H, Pedram MM, Teshnehlab M (2019) A robust sentiment analysis method based onsequential combination of convolutional and recursive neural networks. neural process. Lett 50: pages2745–2761.
- Gulshan V, Peng L, Coram M, Stumpe MC, Derek Wu, et al. (2016) Development and validation of a deep learning algorithm for detection of diabetic retinopathy in retinalfundus photographs. JAMA 16: 2402-2410.
- Mao Q, Zeng C, Zheng D, Yang Y (2019) Analysis on spatial-temporal distributioncharacteristics of smear positive pulmonary tuberculosis in China, 2004-2015. Int J Infect Dis 80: S36-S44.
- Lima SVMA, Santos ADD, Duque AM, Goes MADO, Peixoto MVDS, et al. (2019) Spatial and temporal analysis of tuberculosis in an area of social inequality in Northeast Brazil. BMC Public Health 19: 873.
- Amsalu E, Liu M, Li Q, Wang X, Tao L, et al. (2019) Spatial-temporal analysis of tuberculosis in the geriatric population of China: An analysis based on the Bayesian conditional autoregressive model. Arch Gerontol Geriatr 83:328-337.
- Yagui M, Perales MT, Asencios L, Vergara L, Suarez C, et al. (2006) Timely diagnosis of MDR-TB under program conditions: Is rapid drug susceptibility testing sufficient? Multicenter Study 10: 838-843.
- Dheda K, Gumbo T, Maartens G, Dooley KE, McNerney R, et al. (2017) The epidemiology, pathogenesis, transmission, diagnosis, and management of multidrug-resistant, extensivelydrug-resistant, and incurable tuberculosis. Lancet Respir Med 15: S2213-S2600.
- Wisnivesky JP, Bonomi M, Henschke C, Iannuzzi M, McGinn T (2005) Radiation therapyfor the treatment of unresected stage I-II non-small cell lung cancer. Chest 128: 1461-1467.
- Solari A, Laurà M, Salsano E, Radice D, Pareyson D (2007) Reliability of clinical outcomemeasures in Charcot-Marie-Tooth disease. Neuromuscul Disord 18: 19-26.
- Mello FCDQ, Bastos LGDV, Soares SLM, Rezende VMC, Conde MB, et al. Predicting smear negative pulmonary tuberculosis with classification trees and logistic regression: A cross-sectional study. BMC Public Health 23: 6-43.
- Aguiar FS, Almeida LL, Netto AR, Kritski AL, Mello FC, et al. (2012) Classification and regression tree (CART) model to predict pulmonary tuberculosis in hospitalized patients. BMC Pulm Med 12: 12-40.
- Dande P, Samant P (2018) Acquaintance to artificial neural networks and use of artificial intelligence as a diagnostic tool for tuberculosis: A review. Tuberculosis (Edinb) 108: 1-9.
Citation: Khaliq A, Chaudhry MN, Sajid MA, Ashraf U, Aleem R, et al. (2021) GIS Based Mapping and Spatial Distribution of Tuberculosis in Punjab, Pakistan. Epidemiol Sci 11: 402.
Copyright: © 2021 Khaliq A, et al. This is an open-access article distributed under the terms of the Creative Commons Attribution License, which permits unrestricted use, distribution, and reproduction in any medium, provided the original author and source are credited.
Share This Article
Recommended Journals
Open Access Journals
Article Usage
- Total views: 2687
- [From(publication date): 0-2021 - Mar 31, 2025]
- Breakdown by view type
- HTML page views: 1919
- PDF downloads: 768

