Research Article Open Access
Geophysical Characterization of Salinity Ingress in Surka Mining Lease Area of Gujarat, India
Manoj Khandelwal1*, AP Singh2 and PK Gupta2
1Faculty of Science and Technology, Federation University Australia, Ballarat, Australia
2Central Institute of Mining and Fuel Research (Council of Scientific and Industrial Research), Dhanbad, India
- *Corresponding Author:
- Manoj Khandelwal
Faculty of Science and Technology
Federation University Australia, Ballarat
Victoria 3353, Australia
Tel: +61 3 5327 9821
E-mail: m.khandelwal@federation.edu.au
Received Date: September 01, 2015; Accepted Date: September 10, 2015; Published Date: September 17, 2015
Citation: Singh AP, Gupta PK, Khandelwal M (2015) Geophysical Characterization of Salinity Ingress in Surka Mining Lease Area of Gujarat, India. J Powder Metall Min 4:136.doi:10.4172/2168-9806.1000136
Copyright: © 2015 Singh AP, et al. This is an open-access article distributed under the terms of the Creative Commons Attribution License, which permits unrestricted use, distribution, and reproduction in any medium, provided the original author and source are credited.
Visit for more related articles at Journal of Powder Metallurgy & Mining
Abstract
Salinity ingress is refers to the process of salt water invading areas which previously contained only fresh water. The coastal areas of Gujarat especially the villages lying within 20-25 km from the seashore are suffering from the problem of salinity ingress. Most of the rivulets that drain this region are seasonal at best and their water does not last beyond monsoons. The other aquifers like ponds, which get water from these rivers, also dry up as early as October. The present paper deals with the salinity ingress of Surka mining lease area of Gujarat.
Keywords
Salinity ingress; Surka mining; Lithology; Geomorphology; Hydrogeology
Introduction
Salinity ingress is one of the most vulnerable environmental risks of coastal area on account of several significant factors. It depends upon local lithology, geomorphology, hydrogeology and landuse from terrain characteristics point of view. Economically, the coastal area has attraction for human settlement and related activities pertaining to industry and agriculture. The main environmental risk is the unbearable limit of chloride content as quality parameter among the existing ground water body and its continuous threat for newer horizon. The term salinity ingress may be defined as the objectionable entrance of undesired high content of chloride among the available ground water.
The researchers address this problem by advanced technology like mathematical, computer based methodology whose success strongly depends upon the quality extension and reliability of input data. In this sense, geophysical characterization plays an effective role for integrating the lithological and hydro-geological data, planning of drilling and ultimately gathering the information necessary for the modeling purpose. The geophysical characterization may be defined as the understanding and documenting the distinguished property of strata and its associated features like ground water by reliable instruments indirectly.
Our paper’s aim is to illustrate the fundamentals aspects of geophysical survey techniques particularly earth resistivity survey for delineating the salinity ingress with integration of Remote Sensing and GIS as advanced technology for evaluation of coastal terrain. It is well known for coastal area that soil salination can be caused by various factors including sea water infiltration through porous layer, saline water penetration at the surface through natural and artificial channel, tidal fluctuation and long period sea shore migration. Several applications of geophysical technique and characterization are available in the literature. The most of the geophysical papers deals with salt water intrusion with use of single method. The combination of two or more methods for authentication of geophysical characterization if found seldom which is attempted in the present paper.
The findings presented in this article illustrate the effectiveness, reliability and usefulness of electrical resistivity survey as low cost geophysical technique. It confirms the well known concept that may lead to reduction in number of drillings and getting more complete and realistic interpretation of hydro-geology of the area in more integrated manner.
Geographic Location and Mining Geology
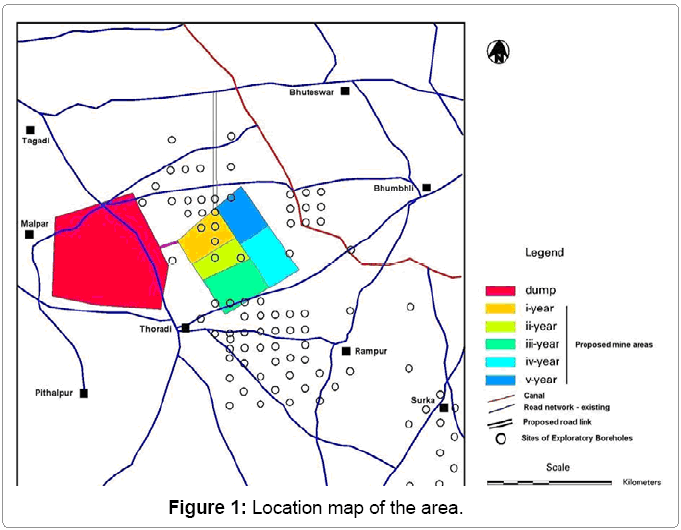
The area under study belongs to southern portion of Bhavnagar and Ghogha Taluka (Peninsular Gujarat). It is surrounded by Vallabhpur Taluka in North West, Sihor Taluka in West, Taleja Taluka in south of Bhavnagar District and gulf of Cambay in east direction respectively. It is approachable by air, road and rail link upto Bhavnagar from any part of India. It is about 30 km in south of Bhavnagar city and is approachable through Somnath highway upto Budhel. The area under study belongs to district Bhavnagar having prestigious prince state during pre independence days and has land as well as sea portion as a part of gulf of Cambay in existing administrative setup. The area under study has prominent villages namely Thordi, Tagdi, Rampar, Bhumbhali and Bhuteshwar and their accessibility along with other prominent localities has been illustrated in Figure 1. It has roughly geographic coordinates N 21° 40’ to 21° 45’ latitude and E 72° 10’ to 72° 15’ longitude.
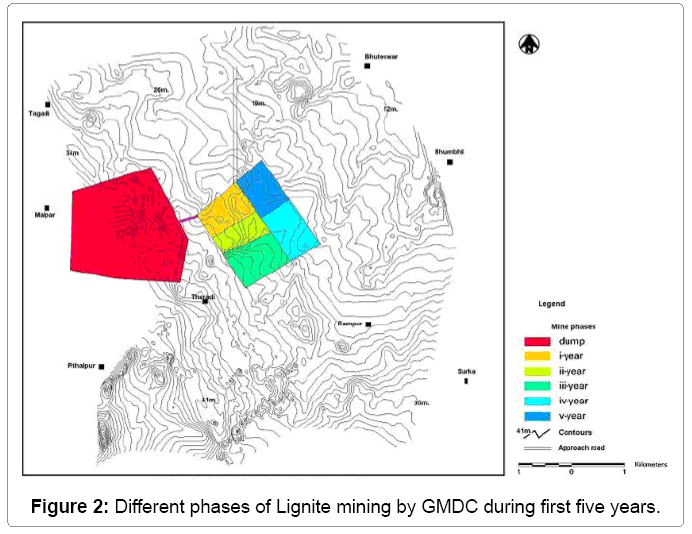
The Bhavnagar and Ghogha both are located along coastal track of Gulf of Cambay. The draft is about 4 m with irregular sea bottom, presently in Gulf of Cambay. It does not allow sailing of big Cargo at old harbor. Ghogha has ship-breaking industry in analogy to Alang located about 100 km in south. Ghogha is having less than 40 km distance as Bird’s eye view over crossing Gulf of Cambay to Bharuch - coastal city of main land Gujarat. The sedimentation rate in Gulf of Cambay is responsible for abandonment of old port like Bhavnagar, Surat, Bharuch and Ghogha as well as less magnitude of available draft. The area under study has the occurrence of ignite deposit into two categories. The first category belongs to shallow depth occurrence in the range of 40-50 m and confined to western portion around Tagdi. The second category belongs to moderate to deeper depth occurrence in the range of 60-90 m and confined to eastern portion around Rampar. The total mining lease area as per original plan for Surka project was 4690 hectare or 47 sqkm. Later on it has been divided into two blocks as mining block ‘A’ and mining block ‘B’ in the west and east direction of Surka respectively. The mining block ‘B’ has poor grade of Lignite including 30 % of area as barren zone. It has 26 sq km geographic area and allotted to ONGC for feasibility of degasification of lignite. The mining block ‘A’ has higher grade of lignite and covers 22 sqkm geographic area. It is considered for opencast mining due to prevailing geological condition. The strike length of lignite is 18-20 km with average width of 7-8 km. The average thickness of lignite deposit is 6 m with gentle dipping to east direction. The reserve of lignite deposit for mining block ‘A’ is estimated as 50 MT out of which, 30 MT belongs to middle grade. The opencast mining method has been planned as per prevailing regional geological setup. The different phases of mining for first five years along with topographic contour have been illustrated in Figure 2.
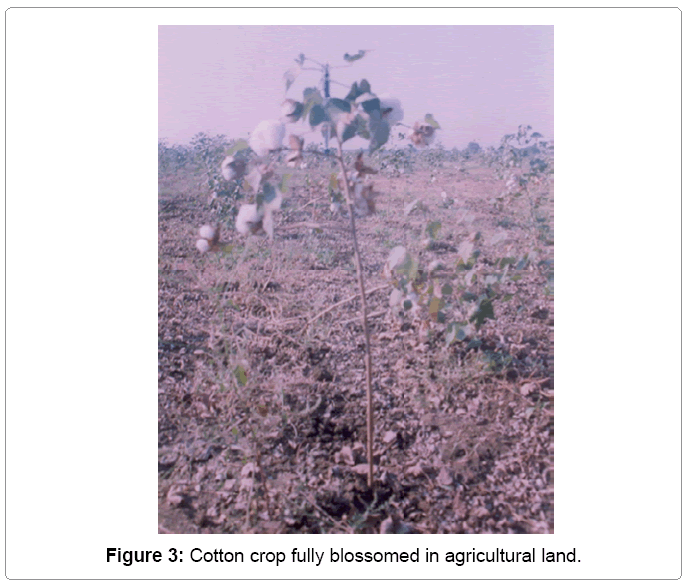
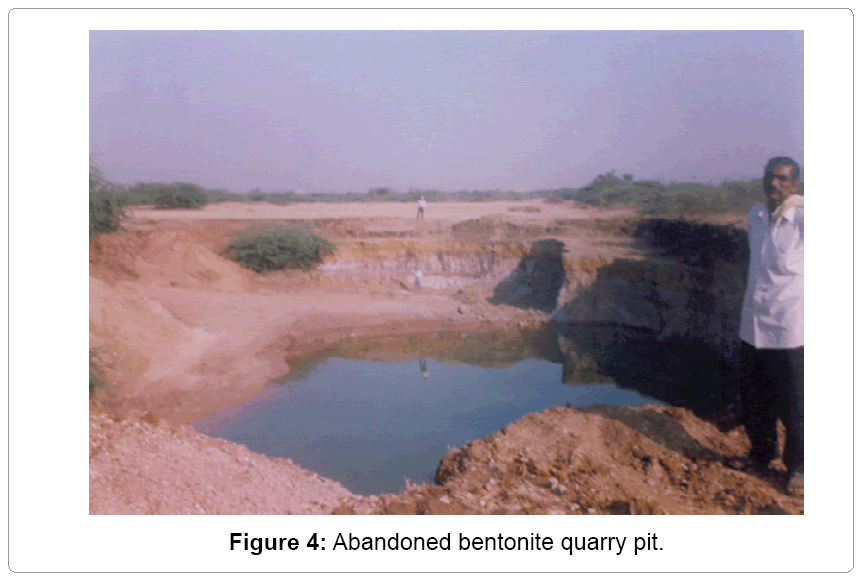
The area is used to be associated with mining industry and agriculture practices. The mining industry besides lignite by GMDC includes the bentonite quarry upto the occurrence of ground water table. The quarried material is exported to Middle East oil industry – as applied in drilling mud through small country boat followed with shipping in deep sea. The agriculture practices have trend for commercial crop growing. The black cotton soil favors the production of cotton and ground nut as cash crop as shown in Figure 3. The abandoned bentonite quarry pits are one of the major sources of salinity ingress in and around area as illustrated in Figure 4. The eatable salt production along tidal fluctuation portion has another, commercial input for local businessmen.
Evolved Methodology
The evolved methodology incorporates the integrated approach pertaining to geo-hydrology, hydrogeology, geophysics and Remote Sensing.
Hydro-geological study
It involves the following aspects
• Ground water inventory for pre-monsoon, monsoon and post-monsoon season.
• Ground water fluctuation during pre-monsoon and postmonsoon season.
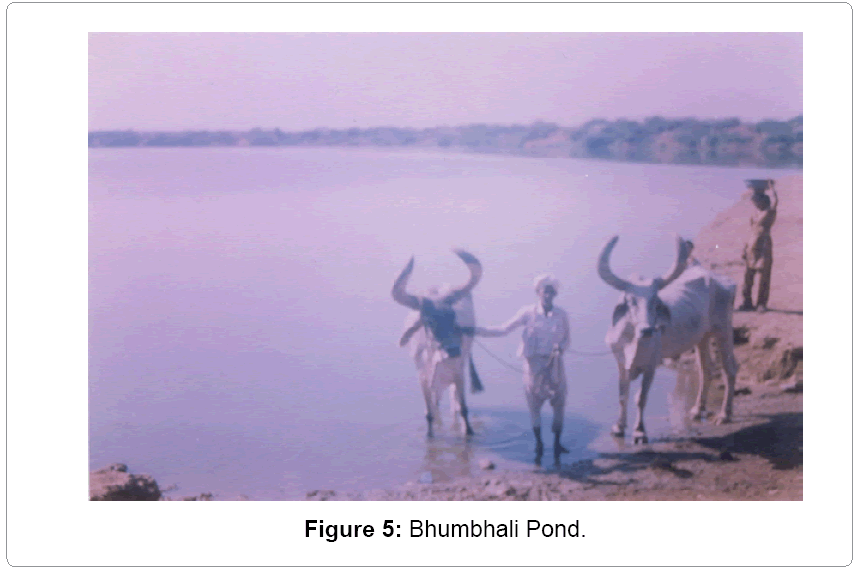
• Aquifer disposition: The unconfined aquifer is associated with black cotton soil and recharged by local streams, village ponds and limited natural recharge as evidenced through Figure 5. It is tapped by dug wells mostly for agriculture purpose.
The confined aquifer is having two layers, separated by variegated clay formation. It has been inferred through Electrical resistivity Survey followed with correlation of available bore hole logs drilled by GMDC. The upper layer has admixture of sweet and saline water and is characterized by deep bore holes in the agriculture land. The lower layer has occasional sweet water, possess due to the presence of fractured basalt. It has been identified at depth of more than 90 m at two places in the North of Bhuteshwar and south of Thordi by geophysical survey.
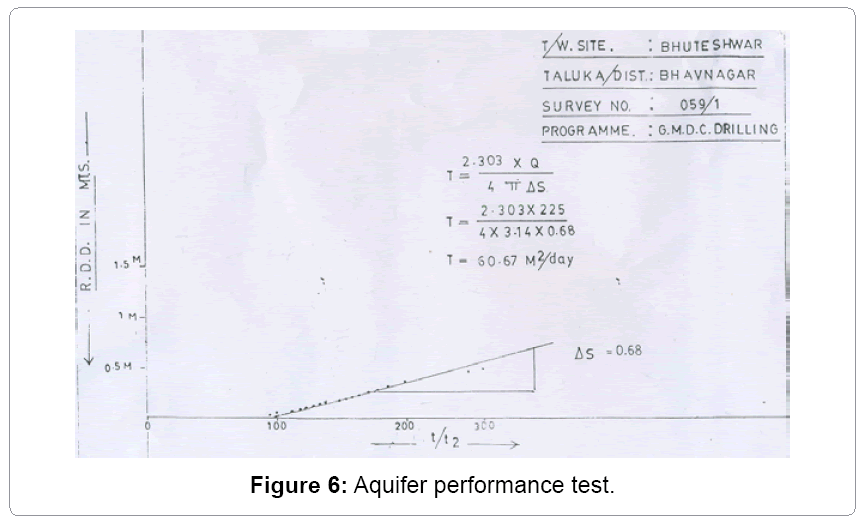
The pumping test has been carried out at Bhunthar village during last week of May month 2005. The discharge of constant nature for 220 minutes has been observed as 225 litres per minute with draw down of 1.92 m. The transmissisivity has been calculated using Thies formulae as 60.67 m2 per day and field permeability as 1.41 m per day respectively. The details of aquifer performance test are illustrated as Figure 6.
Geophysical characterization
It has been introduced at Ghpgha - Kodiyar, naya Ratanpur and Juna ratanpur during 70th decade for sea water intrusion study through electrical resistivity survey [1]. The area under study incorporates the electrical resistivity survey at 70 sites for area at close grid intervals of 500 m approximately. Electrical resistivity survey has been carried out for precise delineation (depth wise) of saline and fresh water interface along coastal area. The following villages have been covered during three seasons (pre monsoon, monsoon and post monsoon) Bhumbhali, Bhuteshwar, Ghogha, Malpar, Rampar, Tagdi and Thordi. The terrain is dominated by recharge characteristics as surface ponds along the boundary of each village. The concealed lignite occurrence has been correlated with bore hole log interpretation in the depth range of 80- 90 m. The resistivity data has been interpreted using standard master curve [2]. It has precisely inferred the following information pertaining to salinity ingress.
• Higher saline zone pertaining to salt affected area near shore.
• Modern to saline zone along the vicinity of surface streams.
• Low saline zone along agriculture zone. It is followed with fresh to sweet water pocket in the depth range 90-110 m depth.
The conventional DC resistivity meter has found certain difficulties in clay rich/fractured formation. The offset Wenner profiling has been found useful in such areas for precise delineation of interface in between fresh and saline water. The clay rich formation seems to be of higher saline in nature due to probable association with marine intrusion [3].
Remote sensing study
It has been made through digital analysis of IRSP 6 LISS IV Resourcesat data 1 (3rd, March 2004) data belongs to path 202, row 96 along with spatial resolution of 5.8 m. The study involves pre-processing of raw data towards geometric correction. The digitization of data has been carried out along with auxiliary data collected through field investigation. The interpretation of data has been carried out with the help of GIS and different classification schemes like Supervised, Band ratio and edge enhancement contrast stretching and filtering using ERDAS software. Remote Sensing is the best and most popular tool to detect shore line changes due to synoptic and repetitive data coverage, high resolution, multi-spectral data base and its cost effectiveness in comparison to conventional techniques [4].
Ground water quality
It has been chemically evaluated during aquifer pumping test at Bhuteshwar site. The water sample has been taken at two times at interval of 45 minutes and 120 minutes from the start of pumping as random selection. The both water samples have shown the result as summarized in Table 1.
| Bhavnagar | Name of the project | ||||||||
| Village | Taluka | TD (mis) DD | S.W.L. (mts) PWL | Well No | EC μmhos/cm | pH | TDS (ppm) | Ca(ppm) | Mg(ppm) |
| Bhuteshwar | Bhavnagar | 1.35 | 15.47 | 45 Minutes | 27000 | 6.8 | 15330 | 650 | 945 |
| Bhuteshwar | Bhavnagar | 1.55 | 15.47 | 120 Minutes | 27000 | 6.8 | 15340 | 625 | 945 |
| Acquite Pumping test GMDC deposit work | Lab Letter No. | 13/2005 | |||||||||||||
|---|---|---|---|---|---|---|---|---|---|---|---|---|---|---|---|
| Village | Na(ppm) | CO3(ppm) | HCO3(ppm) | SO4(ppm) | Cl(ppm) | SAR | SSP | RSC | KSR | PSI | Cl ……….. CO3 + HCO3 | Hardness | P-Alk | T-Alk | |
| Ca | Total | ||||||||||||||
| CaCO3 mg/l | CaCO3 mg/l | ||||||||||||||
| Bhuteshwar | 3651 | 0 | 305 | 1380 | 8400 | 21.29 | 58.8 | Nil | 1.43 | 25.35 | 47.25 | 1625 | 5563 | 0 | 250 |
| Bhuteshwar | 3651 | 0 | 305 | 1380 | 8400 | 21.57 | 59.26 | NIl | 1.45 | 40.38 | 47.25 | 1563 | 5500 | 0 | 250 |
Table 1: Ground water quality parameter at Bhuteshwar.
Hydrology
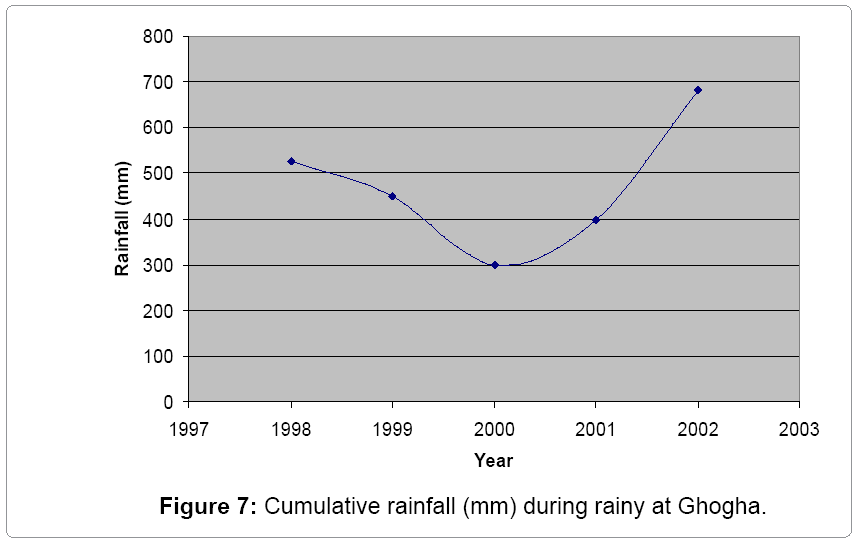
Hydrologically, the area has poor natural recharge on account of available annual rainfall 700-800 mm. It has been analyzed on the basis of rainfall data collection for the period 1997-2003 and illustrated as Figure 7. It is further deteriorated by high evaporation rate of 3 cm annually. This condition helps in excessive degree of salinity ingress.
The coastal area has high wind velocity, which contains air borne salt. The air borne salt are originated from air – water interface over Bay portion and distributed on surrounding land through dry fall out. It is also one of the significant contributing factors for the occurrence of salinity ingress [5].
Results and Discussion
Lithological mapping
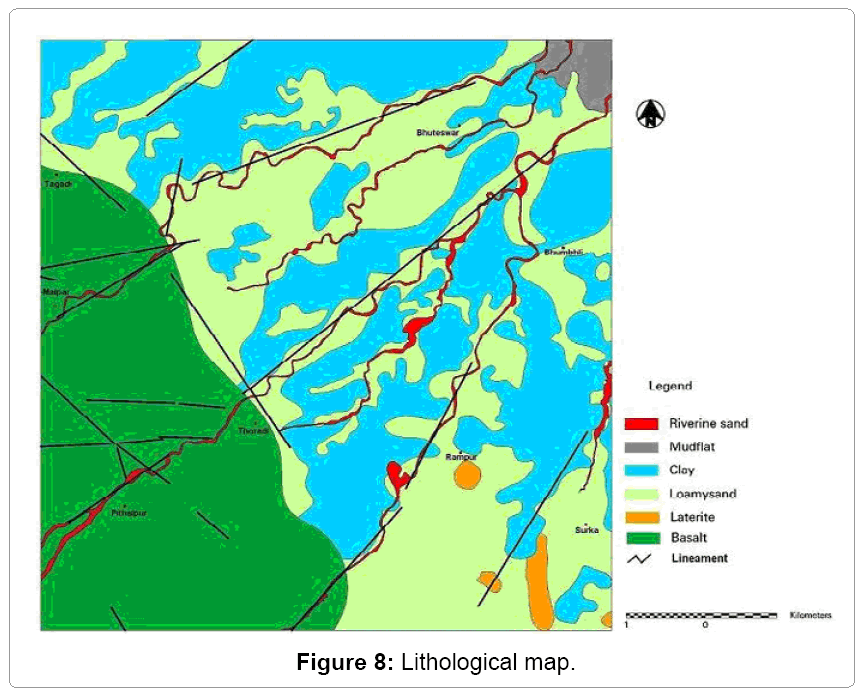
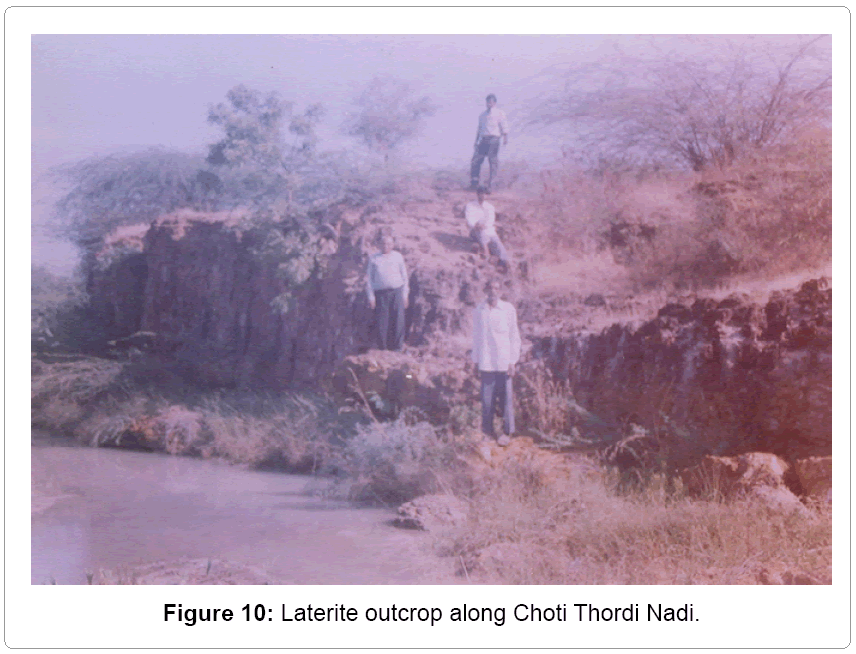
It has been carried out through interpretation of Resourcesat I data in synchronization with ground truth data. It has provided eight units namely riverine sand along with local stream, mud flat along with shore zone, clay, loami sand, laterite and basalt (Figure 8). The lateritic outcrop is illustrated as Figure 10.
Geomorphic mapping
It describes the distribution of presently available landforms as earth surface configuration. It explains the origin and development of presently available landforms with their relationship to the prevailing deformation pattern. It has been carried out through digital interpretation of Resourcesat I data. It has provided nine features namely coastal plain, Inselberg, linear ridge, deep pediment, shallow pediment, tidal flat, valley fill shallow, valley gullied and village ponds (Figure 9).
Landuse
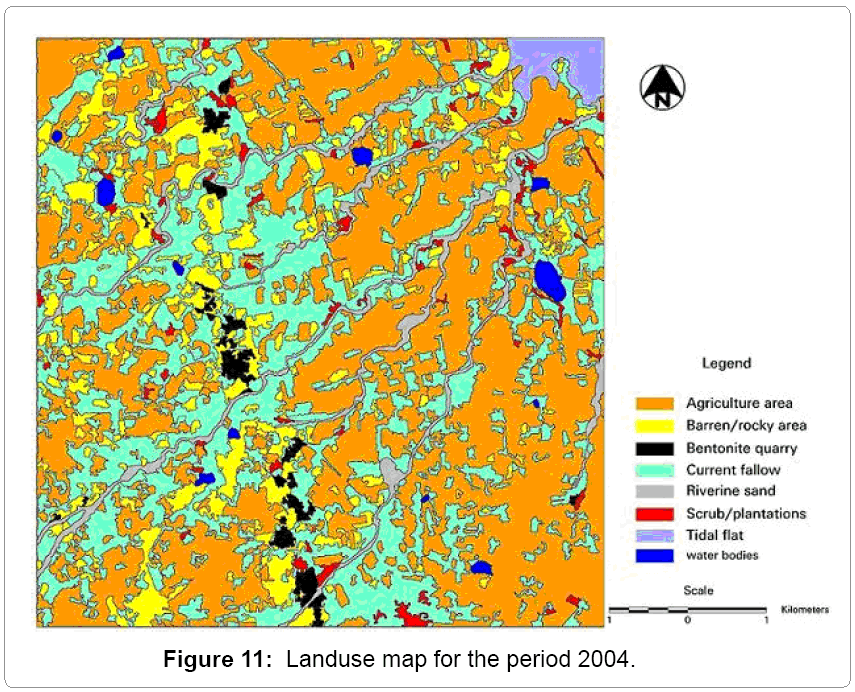
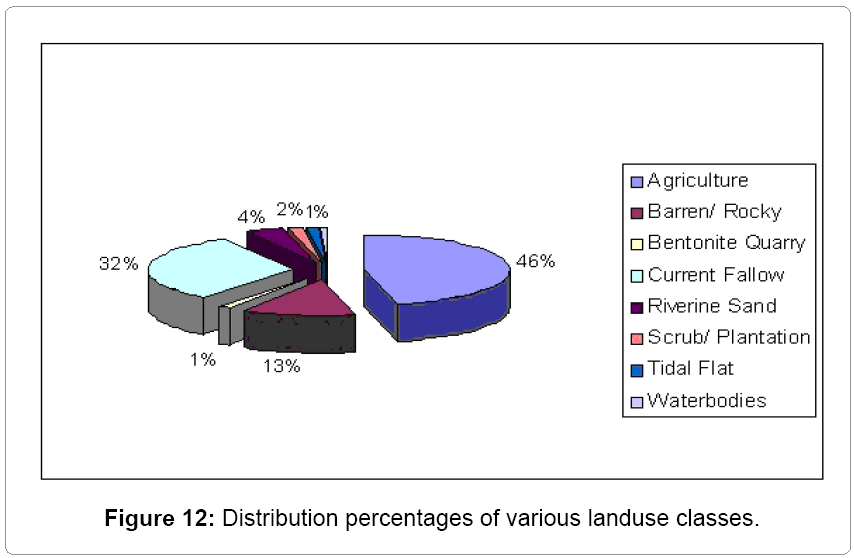
The landuse map has been prepared for the study period (March 2004). It has provided major classes namely agriculture land, barren land, bentonite quarry scrub and current fallows. These are illustrated in Figure 11. The distribution percentage of various landuse classes have been illustrated as Figure 12.
Ground water balance study
It is estimated on the basis of calculation of annual draft for dug well (unconfined aquifer) confined aquifer, net flow, available through ground water fluctuation and rainfall infiltration method [6].
Net ground water available/annual repressionable recharge (MCM/year)
Ground water fluctuation method
Gr = Ae × Wl × Syr
Ae = Area = 22 sq km
Wl = Ground water level fluctuation = 4.5 m
Syr = Regional specific yield = 0.12 for black cotton soil
Gr = 11.99 MCM/year
Rainfall Infiltration method
Annual average rainfall = 684 mm
Forty % of annual rainfall for Saurashtra area is considered as rainfall = 11.46 MCM/year
Annual Draft = 1.81 MCM/year
Dug well (Unconfined aquifer) = Number of dug wells = 60
Average draft = 2.5 m
Average rate of with drawl = 10 cu m per hour
Number of working hours = 5 hrs
Confined aquifer
Rate of pumping = 225 litre/minute as per conducted pumping test
Number of wells = 5
Annual draft = 0.15 MCM/Year
Net draft = Dug well + Confined aquifer = 1.81 + 0.15 = 1.96 MCM/ year
Ground water balance
Through ground water fluctuation method = 11.96 – 2.36 = 9.64 MCM/year
Through rainfall infiltration method = 11.46 – 2.36 = 9.14 MCM/ year
Domestic water supply
The available ground water in the area does not belong to potable category on account of varying degree of salinity ingress for most of the places. The potable water requirement of the area is mostly augmented by surface water pipe line arrangement through local Panchayat. It carries “Narmada Mai water” by Narmada canal and is pumped to village overhead tanks [7].
Role of abandoned canal
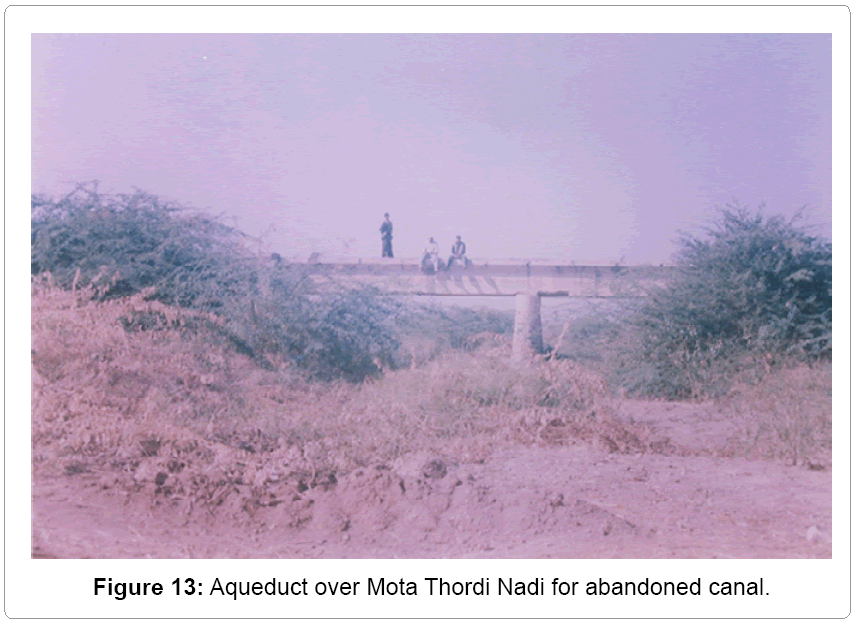
There is an abandoned left bank canal of Sheturanji reservoir in the area under study. The alignment of canal act as demarcation for salinity ingress. The alignment of canal crossing over surface stream is illustrated as Figure 13. The east of canal alignment and its extent upto Rampar Nadi has higher order of salinity ingress on account of favorable hydraulic gradient and other aspects. The west of canal alignment has admixture of sweet and saline water. The abandoned Bentonite quarry seems to be major form of salinity ingress in this portion.
Conclusion
The ground water has poor prospects on account of prevailing hydro-geological set up in the under studied area. The quality of ground water has been adversely affected by heavy withdrawal for irrigation purpose towards production of cash crop - ground nut and cotton. The overall nature of salinity ingress and its associated aspects are summarized as follows:The dug well inventory through different months of 2004 - 05 has delineated the ground water status and ground water flow direction for unconfined aquifer. The higher nature of salinity ingress has been observed along entire length of Rampar nadi. It may be associated with possible reasons like fluctuation in tidal water cycle, marine deposition due to association with old strand lines.
The horizontal extension of salinity ingress is observed from deep pediment to shallow pediment. It is due to account of over exploitation of ground water, poor natural recharge and higher evaporation rate. The fluctuated nature of salinity ingress has been observed along valley filled alluvium. It may be due to on account of old drowned shore line evidence of local uplift behind shallow pediment. The resistivity survey has revealed that Malparka stream and its fluvial cycle has potential of ground water inrush to the overlying lignite deposit on account of red boles presence during proposed opencast mining activity [8]. The geophysical characterization for the magnitude of salinity ingress reveals the following resistivity parameter:
Low salinity ingress has resistivity range 0.2-0.5 ohm m.
Fluctuation cum higher salinity ingress has range = 0.7-0.9 ohm m.
Mixed salinity ingress with sweet water has range = 1.0 – 1.5 ohm m.
The major sources of salinity ingress as observed in the area are due to the following prominent factors: Tidal reversal, Inherent salinity, Marshy land along shore zone, Existing to abandoned bentonite quarry along inland portion.
The different impacts of sanity ingress are observed in the area as:
• Conversion of irrigation well into disused well
• Conversion of agriculture land into barren land
Increasing ground water contamination towards the admixture of sweet and saline water to saline water.
The protective measures for salinity ingress are based upon restoration cum conservation of ground water aquifer and some of them are as follows:
Construction of check dams along local stream in order to have artificial recharge of ground water
Encouragement for lift irrigation at suitable sites.
Creation of fresh water barrier by “Pumping in” method.
Acknowledgement
The author is thankful to Director CIMFR, Dhanbad for providing permission to publish the paper. He is also thankful to GMDC, Ahemadabad and RRSSC IIT Kharagpur for financing as well as rendering assistance in Remote Sensing study. The views expressed in this article are of author only and in no way reflect the views of organization to which he belongs.
References
- Sharma SC, Mehta HK (1979) “Geophysical survey for demarcation of sea water intrusion in coastal area of Saurashtra between Ghogha and Kodinar”. Proc Int Sem on Development & Management of groundwater resources, UOR Roorkee pp: IV 34-IV 43.
- Orellane E, Moorely H (1966) “Master tables and Curves for vertical electrode sounding over layered structures Intercicentria Madrid, Spain.
- Gupta PK , Singh AP, Sinha A (2006) “Geo-hydrological study of Surka (N) mining lease area”. CMRI Report.
- Murali MR, Shrivastava D, Ventamoni P (2009) “Monitoring shore line involvement of Paradip, East Coast of India – using Remote Sensing”. Jr Current Science 97: 79-84.
- Todd DK (2001) “Ground water hydrology”. John Willey & Sons.
- Dey A (1998) “Hydro-geological framework and groundwater resources of Bhavnagar district” CGWB Report, Western Central Region, Ahemadabad.
- Chaulya SK (2003) “Water Resources development study for a Mining Region”. Jr of Water resource management Publ Kluwer Academic Publ 17: 297-316.
- Parasnis DS (2013) “Mining geophysics” Methods in geochemistry and geophysics. Publ Elsevier 356.
Relevant Topics
- Additive Manufacturing
- Coal Mining
- Colloid Chemistry
- Composite Materials Fabrication
- Compressive Strength
- Extractive Metallurgy
- Fracture Toughness
- Geological Materials
- Hydrometallurgy
- Industrial Engineering
- Materials Chemistry
- Materials Processing and Manufacturing
- Metal Casting Technology
- Metallic Materials
- Metallurgical Engineering
- Metallurgy
- Mineral Processing
- Nanomaterial
- Resource Extraction
- Rock Mechanics
- Surface Mining
Recommended Journals
Article Tools
Article Usage
- Total views: 13707
- [From(publication date):
December-2015 - Apr 21, 2025] - Breakdown by view type
- HTML page views : 12717
- PDF downloads : 990
