Genotypic Screening of Water Efficient Extra-Long Slender Rice Derived from MAS25 X IB370
Received: 21-Mar-2018 / Accepted Date: 22-May-2018 / Published Date: 28-May-2018 DOI: 10.4172/2375-4338.1000194
Abstract
The current research studied the F3 and F4 population derived from MAS25 (Aerobic rice) X IB370 (Lowland Basmati) for different physio-morphological traits under water limited aerobic condition in field and net house. Frequency distribution curves for various physio-morphological and root traits were parabolic and in some cases, curves were partially inclined towards the respective aerobic rice parent. Phenotypic correlation coefficient analysis showed significant positive correlation between grain yield per plant and different yield related traits yield-related attributes. These mapping population contains all types of allelic variations for BAD2A locus similar to the basmati (585 and 257 bp) or non-Basmati (585 and 355 bp) and heterozygous (585, 355 and 257 bp), respectively. Out of 604 SSR markers well distributed on 12 rice chromosomes, 70 markers showed polymorphism in parental rice genotypes and were used to assess the genetic diversity. The NTSYS-pc UPGMA tree cluster analysis and two dimensional PCA scaling showed that the populations were quite divergent and segregation among them were interspersed between the parents. Composite Interval Mapping analysis (WinQTL Cartographer 2.5) using SSR databases of various populations led to the mapping of 7 large-effect QTLs for different yield related traits in both mapping populations. Many superior genotypes having higher or comparable grain yield, and other yield related traits than the parental genotypes with intact Basmati specific BAD2A allele in homozygous and heterozygous conditions were selected for potential stable aerobic Basmati rice genotypes.
Keywords: Aerobic rice; SSR marker; QTL; Basmati; Water
Introduction
Rice (Oryza sativa L.) is a major staple food and source of energy for almost 50% of the world’s population [1]. It is a moisture loving crop which requires 3000-5000 liters of water to produce one kg of grain which is almost 2-3 times higher than any other cereal crops such as wheat and maize [2]. Minimizing the demand of water is a big challenge and several strategies are being pursued to reduce rice water requirements, such as saturated soil culture [3], alternate wetting and drying, ground cover system [4], system of rice intensification [5], aerobic rice [6] and cultivation using raised beds.
Aerobic rice system is a novel and promising alternative water management system to meet the need to produce, “more rice less water”. Aerobic rice refers to a cultivation system in which rice is direct seeded in well tilled leveled fields with uniform slope under non puddled, aerated and unsaturated soil conditions [7].
Traits controlling the water uses are complex in nature hence direct selection of these traits on the basis of phenotype is hardly of any use. Marker assisted breeding proves to be an important technique in order to dissect the presence of locus governing the trait of concern in the progeny. SSR marker remains the most used and efficient in the analysis of the progenies derived from a particular cross to detect the presence of a particular locus associated with it.
Genetic variations for adaptation of rice under aerobic conditions in upland have already been deciphered. Many SSR markers have been reported to be linked to QTL promoting aerobic adaptation in rice such as yield under drought [8,9], maximum root length [10], basal root thickness [11] and root dry weight [12,13] and for grain yield under drought [14].
Keeping all these points the current study has objectives to identify the gene(s)/QTL(s) related with less water requirement and it’s transfer in extra-long slender background in mapping population.
Material and Methods
Planting material
IB370 is lowland high-yielding aromatic rice cultivars unadapted to cultivation in aerobic conditions obtained from PAU, Ludhiana and MAS25 is a rice variety adapted to aerobic conditions obtained from UAS, Bangalore. The F3 and F4 population were analyzed from selected F2 and F3 population of MAS25 X IB370 crosses.
Field experiment
Seeds of selected lines and their parents were sown in three replicates at the Rice Research Station, Karnal, India (Latitude: 29.8526350 and Longitude: 76.6589720) during wet season 2014 (F3 progenies) and 2015 (F4 progenies). All the standard practices to grow aerobic rice were followed, as described by Rani et al. [15]. Five best plants among the three replicate of each line were harvested at maturity and the data were recorded on various agronomic traits like, plant height, number of effective tillers per plant, panicle length, number of panicles per plant, number of grains per panicle, 1000 grain weight, grain length/breadth ratio and grain yield per plant. Grain yield per plant was recorded after harvesting, threshing and drying to moisture content adjusted to 14%.
Pot experiment
Each selected line and their parents were sown in the replication of five, with one plant per pot. Manual weeding was done whenever required. The pots were irrigated with 1 liter of water for the first 15 days, and then with 1 liter after every third day up to panicle emergence. After twenty and forty days the pots were supplemented with Yoshida solution [16]. The data on root morphological traits i.e. root length, root thickness, fresh and dry root weight from five plants from each line at maturity were recorded and analyzed.
Statistical analysis
Statistical parameter of variability and phenotypic correlation coefficient were analyzed by using OPSTAT statistical tool [17].
Molecular Markers for Analysis of Aroma in Rice
Progenies showing the desired phenotypic results were used for genotypic analysis. Specific primers for betaine aldehyde dehydrogenase 2 (BAD2A) genes [18] were used for assessing the presence/absence of fragrance allele in rice progenies. Basmati rice variety, Improved Basmati 370 amplified two alleles of 585 and 257 bp, while MAS25 amplified 585 and 355 bp size alleles (Table 1 and Figure 1). The progenies having at least the BAD2A alleles of IB370 were selected for SSR marker analysis.
| Primer name | Primer sequence (5'-3') |
|---|---|
| External Sense Primer (ESP) | TTGTTTGGAGCTTGCTGATG |
| Internal Fragrant Antisense Primer (IFAP) | CATAGGAGCAGCTGAAATATATACC |
| Internal Non-fragrant Sense Primer (INSP) | CTGGTAAAAAGATTATGGCTTCA |
| External Antisense Primer (EAP) | AGTGCTTTACAAAGTCCCGC |
Table 1: Primers for fragrance.
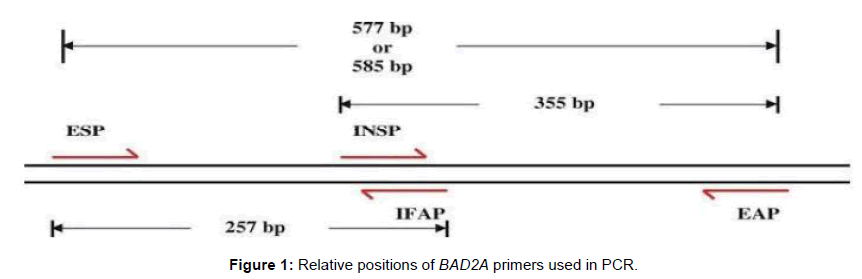
Figure 1: Relative positions of BAD2A primers used in PCR.
Genotyping of Mapping Population
For genotyping of desired plants from both field and net house conditions were selected. Performances of plant for yield and root traits were the main criteria for selection in field and net house respectively. Genomic DNA was isolated from young leaves using the CTAB method [18,19]. DNA quantity was estimated by ethidium bromide staining on 0.8% agarose gels using a standard containing 100 ng/ μl λ genomic DNA. PCR amplification was essentially carried out as described earlier by Jain et al. [20]. PCR products were separated on 8% polyacrylamide gels.
A total of 604 SSR markers widely distributed on 12 rice chromosomes (Figure S1) were used to analyze polymorphism and 70 polymorphic markers were detected. The molecular markers were obtained based on published rice genome maps IRGSP, 2005 and their physical position (Mb) on the indica genome [21] were used as a reference. Genetic similarities between the cultivars were measured by the similarity coefficient based on the proportion of shared electromorphs using the ‘Simqual’ subprogram of the NTSYS-PC (Version 2.02 Exeter Software, Setauket, NY, USA) software package.
Results and Discussion
Under field conditions enormous variation was observed for all the physio-morphological traits (Tables S1 and S2). Clearly the yield of aerobically adapted parent i.e. MAS25 is more than the basmati parent i.e. IB370 under aerobic conditions, this result is clearly in accordance with Sandhu et al. [22] and Promilla et al. [23]. Phenotypic correlation coefficient analysis of both populations showed variation in correlation coefficient between various physio-morphological traits (Tables S3 and S4). In F3 population plant height showed positive correlation with effective number of tillers/plant (0.618, p=0.01), 1000 grain weight (0.458, p=0.01); effective number of tillers with 1000 grain weight (0.444, p=0.01). While in F4 population, grain yield/ plant revealed a positive correlation with effective number of tillers/ plant (0.418, p=0.01); 1000 grain weight showed positive correlation with plant height (0.798, p=0.01) and effective number of tillers/plant (0.407, p=0.01); Grain length/breadth ratio showed positive correlation with plant height (0.486, p=0.01), panicle length (0.415, p=0.01) and 1000-grain weight (0.346, p=0.01).
Under net house conditions also enormous variation was observed for all the physio-morphological traits grown under aerobic condition for both F3 and F4 plants consisting of 62 and 14 plants respectively (Tables S5 and S6). In F3 population positive correlation between grain yield per plant and effective number of tillers/plant (0.416, p=0.01); plant height and root length (0.408; p=0.01); plant height and fresh root weight (0.432; p=0.01) (Table S7). In F4 also positive correlation was observed between grain yield/plant and plant height (0.903, p=0.01); grain yield/plant and 1000 grain weight (0.939, p=0.01); grain yield/ plant and length/breadth ratio (0.964, p=0.01); grain yield/plant and root thickness (0.826, p=0.01); grain yield/plant and dry root weight (0.946, p=0.01); Root length and Dry root (0.639, p=0.01); dry root weight and root thickness (0.581, p=0.01) (Table S8). Similar results were obtained by Girish et al., Ramesha et al., Akhtar et al., Yadav et al., Nagaraju et al., and Kumar et al. [24-30]. Frequency distribution curves were prepared for all the traits analyzed. In most of the cases it was parabolic, in some trait it was parabolic but skewed toward MAS25 (panicle length and grain yield in both generation) and IB370 (root thickness in both generation) (Figures S2 and S3).
In F3 all 100 plants from field and 43 from net house were analyzed for BAD2A allele (Figures 1 and 2, here allelic state of only 60 plants from field is shown). 60 plants were found to poses all the three alleles were selected for further analysis. Quantification of 2-acetyl-1-pyrroline (2AP) in large populations has been difficult and expensive. Consequently, molecular polymorphism at BAD2 aroma locus, which is highly efficient and cost-effective, has been widely used in discriminating fragrant and non-fragrant rice genotypes; it shows perfect co-segregation with the trait of fragrance in the mapping population [31-34].
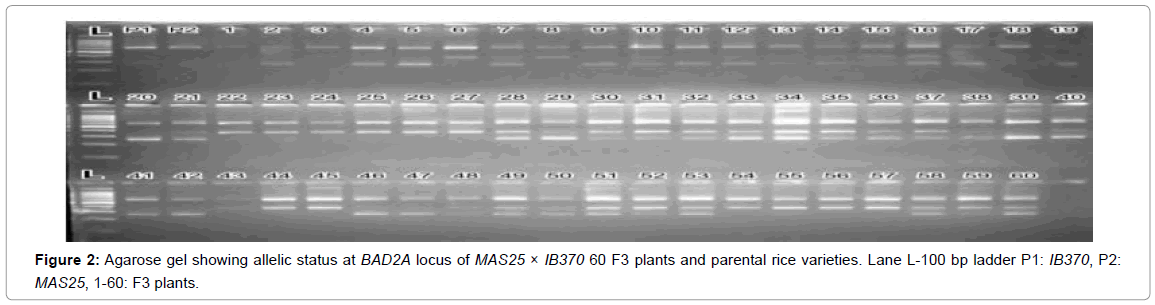
Figure 2: Agarose gel showing allelic status at BAD2A locus of MAS25 × IB370 60 F3 plants and parental rice varieties. Lane L-100 bp ladder P1: IB370, P2: MAS25, 1-60: F3 plants.
A DNA fingerprint database of selected 60 MAS25 x Improved Basmati 370 F3 plants (field experiment) and 13 net house plants was developed using 70 markers. Allelic state of the selected plant at SSR locus RM163 and RM219 are given in Figures 3 and 4.
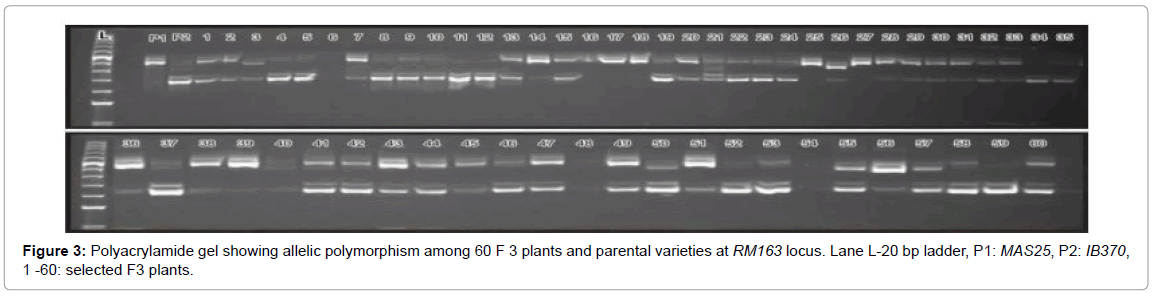
Figure 3: Polyacrylamide gel showing allelic polymorphism among 60 F 3 plants and parental varieties at RM163 locus. Lane L-20 bp ladder, P1: MAS25, P2: IB370, 1 -60: selected F3 plants.
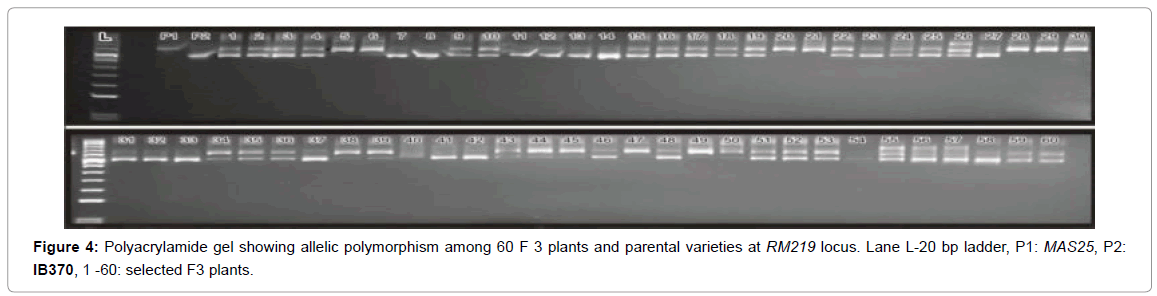
Figure 4: Polyacrylamide gel showing allelic polymorphism among 60 F 3 plants and parental varieties at RM219 locus. Lane L-20 bp ladder, P1: MAS25, P2: IB370, 1 -60: selected F3 plants.
The proportion of shared alleles of 70 polymorphic SSR markers was used to calculate the coefficient values among the selected 60 MAS25 × Improved Basmati 370 F3 plants (field experiment) and subjected to UPGMA tree cluster analysis. The allelic diversity was used to produce a dendrogram (cluster tree analysis, NTSYS-pc) to demonstrate the genetic relationship among 60 F3 plants from field (Figure 5) and 13 from net house with the parental rice varieties (Figure 6).
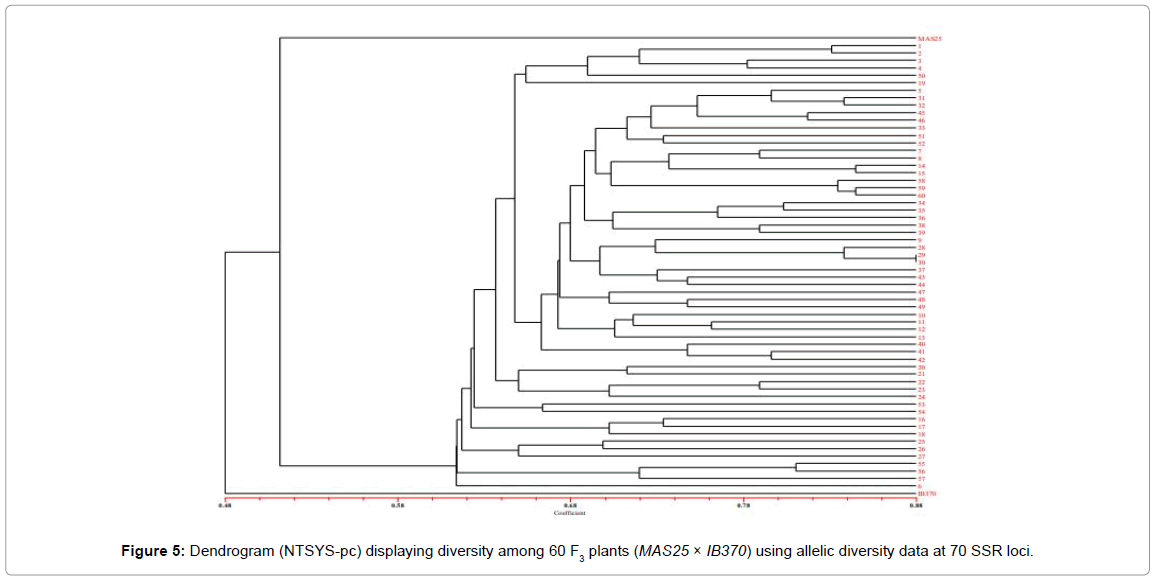
Figure 5: Dendrogram (NTSYS-pc) displaying diversity among 60 F3 plants (MAS25 × IB370) using allelic diversity data at 70 SSR loci.
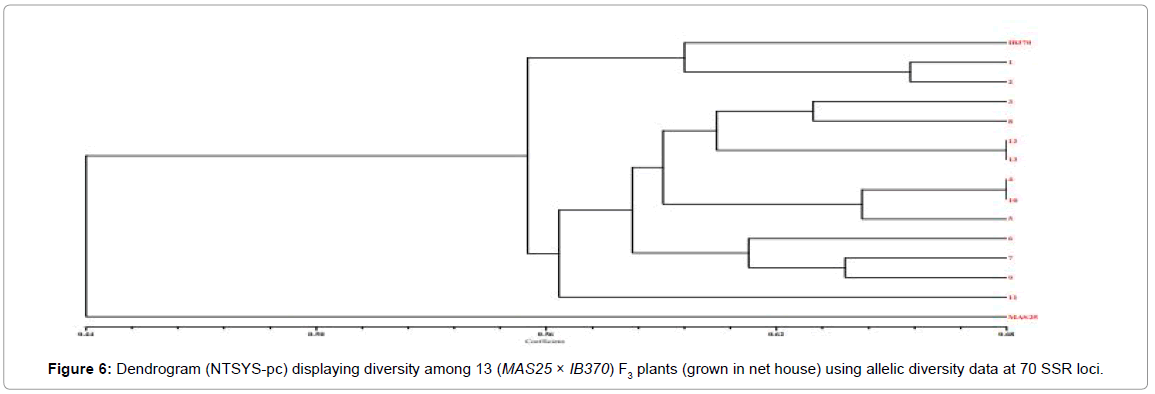
Figure 6: Dendrogram (NTSYS-pc) displaying diversity among 13 (MAS25 × IB370) F3 plants (grown in net house) using allelic diversity data at 70 SSR loci.
Parental rice genotypes, MAS25 and Improved Basmati 370, were quite diverse and bifurcate at the coefficient value of 0.48. The 60 F3 plants clustered in two major groups at a similarity coefficient of 0.51. Major group I consisted of MAS25 along with 60 F3 plants and group II had only Improved Basmati 370. Two-dimensional PCA scaling exhibited that F3 population was interspersed between the two parental lines with distribution of most plants towards MAS25 (Figures 7 and 8). The resultant distance matrix data were used for two- dimensional scaling of rice genotypes by principal component analysis. In this study, clustering or grouping of Basmati rice varieties in a different group than lowland and aerobic Indica rice is in the conformity with the earlier reports [22,33,35,36].
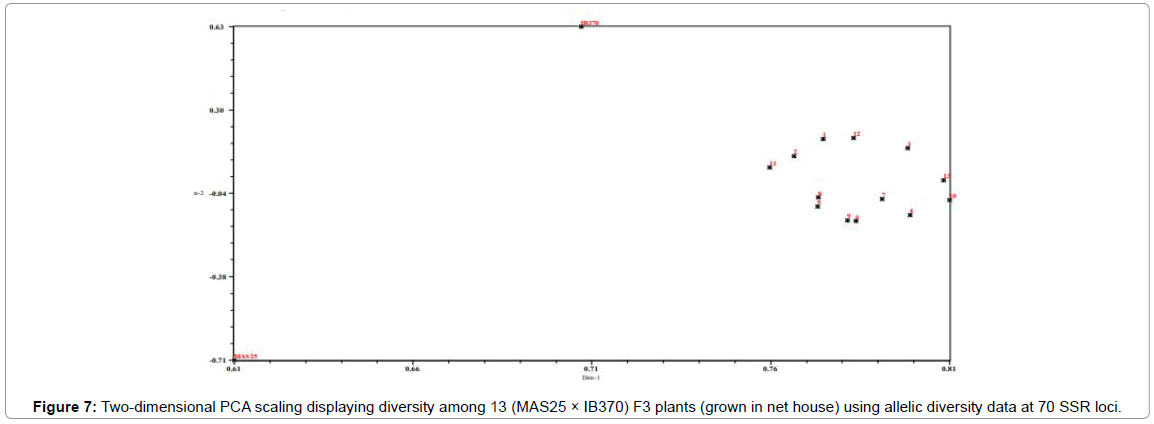
Figure 7: Two-dimensional PCA scaling displaying diversity among 13 (MAS25 × IB370) F3 plants (grown in net house) using allelic diversity data at 70 SSR loci.
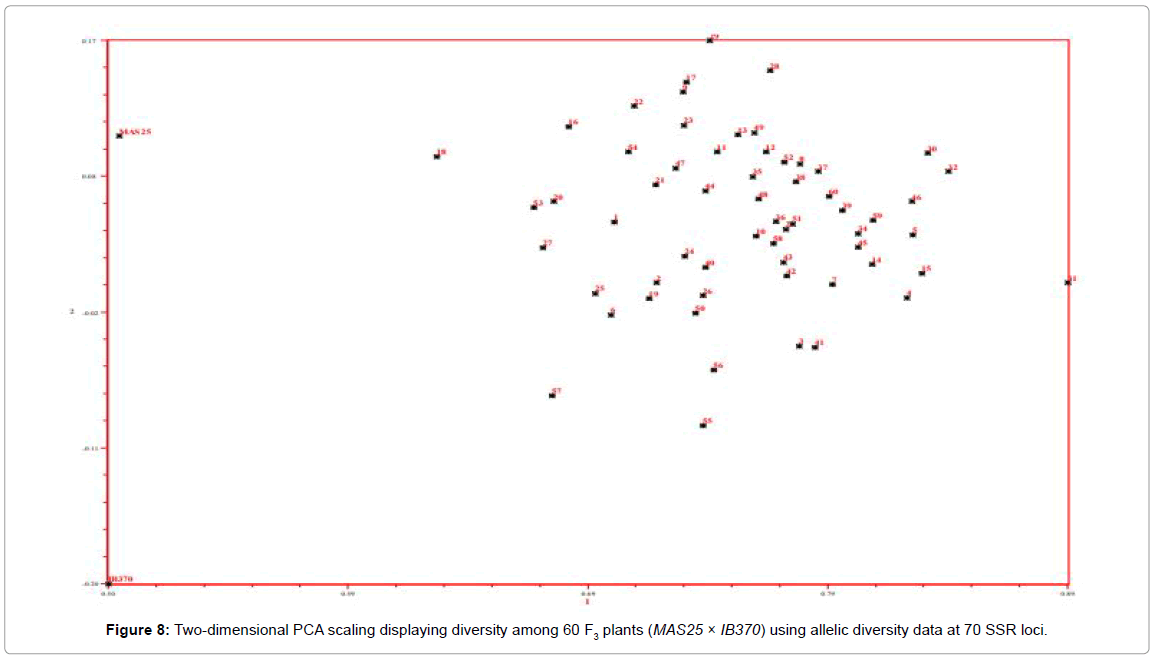
Figure 8: Two-dimensional PCA scaling displaying diversity among 60 F3 plants (MAS25 × IB370) using allelic diversity data at 70 SSR loci.
SSR database developed for MAS25 x IB370 F3 population comprising of 60 plants was used to map QTL for important physiomorphological traits using Composite Interval Mapping (CIM) analysis (WinQTL Cartographer 2.5). Analysis revealed a total of seven QTL (three for grain yield/plant, two QTL for effective number of tillers/ plant, one each for plant height and l/b ratio) which individually explained 3.6-72.1% phenotypic variance (Tables 1 and 2). Two QTL were associated with effective number of tillers/plant (qENT6.1 and qENT6.2) at map position of 7.4 and 28.81 cM on chromosome 6 and 9 respectively. One QTL was associated with panicle length (qPL1.1) at map position of 5.0 cM on chromosome 1, which had maximum LOD score of 7.0 and accounted for 54.43% phenotypic variation. Three QTL were associated with grain yield/plant (qGYP5.1, qGYP9.1, and qGYP12.1) at map positions of 34.2, 16.9 and 59.6 cM on chromosomes 5, 9 and 12, respectively. These QTL had LOD score of 5.3, 3.2 and 2.5 and accounted for 28.6, 33.6 and 72.1% phenotypic variation, respectively. One QTL associated with grain length/breadth ratio (qLB1.1) at map position of 69.4 cM on chromosome 1, had a LOD score 3.1 and explained 52.4% phenotypic variation.
| Trait | QTL name | Chromosome No | Position (cM) | Flanking markers | Position of flanking markers (cM) | LOD | Additive effect | R2 % | DPE |
|---|---|---|---|---|---|---|---|---|---|
| Effective no. of tillers/plant | qENT6.1 | 6 | 7.41 | RM588 | 7.4 | 2.506 | 3.9755 | 3.6587 | M |
| qENT9.1 | 9 | 28.81 | RM510- RM527 | 20.8-61.2 | 3.2313 | 6.0333 | 7.398 | M | |
| Panicle length | qPL1.1 | 1 | 5.01 | RM495- RM577 | 2.8-8.4 | 7.0988 | 3.2504 | 54.436 | M |
| Grain yield/plant | qGYP5.1 | 5 | 34.21 | RM13- RM24311 | 28.6-58.1 | 5.3268 | -4.6526 | 28.602 | IB |
| qGYP9.1 | 9 | 16.91 | RM524- RM321 | 13.2-32.1 | 3.2899 | -5.0764 | 33.68 | IB | |
| qGYP12.1 | 12 | 59.61 | RM277- RM1261 | 57.2-61.6 | 2.5038 | -2.0095 | 72.149 | IB | |
| Grain length-breadth ratio | qLB1.1 | 1 | 69.41 | RM580- RM24 | 68.2-78.6 | 3.1053 | -0.168 | 52.477 | IB |
Table 2: QTL mapping for physio-morphological traits promoting aerobic adaptation using 70 SSR markers database of MAS25 × IB370 F3 population.
In Tables 2 and 3 DPE (direction of phenotypic effect); M and IB indicate “MAS25” and “Improved Basmati 370” alleles, respectively. R2 is phenotypic variation, Additive effect is half the difference between the effect of “MAS25” allele and “Improved Basmati 370” allele; its positive value indicates that the effect of genotype “MAS25” was in the direction of increasing the trait value, LOD-log10 of an odd ratio.
| Trait | QTL name | Chromosome number | Position (cM) | Flanking markers | Position of flanking markers (cM) | LOD | Additive effect | R2 % | DPE |
|---|---|---|---|---|---|---|---|---|---|
| Effective no. of tillers/plant | qENT3.1 | 3 | 58.21 | RM517-503 | 42.9-153.9 | 4.51 | 3.9501 | 58.4562 | M |
| Panicle length | qPL3.1 | 3 | 31.21 | RM569-RM517 | 19.1-42.9 | 3.62 | 1.4718 | 0.0071 | M |
| Grain yield/plant | qGYP2.1 | 2 | 62.01 | RM154-RM424 | 4.8-68.9 | 5.77 | -0.6317 | 10.4857 | IB |
| qGYP6.1 | 6 | 39.41 | RM588-RM345 | 7.4-123.9 | 2.76 | -2.2434 | 0.8441 | IB | |
| qGYP6.2 | 6 | 104.41 | RM588-RM345 | 7.4-123.9 | 2.79 | -0.0617 | 2.1558 | IB | |
| Grain length-breadth ratio | qLB6.1 | 6 | 76.41 | RM588-RM345 | 7.4-123.9 | 4.45 | -0.2696 | 0.0003 | IB |
| qLB9.1 | 9 | 32.51 | RM444-RM434 | 3.3-57.7 | 6.31 | -0.5622 | 93.269 | IB |
Table 3: QTL mapping for physio-morphological traits promoting aerobic adaptation using 70 SSR marker database of MAS25 × IB370 F4 population.
Three of the seven QTL had positive values for additive effect indicating that the favoring alleles were from donor parent MAS25 (Figures 9 and 10).
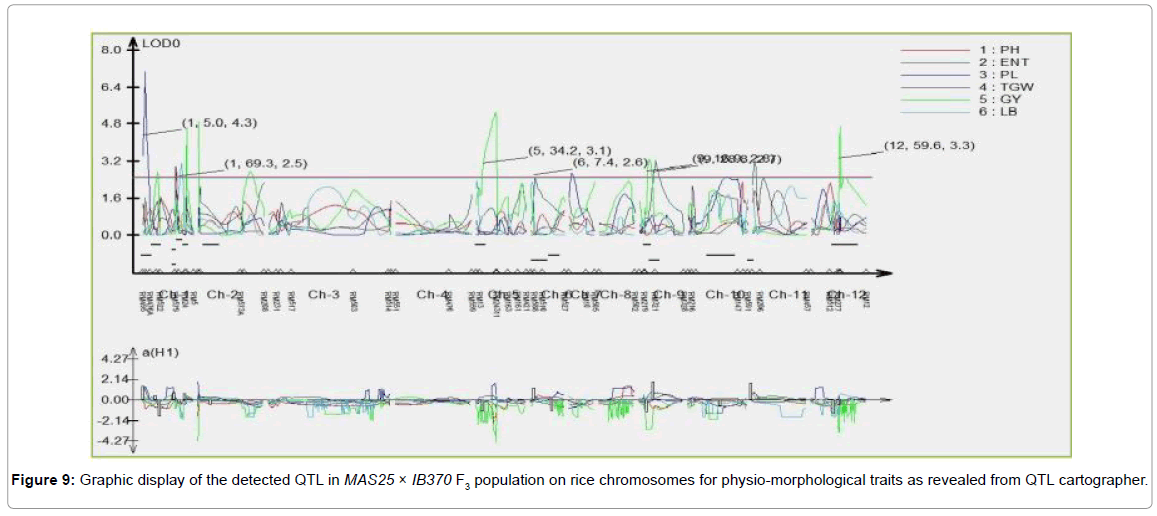
Figure 9: Graphic display of the detected QTL in MAS25 × IB370 F3 population on rice chromosomes for physio-morphological traits as revealed from QTL cartographer.
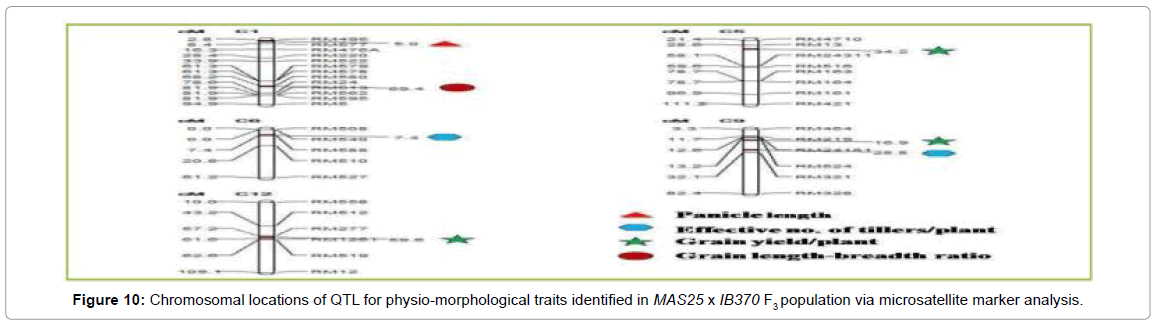
Figure 10: Chromosomal locations of QTL for physio-morphological traits identified in MAS25 x IB370 F3 population via microsatellite marker analysis.
A total twenty-two (17 from field and 5 from net house) plants were selected to grow F4 progeny from F3 plants on the basis of physiomorphological performance and root traits (in case of net house evaluation) and status of allelic profile at BAD2A and SSR locus for further progeny analysis. BAD2A marker analysis was done in F4 plants. Plants possessing the desirable BAD2A alleles were selected for SSR marker analysis. SSR database of 60 and 14 F4 plants selected from the field and net house experiments were developed using 70 polymorphic SSR markers. Polyacrylamide gels displaying allelic polymorphism in MAS25 × Improved Basmati 370 F4 population for SSR markers are shown (Figures 11 and 12).
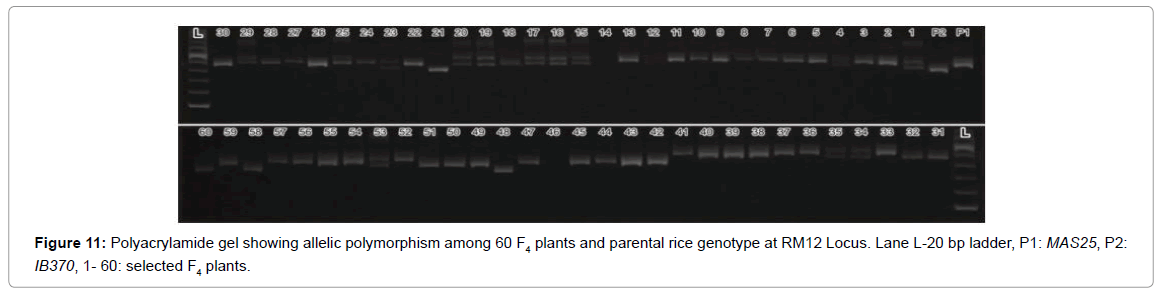
Figure 11: Polyacrylamide gel showing allelic polymorphism among 60 F4 plants and parental rice genotype at RM12 Locus. Lane L-20 bp ladder, P1: MAS25, P2: IB370, 1- 60: selected F4 plants.
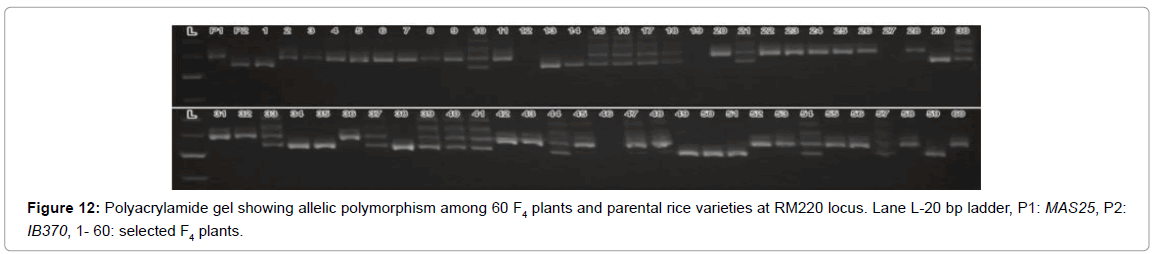
Figure 12: Polyacrylamide gel showing allelic polymorphism among 60 F4 plants and parental rice varieties at RM220 locus. Lane L-20 bp ladder, P1: MAS25, P2: IB370, 1- 60: selected F4 plants.
The 60 F4 plants (field experiment) clustered in three major groups at similarity coefficient of 0.51 (Figure 13). Major group I consisted of IB370 along with four F4 plants, major group II had MAS25 with 54 F4 plants and major group III had only two F4 plants. Similarly net house plants also clustered at similarity coefficient of 0.51 (Figure 14). Genetic relationships among these rice genotypes (both net house and field) were also assessed by PCA analysis (Figures 15 and 16).
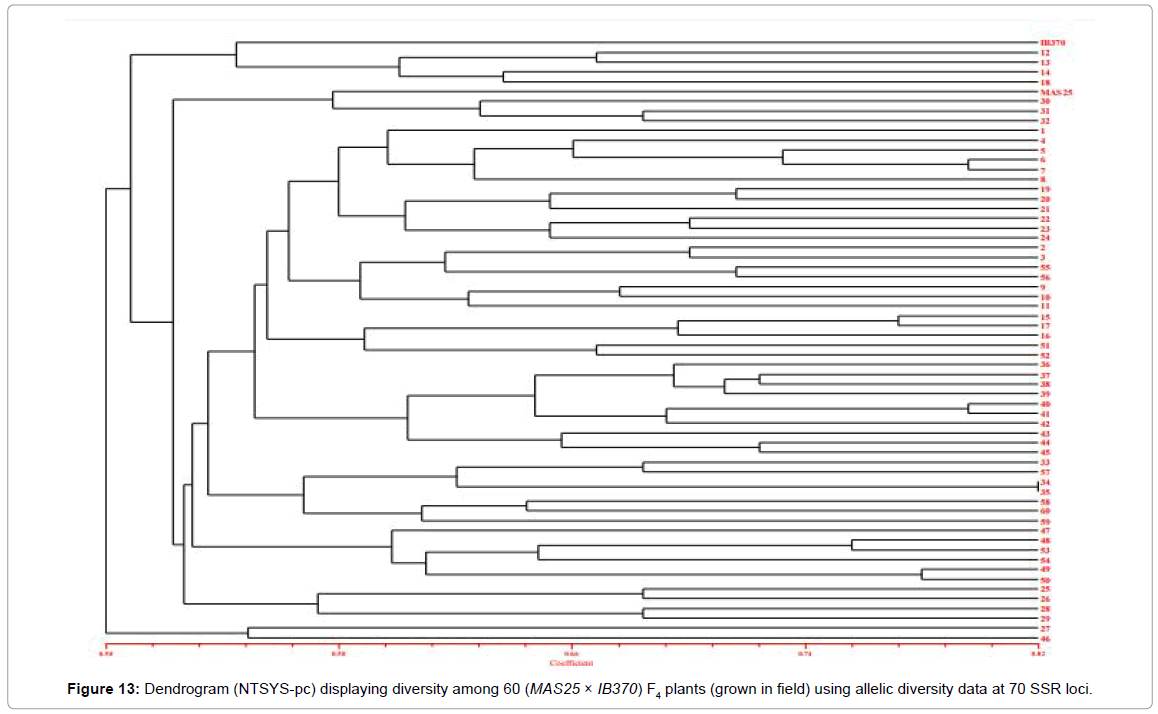
Figure 13: Dendrogram (NTSYS-pc) displaying diversity among 60 (MAS25 × IB370) F4 plants (grown in field) using allelic diversity data at 70 SSR loci.
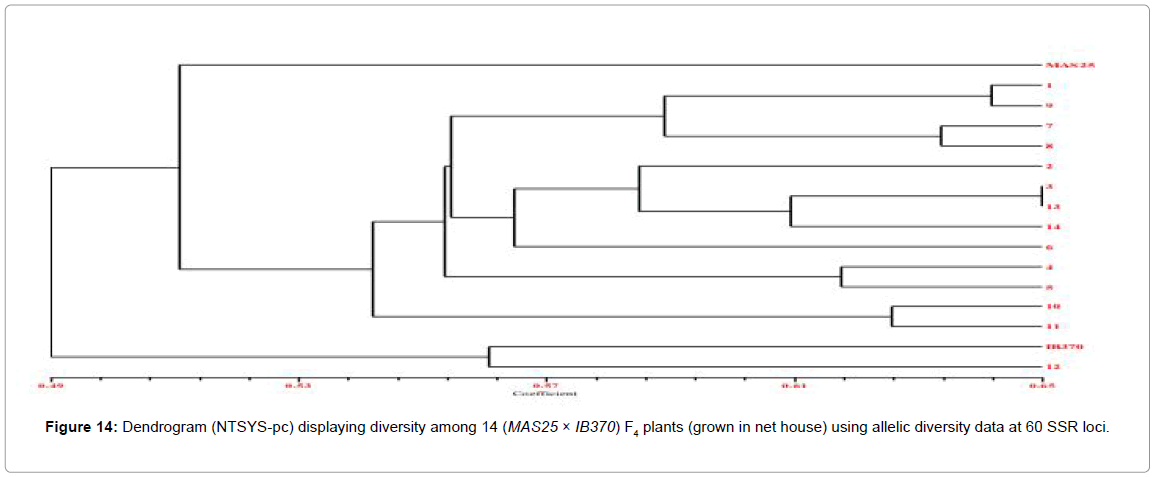
Figure 14: Dendrogram (NTSYS-pc) displaying diversity among 14 (MAS25 × IB370) F4 plants (grown in net house) using allelic diversity data at 60 SSR loci.
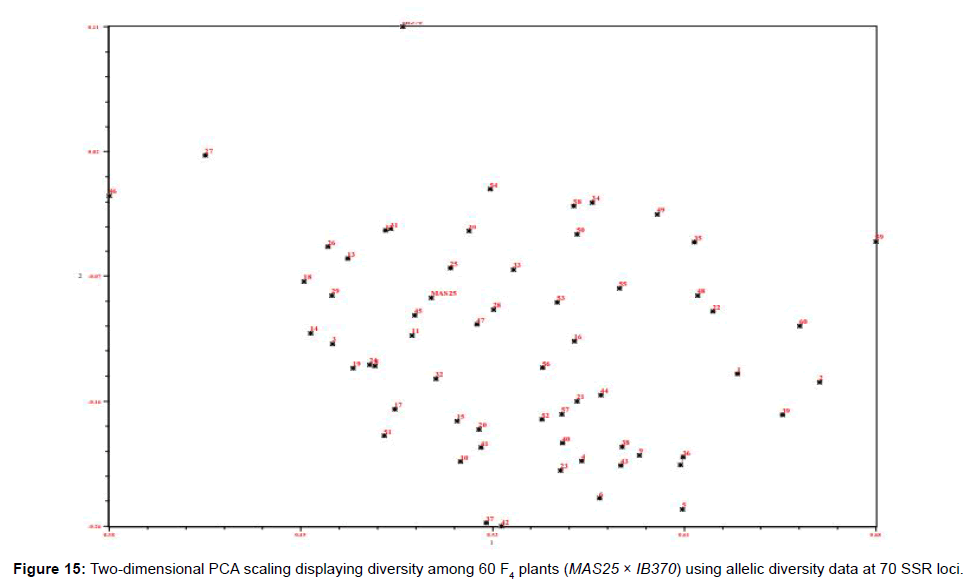
Figure 15: Two-dimensional PCA scaling displaying diversity among 60 F4 plants (MAS25 × IB370) using allelic diversity data at 70 SSR loci.
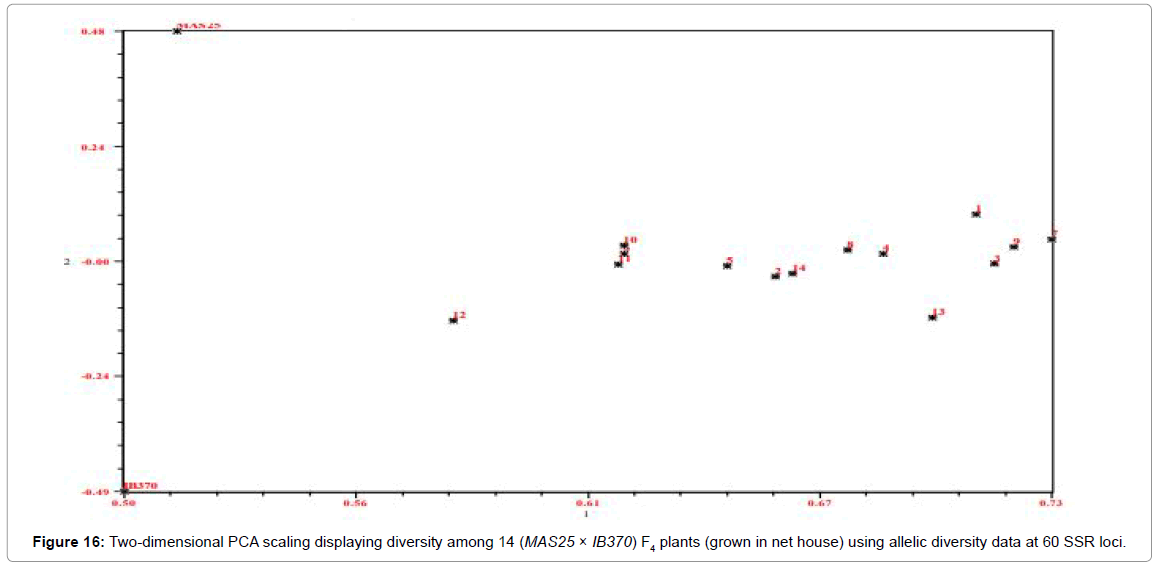
Figure 16: Two-dimensional PCA scaling displaying diversity among 14 (MAS25 × IB370) F4 plants (grown in net house) using allelic diversity data at 60 SSR loci.
SSR database developed for MAS25 x IB370 F4 population comprising of 60 plants was used to map QTL for important physiomorphological traits using Composite Interval Mapping analysis (WinQTL Cartographer 2.5). A total of seven QTL were mapped which individually explained 93.2% phenotypic variation (Table 3). One of these QTL was associated with effective number of tillers/plant (qENT3.1) at map position of 58.2 cM on chromosome 3 with LOD score of 4.5 another one with panicle length (qPL3.1) at map position of 31.2 cM on chromosome 3. Three QTL were associated with grain yield/ plant (qGYP2.1, qGYP6.1, and qGYP6.2) at map positions of 62.0, 39.4 and 104.4 cM on chromosomes 2, 6 and 6 with LOD score of 5.7, 2.7 and 2.7 respectively. Two QTL were mapped for L/B ratio (qLB6.1 and qLB9.1) at map position of 76.4 and 32.5 cM on chromosome 6 and 9; qLB9.1 accounted for 93.2% phenotypic variation having LOD score 6.3 (Figures 17 and 18).
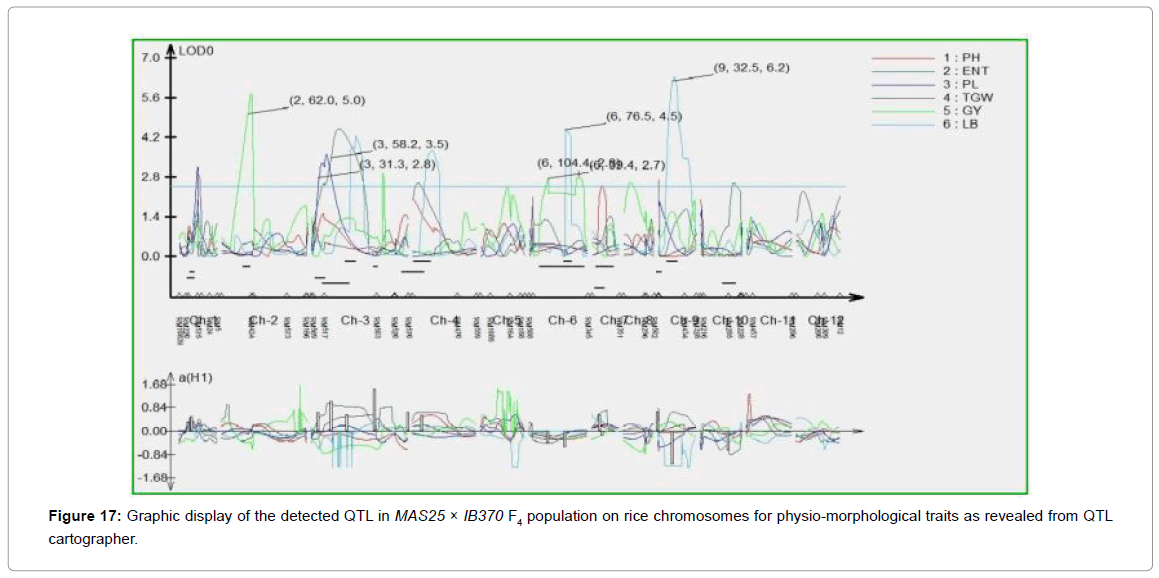
Figure 17: Graphic display of the detected QTL in MAS25 × IB370 F4 population on rice chromosomes for physio-morphological traits as revealed from QTL cartographer.
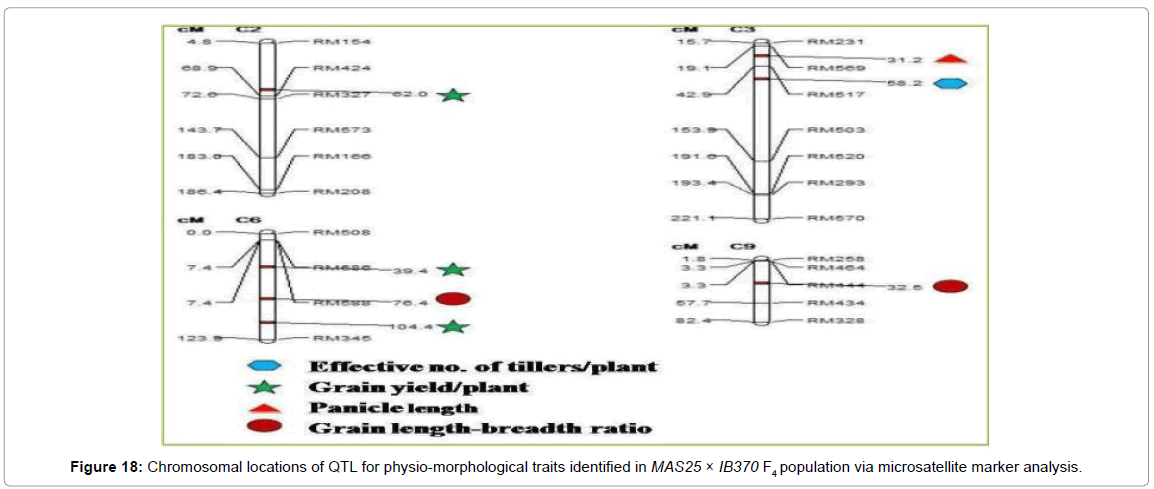
Figure 18: Chromosomal locations of QTL for physio-morphological traits identified in MAS25 × IB370 F4 population via microsatellite marker analysis.
QTL mapping of drought resistance traits in the background of locally adapted Indica/Basmati rice lines have been reported by several research groups in rice [8,34]. However, identification of QTL linked to yield under water-limited aerobic conditions in target populations is critical. Marker-assisted selection using consistent-effect QTL promoting aerobic adaptation is an efficient approach for developing water-efficient aerobic rice varieties. As in the case of drought, QTL for a number of physio-morphological traits have been identified but with limited implications in breeding drought-tolerance rice varieties. Large-effect QTL for grain yield under drought have been identified [8,37] and their successful introgression has established yield-advantage under drought [38].
A total of twenty-two (18 from field and 4 from net house) MAS25 × IB370 derived F4 plants were selected on the basis of grain yield/plant, grain length/breadth ratio and as well as presence of basmati rice specific BAD2A allele in homozygous or heterozygous state for further progeny analysis. F4 plants, M25/IB-A-4-3 and M25/IB-A-5-3 had higher grain yield (>16.30) in comparison to the parental rice varieties. As many as five plants, M25/IB-A-5-3, M25/IB-A-15-2, M25/IB-A-19-3, M25/IBA- 18-1 and M25/IB-A-17-2, also had higher grain length/breadth ratio (4.71-5.03) in comparison to IB370 (4.7). All the plants selected from the net house experiments had root length (42.9-54.50) or root weight (fresh root weight 15.69-20.90, dry root weight 4.29-5.32) comparable or higher than parental rice genotype, MAS25 (fresh root weight 9.5 ± 0.34 and dry root weight 2.1 ± 0.57).
References
- Yu J, Hu S, Wang J, Wong GKS, Li S, et al. (2002) A draftsequence of the rice genome (Oryza sativa L. ssp. indica). Science 296: 79-92.
- IRRI (2009) Farm Data Rice Ecosystems, 30: Distribution of Rice Crop Area by Environment, 2004 2006. In: IRRI World Rice Statistics, IRRI (Ed.). International Rice Research Institute, los Bancs, Philippines.
- Borell A, Garside A, Shu FK (1997) Improving efficiency of water for irrigated rice in semi-arid tropical environment. Field Crops Res 52: 231-248.
- Lin S, Dittert K, Tao H, Kreye C, Xu Y, et al. (2002) In: Proceedings of International Workshop on Water wise Rice Production, 8-11 April 2002, Los Banos, Philippines, and IRRI. pp. 187-196.
- Stoop W, Uphoff N, Kassam A (2002) A review of agricultural research issues raised by system of rice intensification (SRI) from Madagascar: opportunities for improving farming systems for resource poor farmers. Agric System71: 249-274.
- Bouman BAM, Tuong TP (2001) Field water management to save water and increase its productivity in irrigated rice. Agric Water Manage 49: 11-30.
- Tuong TP, Bouman BAM (2003) Rice production in water scarce environments. In: Kijne JW, Barker R, Molden D (eds) Water productivity in agriculture: limits and opportunities for improvement. CABI Publishing, UK. 53-67.
- Venuprasad R, Dalid CO, Del Valle M, Zhao D, Espiritu M, et al. (2009) Identiï¬cation and characterization of large effect quantitative trait loci for grain yield under lowland drought stress in rice using bulk segregant analysis. Theoret Appl Gene120: 177-190.
- Vikram P, Swamy BPM, Dixit S, Ahmed HU, Cruz MTS, et al. (2011) qDTY1.1, a major QTL for rice grain yield under reproductive stage drought stress with a consistent effect in multiple elite genetic backgrounds. BMC Genetics 12: 89-93.
- Steele KA, Virk DS, Kumar R, Prasad SC, Witcombe JR (2007) Field evaluation of upland rice lines selected for QTLs controlling root traits. Field Crops Res 101: 180-186.
- Qu Y, Mu P, Zhang H, Chen CY, Gao Y, et al. (2008) Mapping QTLs of root morphological traits at different growth stages in rice. Genetica133: 187-200.
- Kanbar A, Shashidhar HE (2004) Correlation and path analysis for root morphological traits in indica × indica population of rice (Oryza sativa L.). Crop Res 27: 94-98.
- Sandhu N, Jain S, Kumar A, Mehla BS, Jain RK (2013) Genetic variation, linkage mapping of QTL and correlation studies for yield, root, and agronomic traits for aerobic adaptation. BMC Genetics14: 104-120.
- Dixit S, Singh A, Cruz MTS, Paul TM, Amante M, et al. (2014) Multiple major QTL lead to stable yield performance of rice cultivars across varying drought intensities. BMC Genetics 15:16.
- Rani K, Kumar K, Meena RK, Mahavir, Jain RK, et al. (2017) Phenotypic and microsattelite marker analysis of selected lines of aerobic rice under water limited conditions. Ann Agric Res New Series38: 1-6.
- Yoshida S, Forno DA, Cock JH, Gomez KA (1976) Laboratory manual for physiological studies of rice. 3d ed. International Rice Research Institute, Los Baños, Philippines.
- Sheoran OP, Tonk DS, Kaushik LS, Hasija RC, Pannu RS (1998) Statistical Software Package for Agricultural Research Workers. Recent Advances in information theory, Statistics & Computer Applications by D.S. Hooda & R.C. Hasija Department of Mathematics Statistics, CCS HAU, Hisar pp139-143.
- Bradbury LMT, Henry RJ, Jin Q, Reinke F, Waters DLE (2005) A perfect marker for fragrance genotyping in rice. Mol Breed 16: 279-283.
- Saghai Maroof MA, Soliman KM, Jorgensen RA, Allard RW (1984) Ribosomal DNA spacer length polymorphism in barley: Mendelian inheritance, chromosomal location and population dynamics. Proc Nat Acad Sci81: 8014-8019.
- Jain N, Jain S, Saini N, Jain RK (2006) SSR analysis of chromosome 8 regions associated with aroma and cooked kernel elongation in Basmati rice. Euphytica152: 259-273.
- Sandhu N, Jain S, Chowdhury VK, Jain RK (2012) Microsatellite diversity among aerobic and lowland indica rice genotypes with differential water requirements. Indian J Gene72: 463-467.
- Promila R, Nitika S, Sunita J, Mehla BS, Jain RK (2015) Marker-assisted selection and QTL mapping for yield, root morphology and agronomic traits using MASARB25 (aerobic) × Pusa Basmati 1460 F3 mapping populations. Indian J Gene Plant Breed 4: 602-607.
- Girish TN, Gireesha TM, Vaishali MG, Hittalmani S (2006) Response of a new IR50/Moroberekan recombinant inbred population of rice (Oryza sativa L.) from an indica x japonica cross for growth and yield traits under aerobic conditions. Euphytica152: 149-161.
- Ramesha MS, Hasan MJ, Kulsum MU, Akter A, Masuduzzaman ASM (2010) Genetic variability and character association for agronomic traits in hybrid rice (Oryza sativa L.). Bangladesh J Plant Breed Gene24: 45-51.
- Akhtar N, Nazir MF, Rabnawaz A, Mahmood T, Safdar ME, et al. (2011) Estimation of heritability, correlation and path coefficient analysis in fine grain rice. J Anim Plant Sci24: 660-664.
- Yadav SK, Pandey P, Kumar B, Suresh BG (2011) Genetic architecture, interrelationship and selection criteria for yield improvement in rice. Pak J Biol Sci14: 540-545.
- Nagaraju C, Sekhar MR, Reddy KH, Sudhakar P (2013) Correlation between traits and path analysis coefficient for grain yield and other components in rice (Oryza sativa L.) genotypes. Int J Appl BiolPharm Tech 4: 137-142.
- Kumar K, Rani K, Meena RK, Mahavir, Jain RK, Jain S (2017) Molecular marker analysis of selected rice lines for aerobic traits under water limited conditions.The Bioscan 12:1309-1315.
- Kumar K, Rani K, Meena RK, Jain RK, Jain S (2018) Agronomic and molecular marker evaluation of selected f4 plants of rice (Oryza sativa L.) under aerobic conditions. Agric Res JÂ 55: 20-26.
- Sakthivel K, Shobha NR, Pandey MK, Sivaranjani AKP, Neeraja CN, et al. (2006) Allele mining for aroma gene BAD2 in Indian rice cultivars. 2nd international rice congress, New Delhi, 9-13 October, pp 316.
- Kharb A, Sandhu N, Jain S, Jain RK (2015) Linkage mapping of quantitative trait loci for traits promoting aerobic adaptation on chromosome 8 in indica rice (Oryza sativa L.). Rice Genom Genetics6: 1-5.
- Kovacha MJ, Calingacionb MN, Melissa A, Fitzgeraldb, McCoucha SR (2009) The origin and evolution of fragrance in rice (Oryza sativa L.). Proc Natl Acad Sci106: 14444-14449.
- Sandhu N, Singh A, Dixit S, Cruz MTS, Maturan PC, et al. (2014) Identification and mapping of stable QTL with main and epistasis effect on rice grain yield under upland drought stress. BMC Genetics15: 63-78.
- Glaszmann JC (1987) Isoenzyme and classification of Asian rice varieties. Theoret Appl Genetics74: 21-30.
- Jain S, Jain RK, Susan RM (2004) Genetic analysis of Indian aromatic and quality rice germplasm using panels of fluorescently-labeled microsatellite markers. Theoret Appl Genetics109: 965-977.
- Bernier J, Kumar A, Ramaiah V, Spaner D, Atlin G (2007) A large-effect QTL for grain yield under reproductive-stage drought stress in upland rice. Crop Sci47: 505-516.
- Swamy BPM, Kaladhar K, Reddy GA, Viraktamath BC, Sarla N (2013) Mapping and introgression of QTL for yield and related traits in two backcross populations derived from Oryza sativa cv. Swarna and two accessions of O. nivara. J Gene 93: 643-654.
Citation: Meena RK, Kumar K, Rani K, Pippal A, Bhusal N, et al. (2018) Genotypic Screening of Water Efficient Extra-Long Slender Rice Derived from MAS25 X IB370. J Rice Res 6: 194. DOI: 10.4172/2375-4338.1000194
Copyright: © 2018 Meena, et al. This is an open-access article distributed under the terms of the Creative Commons Attribution License, which permits unrestricted use, distribution, and reproduction in any medium, provided the original author and source are credited.
Share This Article
Recommended Journals
Open Access Journals
Article Tools
Article Usage
- Total views: 4109
- [From(publication date): 0-2018 - Apr 03, 2025]
- Breakdown by view type
- HTML page views: 3308
- PDF downloads: 801