Genotypic Evaluation of Different Rice Varieties for Yield and Yield Related Traits
Received: 10-Aug-2018 / Accepted Date: 01-Oct-2018 / Published Date: 03-Oct-2018 DOI: 10.4172/2375-4338.1000199
Abstract
The associations among phenotypic and genotypic traits of rice and the pattern influence on rice grain yield were investigated among 18 rice varieties. This evaluation is vital to know the effects of various characters on yield for selection criteria for high yielding genotype. Experiment was carried out in randomized complete block design (RCBD) with three replications. Yield and yield related traits were studied. Statistical analysis exhibited that rice varieties differed significantly for days to 50% heading (DH), number of primary (PB) and secondary branches per panicle (SPB), spikelets per panicle (SP), days to maturity (DM), thousand grain weight (TGW), and grain yield (GY). Moreover, significantly positive genotypic correlations of grain yield with PB, SPB, SP and TGW were observed. Principal component analysis also classified superior varieties. Swat-1, IR-8, DR-82 and Fakhr-e-Malakand showed superiority for yield and yield related traits. These four varieties can be used as commercial cultivars in Peshawar area after multi- location yield test trials.
Keywords: Rice; Varieties; Evaluation; Yield; Phenotype
Introduction
Improving rice (Oryza sativa L. ) production per unit area will be a major threat in future due to the increasing global population and rice demand in the world. Rice is the main food of majority of the world’s population. It provides at least 27% of the nutritional diet and 20% of the protein consumption in the developing world. In Pakistan, rice is an important export item that contributes 6.4% of total agriculture production and accounts 1.4% to GDP. Rice is cultivated on an area of 2.96 million hectares with total production of 6.95 million tons [1]. In Pakistan, rice is mostly cultivated in four different agriculture zones. The first region includes the hilly areas of Khyber Pakhtunkhwa with mostly colder regions. The second zone of rice cultivation areas are irrigated land between Chenab and Ravi rivers of Punjab region where the weather is generally suitable for cultivation of fine aromatic rice varieties. The third and fourth zones include western bank of the Indus River and its Delta, respectively, as the climatic conditions of these regions are appropriate for the cultivation of coarse rice cultivars [2].
Morphological characterization is healthy, reliable, vigorous and cost-effective method for categorization of germplasm. It aids in assessing genetic diversity among varieties, accessions, breeding populations and wild relatives of a particular crop. This characterization of genetic diversity in diverse germplasm in turn helps in estimation of morphological and agronomic traits have been employed for studying classification and genetic variation in rice germplasm [3,4]. Therefore, the main objectives of most crop development programs are to know, classify and develop high yielding varieties. However, grain yield of cereals is a complex trait, determine by the interaction among its components [5]. Indirect selection is generally more convenient to produce high yielding varieties, as yield traits are hard to be improved through direct selection [6]. While, indirect selection depends on strong correlations among secondary traits, primary traits and high heritability of traits [7]. Phenotypically such correlations are the effect of environmental and genetic factors [8]. Mostly, various yield related traits show positive genotypic and phenotypic correlations with grain yield [6,9,10]. Correlation analysis of the traits is a useful method to identify the important association between two characters [11]. The main objectives of the present study were; (1) to evaluate rice varieties for yield and yield related traits; (2) to study the phenotypic and genotypic correlations among various yield related traits.
Material and Methods
Genotypic evaluation of 18 rice varieties was done at Research Farm of Khyber Pukhtunkhwa Agricultural University Peshawar, Pakistan. The varieties viz., Bas-2000 , Bas-Pak , Shaheen-Basmati , Bas-370 , Sugdesi , Fakhr-e-Malakand , Kangni-27, IR-8 , Malhar-346 , DR-82 , Swat-1 , Shadab-31 , Kashmir Basmati , Bas-385 , PK-177 , JP-5 , NIABIR-9 and Pakhal were sown in RCBD with three replicates. Firstly, rice nursery was grown and then seedlings were transplanted after three weeks into a well puddled rice field. Each variety was grown in three-rows with row length of 2 m, with a distance of 20 cm between plants and 30 cm between the rows. All essential cultural practices like weeding, fertilizer, pesticides and irrigation were applied equally to all the experimental plots. At maturity five randomly selected plants per plot were used for data recording. Days to 50% heading (DH) was recorded for all varieties from seedling date to the day when 50% of panicles developed. Five randomly selected panicles per plant were used for data recording on various panicle traits at maturity. DM was calculated from the seeding day to the day when appropriately 85% of the total seed grains on the panicles got fully matured. GY was recorded in kilograms after threshing all the three rows of individual plot and then the data was converted into kg ha-1. The data were evaluated using Analysis of Variance technique [12] with the help of statistical tool (SAS institute, 1985). Further, least significant difference (LSD) test was used to check significant differences among the treatments. To know the phenotypic and genotypic correlation coefficients among various characters were determined using SAS statistical tool according to the following formulae
rg = COVgij/(δ2gi × δ2gj)1/2, rp = Mij/(Mii × Mjj)1/2
Where rp and rg are the phenotypic and genotypic correlation coefficients for the characters i and j. COVgij and δ2gi are used for covariance and variance, respectively for the traits i and j. Mij stand for mean product for varieties while Mjj and Mii are the varieties means squares for the characters j and i, respectively.
Results
Days to 50% heading (DH)
For DH, significant differences (p ≤ 0.01) among the rice varieties were observed (Table 1). DH among the varieties ranged from 84 to 137 days. Minimum DH (84) was noted for JP-5 while maximum DH (137) was recorded for Bas-Pak (Table 2). Moreover, it is also confirmed by phenotypic and genotypic correlations of DH with DM which showed significantly positive correlation (Table 2).
| SOV | DF | DH | PB | SB | SP | DM | TGWT | GY |
|---|---|---|---|---|---|---|---|---|
| Replications | 2 | 12.5 | 33.9** | 13.1 | 1029* | 12.7 | 93 | 348721 |
| Genotypes | 17 | 559** | 7.1** | 210.0** | 3054** | 537** | 657 | 15526532** |
| Error | 34 | 8.1 | 0.3 | 16.61 | 291.1 | 5.52 | 93 | 2835 |
*,**significant at 5 and 1% levels of probability, respectively.
Table 1: Mean squares for days to 50% heading (DH), PB, SB, SP, DM, TGW and GY.
| Rice genotypes | DH | PB | SB | SP | DM | TGWT (g) | GY(kg ha-1) |
|---|---|---|---|---|---|---|---|
| Bas-2000 | 130 | 13 | 46 | 220 | 161 | 36.6 | 8148 |
| Bas-Pak | 137 | 11 | 15 | 131 | 169 | 23 | 8889 |
| Shaheen Basmati | 114 | 10 | 39 | 204 | 146 | 31.4 | 12222 |
| Bas-370 | 121 | 9 | 35 | 176 | 153 | 31.8 | 12222 |
| Sugdesi | 130 | 9 | 38 | 197 | 163 | 30.8 | 9815 |
| Fakhr-e-Malakand | 106 | 10 | 31 | 164 | 139 | 21.6 | 8148 |
| Kangni-27 | 92 | 11 | 47 | 218 | 125 | 36.8 | 9259 |
| IR-8 | 114 | 12 | 46 | 222 | 146 | 38.4 | 15370 |
| Malhar-346 | 90 | 11 | 30 | 188 | 123 | 35.7 | 9815 |
| DR-82 | 115 | 11 | 47 | 252 | 147 | 34.9 | 13148 |
| Swat-1 | 105 | 14 | 47 | 217 | 138 | 34.9 | 12963 |
| Shadab-31 | 118 | 11 | 41 | 206 | 151 | 33.9 | 14444 |
| Kashmir Basmati | 92 | 8 | 28 | 144 | 123 | 31.6 | 10926 |
| Bas-385 | 121 | 11 | 41 | 213 | 145 | 27.1 | 12533 |
| PK-177 | 114 | 13 | 33 | 190 | 146 | 36.9 | 13889 |
| JP-5 | 84 | 13 | 38 | 191 | 114 | 36.9 | 12963 |
| NIAB-IR-9 | 112 | 12 | 39 | 240 | 145 | 33.3 | 14074 |
| Pakhal | 93 | 11 | 30 | 162 | 126 | 35.1 | 13518 |
| LSD (0.05) | 4.7 | 0.93 | 6.7 | 28.3 | 3.9 | 50.6 | 28.3 |
Table 2: Average of the days to 50% heading (DH), PB, SB, SP, DM, GW and GY.
Number of primary branches per panicle (PB)
Rice varieties exhibited significant (p ≤ 0.01) variation for PB (Table 1). Mean PB among the varieties ranged from 8 to 14. Least PB (8) was observed for Kashmir Basmati while Swat-1 had maximum PB (14) (Table 2). PB exhibited significantly positive phenotypic and genotypic correlation with SP (Table 3).
| DH | PB | SB | SP | DM | TGWT | GY | ||
|---|---|---|---|---|---|---|---|---|
| DH | rp | - | 0.17 | -0.03 | 0.07 | 0.99** | -0.37* | -0.14 |
| rg | 0.07 | -0.04 | 0.04 | 0.98** | -0.32* | 0.04 | ||
| PB | rp | - | -0.38 | 0.46* | 0.12 | -0.39 | -0.14 | |
| rg | -0.04 | 0.44* | 0.1 | -0.32* | 0.04 | |||
| SB | rp | - | 0.88** | -0.06 | 0.39 | 0.24 | ||
| rg | 0.06 | -0.03 | 0.53** | 0.28 | ||||
| SP | rp | - | 0.05 | -0.35 | -0.12 | |||
| rg | 0.06 | 0.47** | 0.27* | |||||
| DM | rp | - | 0.35 | -0.12 | ||||
| rg | -0.35 | -0.13 | ||||||
| TGWT | rp | - | -0.46* | |||||
| rg | 0.28* | |||||||
| GY | rp | - | ||||||
| rg | ||||||||
rp=phenotypic correlation; rg=Genotypic correlation; *,**significant at 5 and 1% levels of probability, respectively.
Table 3: Correlation coefficients for days to 50% heading (DH), PB, SB, SP, DM, TGW and GY.
Number of secondary branches per panicle (SB)
Rice varieties reflected significant differences (p ≤ 0.01) for SB (Table 1). SB among the varieties ranged between 15 and 47. Least SB (15) was noted for Bas-Pak while highest SB (47) was recorded for Kangni-27 , DR-82 and Swat-1 (Table 2). Phenotypic correlation of SB with SP was significantly positive whereas genotypic correlation of SB was significantly positive with TGW (Table 3).
Number of spikelets per panicle (SP)
Significant difference (p ≤ 0.01) was noticed among the rice varieties for SP (Table 1). Least SP (131) was noted in Bas-Pak while maximum SP (252) observed in DR-82 (Table 2). Phenotypic correlation of SP was significantly positive with PB and SB. SP had significantly positive genotypic correlation with PB, GY and TGW (Table 3).
Days to maturity (DM)
Results from the data analysis revealed highly significant variation at the level of p ≤ 0.01 among the rice varieties for DM (Table 1). Mean data exhibited that the difference for DM among the varieties ranged from 114 to 169 days. JP-5 variety showed least DM (114) whereas, plant of Bas-Pak took highest number of days (169) to get fully matured (Table 2). Significantly positive genotypic correlation for DM with DH had observed (Table 3).
Thousand grain weight (TGW)
Rice varieties showed non-significant differences (p ≥ 0.01) for TGW (Table 1). TGW among the varieties varied from 21.6 and 38.4 g. Least TGW (21.6 g) was observed for Fakhr-e-Malakand while heaviest grains (38.4 g TGW) was produced by variety IR-8 (Table 2). Significantly positive genotypic correlation of TWG was observed with SP, SB and GY (Table 3).
Grain yield (GY)
Significant grain yield difference (p ≤ 0.01) was observed among the rice varieties (Table 1). Mean data revealed that the difference in GY among the varieties ranged from 8148 to 15370 kg ha-1. Bas-2000 and Fakhr-e-Malakand showed lowest GY (8148 kg ha-1) while IR-8 had highest GY (15370 kg ha-1) (Table 2). GY showed significantly positive genotypic correlation with SP and TGW (Table 3). Superior varieties on the bases of yield traits were also depicted through principle component analysis (Figure 1).
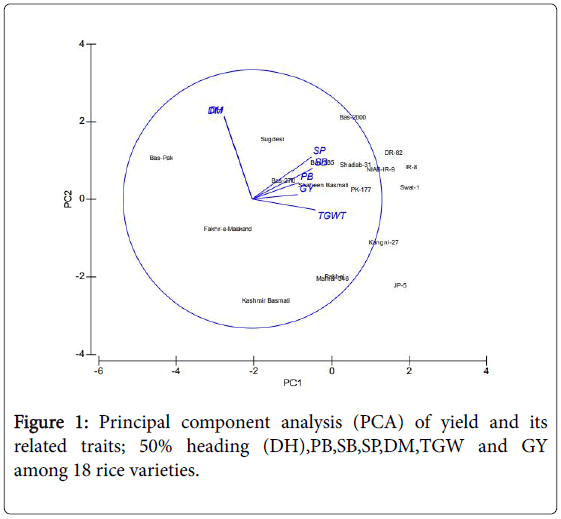
Figure 1: Principal component analysis (PCA) of yield and its related traits; 50% heading (DH),PB,SB,SP,DM,TGW and GY among 18 rice varieties.
Discussion
Yield related traits are significant and fundamental task before making any successful breeding research program. Selection for increased GY should not be based on yield only because of its complexity and relationship with other yield components [13]. Therefore, other yield-related traits should also be taken into consideration. Significant differences among rice varieties were observed for DH (Table 1). This difference for DH in varieties may be resulting from different genetic backgrounds of rice [14], and different genetic makeup could be the possible reason for such differences among varieties. Further, it is also confirmed by phenotypic and genotypic correlations of DH with DM were observed significantly positive (Table 3). The considerable differences between varieties indicate the effect of environment for the expression of the trait [14]. Number of PB and SB exhibited significantly positive phenotypic and genotypic correlation with number of SP, GY and TGW (Table 3). Similar observations were also reported previously, emphasizing that yield can be improved through the production of a good number of panicles per branch, number of PB and SB [6,10,14]. The statistical analysis showed significant differences among the rice varieties for number of SP (Table 1). Minimum number of SP (131) was recorded for Bas-Pak while maximum number of SP (252) was recorded for DR-82 (Table 2). Difference in number of SP depend on growth and development of panicle and the interval of spikelet initiation [10,14]. Phenotypic correlation of number of SP was significantly positive with number of PB and number of SB which was also depicted by Sarawgi et al. [9], stated that varieties having these traits would offer a better option for development and improvement of rice varieties through conventional selection. The number of DM plays a key role in the cropping system. Early maturing crops vacate the land early for the next growing crops and protect the crop from insect pest attack and timely handled. Highly significant variations among the varieties were noted for DM (Table 1). Basmati rice is very low yielding varieties due to tall stature of the plants and late maturity [15] (Table 2). DM had significant positive genotypic correlation with DH (Table 3) which is in consistent with findings of Zafar et al. [16]. Karim study on 41 aromatic rice varieties for genetics and phenotypic parameters and observed, that phenotypic variance for studied parameters was higher than the genotypic variance [17]. Previous study showed that variation for DM was due to genetic component rather than environment. Short duration varieties could be a better source for breeders to use as parental lines. Variations in GW might be due to diverse genetic makeup of rice varieties and their different response to prevalent environment during grain filling stage [6,14,18-20]. TGW had significantly positive genotypic correlation with number of GY, number of SB and number of SP (Table 3). Selection of genotype based on yield linked traits would be effective for increasing grain yield [9,10,21,22]. Mean data depicted variation in grain yield among the varieties which may be due to the difference in response of varieties to environmental conditions or function of genotypes [23].
Conclusion
In the present study 18 rice varieties were analyzed for morphological traits. Data were recorded on yield and related components. Significant genetic variations were observed among the rice varieties for all the studied parameters except TGW. For instance, Swat-1 had maximum PB. Maximum SB was noted for Kangni-27 , DR-82 , and Swat-1 , whereas, highest SP was displayed by DR-82 . JP-5 exhibited least DM. Moreover, maximum TGW and GY were recorded for IR-8 . Swat-1 , Kangni-27 , DR-82 and Fakhr-e-Malakand which was also revealed from PCA. As these varieties excelled in performance for yield and yield components, thus, could be recognized for commercial cultivation in Peshawar valley. Based on these superior traits, the genetic potential of these rice varieties can also be exploited in rice breeding programs.
References
- Pakistan Economic Survey 2014-2015. Ministry of Finance, Government of Pakistan.
- Salim M, Akram M, Akhtar ME, Ashraf M (2003) In: Saleem MT (editor), Rice, A Production handbook. Pakistan Agriculture Research Council Islamabad. p.68.
- Choudhury PR, Kohli S, Srinivasan K, Mohapatra T, Sharma RP (2001) Indentification and classification of aromatic based on DNA fingerprinting. Euphtica 118: 243-251.
- Guei RG, Traore k (2001) New approach to germplasm exchange for sustainable increase of rice biodiversity and production in Africa. International Rice Commission Newsletter 50: 49-58.
- Hansel H (1984) Selection for a complex characteristic by a sub trait (Tables of indirect selection). Proc 10th Cong of Eucarpia Pudoc, Wageningen 61-64.
- Ahmad K, Zafar Y, Arif M (2007) Path analysis of some leaf and panicle traits affecting grain yield in double haploid lines of rice. J Agri Res 45: 245-252.
- Usman MG, Rafii MY, Martini MY, Oladosu Y, Kashiani PM (2016) Genotypic character relationship and phenotypic path coefficient analysis in chili pepper varieties grown under tropical condition. J Sci Food Agri 97: 1164-1171.
- Falconer DS (1960) Introduction to quantitative genetic Oliver and Boyd, Edinburgh. 4: 140-141.
- Sarawgi AK, Rastogi NK, Soni DK (1996) Correlation and path analysis in rice varieties from Madhya Pradesh. Field Crop Res 52: 161-167.
- Prasad B, Patwary AK, Biswas PS (2001) Genetic variability and selection criteria in fine grain rice Pak J Biol Sci 4: 1188-1190.
- Gallais A (1984) Use of indirect selection in plant breeding. Proc 10th Cong of Eucarpia, Pudoc, Wageningen 45-60.
- Steel Torrie (1980) SAS Institute SAS user’s Guide. Statistics. Version 5th ed. SAS Institute, Cary, NC.
- Shrestha S, Asch F, Dusserre J, Ramanantsoanirina A, Brueck H (2012) Climate effects on yield components as affected by genotypic responses to variable environmental conditions in upland rice systems at different altitudes. Field Crop Res 134: 216-228.
- Jamal IH, Khalil AB, Khan S, Zada I (2009) Genetic variation for yield and yield components in rice. J Agri Biol Sci 6: 60-64.
- Rashid M, Cheema AA, Ashraf A, Qamar Z, Mahmood Z (2003) Development of Basmati rice varieties through the use of induced mutations and related techniques. Pak J Bot 35: 811-818.
- Zafar N, Aziz S, Masood S (2004) Phenotypic divergence for agro- morphological traits among landrace varieties of rice (O. sativa L.) from Pakistan. Int J Agri Biol 6: 335-339.
- Karim DU, Sarkar MNA, Siddique MA, Khaleque M, Hasnat MZ (2007) Variability and Genetic Parameter Analysis in Aromatic Rice. Int J Sustain Crop Prod 2: 15-18.
- Safiullah, Hassan SG, Ahmed SQ, Ahmed F (2002) Genotypic performance of rice in Pakhal plains of Mansehra. Sarhad J Agri 18: 51-61.
- Koutroubas SD, Mazzini F, Pons B, Ntranos DA (2004) Grain quality variation and relationships with morpho-physiological traits in rice genetic resources in Europe. Field Crop Res 86: 115-130.
- Cheng S, Zhuang J, Fan Y, Du J, Cao L (2007) Progress in research and development on hybrid rice: A super-domesticate in China. Annals of Botany 100: 959-966.
- Ashura LK (1998) Inter-relationship between yield and some selected agronomic characters in rice. Africa Crop Science Journal 6: 323-328.
- Salam AK, Imarn M, Ashfaq M (2009) Estimation of genetic variability and correlation for grain yield components in rice. American-Eurasian J Agri Env Sci 6: 585-590.
- Hamam KA, Abdel-Sabour, Khaled GA (2009). Stability of wheat genotypes under different environments and their evaluation under sowing dates and nitrogen fertilizer levels. Australian J Basic Appl Sci 3: 206-217.
Citation: Jabeen Z, Irshad F, Shah SMA, Hussain N (2018) Genotypic Evaluation of Different Rice Varieties for Yield and Yield Related Traits. J Rice Res 6: 199. DOI: 10.4172/2375-4338.1000199
Copyright: © 2018 Jabeen Z, et al. This is an open-access article distributed under the terms of the Creative Commons Attribution License, which permits unrestricted use, distribution, and reproduction in any medium, provided the original author and source are credited.
Share This Article
Recommended Journals
Open Access Journals
Article Tools
Article Usage
- Total views: 4829
- [From(publication date): 0-2018 - Mar 31, 2025]
- Breakdown by view type
- HTML page views: 3901
- PDF downloads: 928