Genotype x Environment Interactions for Seed Yield and Physiological Traits in Sesame (Sesamum indicum L.) for Food Security under Climate Resilience
Received: 29-Jul-2022 / Manuscript No. JPGB-22-70744 / Editor assigned: 01-Aug-2022 / PreQC No. JPGB-22-70744 (PQ) / Reviewed: 15-Aug-2022 / QC No. JPGB-22-70744 / Revised: 07-Jan-2023 / Manuscript No. JPGB-22-70744 (R) / Published Date: 17-Jan-2023
Abstract
Study of genotype x environment interaction of ten parents along with their 45 F1 progenies were evaluated in a randomized block design with three replications during summer kharif 2020-2021 under three different environmental conditions viz., normal, late and extreme late sowing for yield and its attributes. The stability analysis for yield and yield attributes was carried out as per model of Eberhart and Russell for knowing causes of stability. Genotype x environment interaction was significant for all the traits under study. On basis of stability analysis, parents TKG-22, GT-10 and RT-351 and crosses TKG-22 x GT-10, RT-372 x RT-103, TC-25 x RT-46, TC-25 x RT-46, RT-103 x GT-10 exhibited stable performance for seed yield per plant in different environmental conditions. On the other hand, crosses RT-346 x TKG-22, RT-346 x RT-351, TKG-22 x RT-372, TKG-22 x TC-25 and RT-372 x RT-351 indicated its suitability and stability under better environmental conditions. These crosses could be utilized as a promising breeding material for the development of new set of sesame varieties.
Keywords
Genotype x environment; Progenies; Stability; Traits
Introduction
Sesame (Sesamum indicum L.), is a self-pollinated crop. The chromosome number of the cultivated diploid species (S. indicum) is 2n=26. It is the oldest cultivated oilseed crop among oilseed crops of India, belonging to the order Tubiflorae and family Pedaliaceae. Sesame is seventh ranked oilseed crop after soybean, rap seed, cotton seed, sunflower and groundnut. Several historical records indicated that sesame crop probably originated from Ethiopia (Africa) and from there, it has been introduced into different parts of world like India, China and became a well-liked food in South Europe, North-East Africa and Southern Asia. Sesame seed has high oil and protein content which ranges from 40% to 60% and 16.7% to 27.3%, respectively. In India, sesame seeds are mainly used for extraction of edible oil but it is also utilized in manufacturing hydrogenated oils, detergents and surface active agents. Its oil contains an element referred to as sesamol, which is a phenolic compound, thus oil can be stored for a long time. Seed protein is high in quality with good quantity of essential amino acids; especially methionine is deal with rejuvenative and anti-aging for human body. The total cultivated area across the world under sesame during 2019-20 was 7784 thousand hectares with the production of 3150 thousand metric tonnes and productivity level of 535 kg per hectare. India is the world leader with the largest area (1622.60 thousand hectare), production (657.50 thousand metric tonnes) and productivity (405 kg/ha). The genetic control of characters associated with seed yield basically is important in any systematic crop improvement programme. For developing a robust breeding strategy to identify such high yielding varieties, it is essential to assess the nature of inheritance of the desirable traits and therefore, potentiality of the parents in hybrid combinations [1]. Furthermore, because of the genotype x environment interaction, the information obtained under one environment and/or with one set of genetic material might not be applicable to another environment because the estimates derived from one environment are also biased and would not present a real picture of genetic nature and therefore, the breeding value of population. The phenotypic performance of a genotype is influenced by its genetic constituents, environments and their interactions. The detection of significant genotype x environment interaction indicates that all phenotypic responses to changes in the environment are not the same for all genotypes.
This may mean that the best genotype in one environment is not the best in another environment [2]. Stability analysis helps in understanding the adaptability of advance lines over a wide range of environmental conditions and in the identification of adaptable genotypes.
An estimation of the G x E interaction in crop breeding programme is of paramount importance for the identification of genotypes with wider adaptability. In the present investigation, the most widely adopted statistical model for stability analysis as suggested by Eberhart and Russell was used to assess the G x E interactions and draw valid conclusions regarding the stability of sesame genotypes (parents and hybrids) for seed yield and yield contributing attributes. Environment plays an important role in the phenotypic expression of a character. A genotype is implicit to indicate a differential phenotypic response in development when introduced in different environments. The genotype x environment (G x E) interaction is especially important in the expression of quantitative characters, which are controlled by many genes (minor) and are greatly modified by the environmental influences. Knowledge of the nature and relative magnitude of the various types of G x E interaction is helpful in making decisions concerning breeding methods, selection programmes and testing procedures in crop plants. Eberhart and Russell emphasized the requirement of considering both linear (bi=regression coefficient) and non-linear (S2di=deviation from regression) components of G x E interaction in judging the phenotypic stability of a variety. The study of G x E interactions leads to meaningful evaluation of individual genotype for seed yield and its components, which might be used in future breeding programme [3].
Materials And Methods
The experimental material consisting of ten parents and forty five F1’s were planted during kharif 2020-2021. All the genotypes were sown under three different environments namely; normal, late and extreme late environment. The experiment was laid down in randomized block design with three replications in all the environments. The plot for non-segregating generations (parents and F1’s) represented two rows each. Rows were planted in 3 m length spaced at 30 cm apart and 15 cm interplant distance under all the environments. Non-experimental rows were planted all around the experimental material to avoid any possible border effects [4]. Sowing was done by hand drilling of the seeds in the soil. All other agricultural practices were done according to the recommendation and package of practices implemented at optimum period to establish good crop population in the field (Table 1).
| Environment | Date of sowing |
|---|---|
| E1 (normal sowing) | July 04, 2020 |
| E2 (late sowing) | July 21, 2020 |
| E3 (very late sowing) | August 05, 2020 |
Table 1: Details of environments.
Data were recorded on ten randomly taken plants in parents and F1’s for the study of the characters mentioned below from each replication in three environmental conditions. The plants were tagged. Observations on all the characters were recorded on randomly taken plants of each genotype under each environment avoiding border plants. Among the characters, days to 50% flowering, days to maturity and 1000 seed weight were collected on plot basis. Mean values of selected plants were used for statistical analysis [5].
The statistical analysis for genotype x environment interaction and phenotypic stability was carried out according to Eberhart and Russell for grain yield and its components [6].
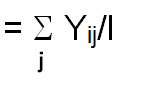
According to Eberhart and Russell, the mean performance of the ith genotype in jth environment, Yij is defined as
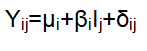
Where,
Yij=Phenotypic expression of a particular genotype (i) in specific environment (j)
Where i=1, 2, . . . . . , g genotypes
j=1, 2, . . . . . , e environments
μi=Mean of the ith genotype over all environments
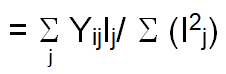
βi=Regression coefficient that measures the linear response of the ith genotype to varying environments
Ij=Environment index obtained as the mean of all the genotypes at the jth environment minus the grand mean i.e.
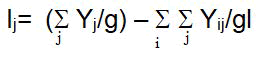
Where, Σ Ij=0.
δij=Deviation from regression of the ith genotype at the jth environment
The model provides means of partitioning the genotype x environment interactions into two parts.
• The variation due to the response of the ith genotype to varying environmental indices sum of squares due to regression.
• The deviation from the linear regression.
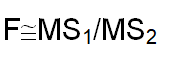
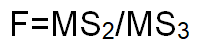
The analysis of variance for Eberhart and Russel model is given in Table 3. Error variances were assumed to be homogenous for all the genotypes over environment and thus do not influence the ranking of varieties or various stability parameters. For the F test, the mean square due to pooled deviation (MS3) was first tested against pooled error (Table 2). The appropriate F test for testing the significance of difference among genotypic means was obtained as
| Source | Df | SS | MS | |
|---|---|---|---|---|
| Genotypes | (g-1) | 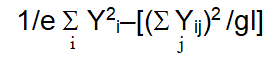 |
MS1 | |
| Env.+(Genotypes x Env.) | g (l - 1) |  |
||
| Environments (linear) | 1 | 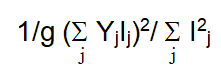 |
||
| G x E (linear) | (g-1) | 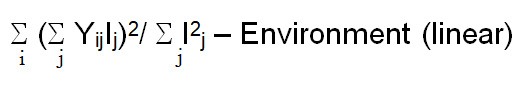 |
MS2 | |
| Pooled deviation | g(l-2) |  |
MS3 | |
| For individual genotypes | ||||
| Genotype 1 • • • • |
(l-2) | 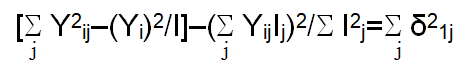 |
||
| Genotype g | (l-2) | 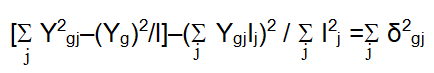 |
||
| Pooled error | l (g-1)(r-1) |  |
MS4 | |
Table 2: Analysis of variance for G x E interaction as per Eberhart and Russel (1966) model.
r, l and g represent number of replications, environments and genotypes, respectively.
The term S2e represent mean square due to pooled error such that,

Where,
σ2j=Error sum of square at jth environment (j=1, 2...l) r=Number of replications within each environment g=Number of genotypes
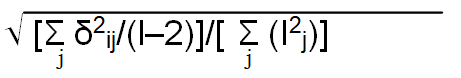
The hypothesis that there is no genetic difference among genotypes for the regression of their means on environment indices can also be tested approximately by F test.
H0=B1=B2= . . . . . = Bg can be tested by
The following stability parameters were calculated for each genotype as under:
Mean (x̄): The mean value of Ith genotype over all environments
Regression coefficient (b)=Regression of Yij on Ij
Where,
Ij=Environment index
= x̄.j-x̄.. Such that ΣIj=0
Where,
x̄j =Environmental mean

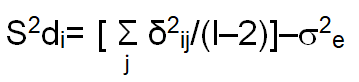
Deviation from regression (S2di):
The appropriate test for the mean squares due to individual bi values was obtained as:
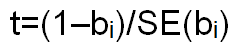
This value is compared with table‘t’ value at g (I-2) degrees of freedom for testing significance at 5 and 1% levels, respectively
Where, SE(bi)=Standard error of bi
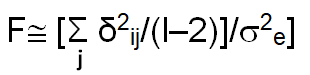
The appropriate test of significance for deviation from regression of each genotype was provided by the following formula.
Results
The nature of G x E (Genotypes x Environment) interactions were studied as per model proposed by Eberhart and Russell. Pooled analysis of variance for phenotypic stability of yield, its attributes and oil content is indicated in Table 3. The mean sum of squares due to genotypes and due to environment was significant for all the characters. This indicated that sufficient variability was present among genotypes included and environments were also variable for the traits studied. The significant mean sum of square due to genotype x environment were obtained for all the characters [7]. This indicated the influence of environmental conditions on the genotypes evaluated. The interaction of environment plus genotype x environment were significant for all the characters.
| Source of variation | df | Characters | ||||||||||
|---|---|---|---|---|---|---|---|---|---|---|---|---|
| Days to 50% flowering | Days to maturity | Plant height (cm) | Branches per plant | Capsules per plant | Capsule length (cm) | Seeds per capsule | 1000-seed weight (g) | Capsule girth (cm) | Seed yield per plant (g) | Oil content (%) | ||
| Genotypes (G) | 54 | 6.82 | 14.89 | 597.72 | 0.53 | 192.81 | 0.05 | 75.55 | 0.08 | 0.04 | 2.12 | 14.47 |
| Environment (E) | 2 | 603.70 | 1951.27 | 71229.4 | 70.66 | 18560.78 | 5.67 | 15098.81 | 9.22 | 15.9 | 273.24 | 393.12 |
| G x E | 108 | 2.37 | 2.73 | 157.79 | 0.17 | 62.38 | 0.02 | 24.54 | 0.04 | 0.01 | 0.66 | 3.74 |
| E (G x E) | 110 | 13.30 | 38.16 | 1450.00 | 1.45 | 398.72 | 0.12 | 298.61 | 0.20 | 0.30 | 5.62 | 10.82 |
| E (linear) | 1 | 1207.40 | 3902.55 | 142458.79 | 141.32 | 37121.56 | 11.34 | 30197.62 | 18.43 | 31.80 | 546.47 | 786.23 |
| G x E (linear) | 54 | 2.73 | 3.3 | 180.78 | 0.11 | 59.02 | 0.02 | 19.19 | 0.02 | 0.01 | 0.87 | 3.46 |
| Pooled deviation | 55 | 1.97 | 2.13 | 132.36 | 0.23 | 64.55 | 0.02 | 29.34 | 0.05 | 0.02 | 0.44 | 3.94 |
| Pooled Error | 324 | 0.5 | 0.88 | 27.33 | 0.02 | 6.15 | 0.02 | 2.78 | 0.01 | 0.01 | 0.06 | 1.05 |
Table 3: Pooled analysis of variance showing mean squares for stability performance (Eberhart and Russel (1966) model) for yield and its contributing attributes.
The G x E interaction was partitioned into linear and non-linear components. The mean sum of square due to environment (linear) was significant for all the characters, showed that macro environmental differences were present in all the three environments studied. The mean sum of square due to G x E (linear) for all the characters were also significant, this showed the variation in the performance of genotypes [8]. The variation among genotypes was due to regression of genotypes on environments and hence predictable in nature. The mean sum of square due to pooled deviation (non-linear) were significant for all the attributes, this showed the role of unpredictable cause affecting stability. However, the magnitude of pooled deviation was higher for all the characters [9].
According to the measure of stability parameters, the model given by Eberhart and Russell was used for analysis of G x E interactions. It studied both linear (bi) and nonlinear (S2di) components of G x E interaction for predication of performance of individual genotypes (parental line/crosses). The stability parameters, such as mean performance along with regression coefficient (bi) and deviation from regression (S2di) of all the genotypes for different characters were calculated to assess the stability and suitable performance of genotypes among environments. According to this model, a stable genotype is one whose regression coefficient (bi) equals to unity and deviation from regression (S2di) is zero [10]. High value of regression coefficient indicates more responsive genotypes and this is recommended for favorable environments. The value of regression coefficient equals to unity indicates wider adaptability and regression coefficient less than unity indicated that the genotype is preferred for poor environmental conditions. If deviation from regression (S2di) is significantly deviating from zero it will not validate the linear predication and non-significant deviation from regression (S2di) indicates that the performance of genotypes for given environment is predictable [11].
The parents RT-351 for days to 50% flowering and TKG-22 for days to maturity exhibited mean lower than general mean but regression coefficient was equal to unity referred to average stability. The parents PRAGATI for days to 50% flowering and RT-351 for days to maturity exhibited higher mean compared to general mean and regression coefficient was lower than unity this indicated above average stability thus suited for poor environmental conditions [12]. RT-125 and RT-103 for days to 50% flowering and PRAGATI for days to maturity exhibited higher mean compared to general mean and regression coefficient was higher than unity this indicated below average stability thus suited for specific environmental conditions. RT-346, RT-372, RT-125, RT-103 and GT-10 which indicated higher mean yield than general mean and showed that the regression coefficient was equal to unity, this considered average stability. Therefore, these genotypes were most stable and desirable parents for days to maturity (Table 4).
| Parents/cross | Days to 50% flowering | Days to maturity | Plant height (cm) | ||||||
|---|---|---|---|---|---|---|---|---|---|
| Mean | bi | S2di | Mean | bi | S2di | Mean | bi | S2di | |
| Parents | |||||||||
| RT-346 | 42.44 | 1.29 | 7.82 | 81.78 | 1.05 | 1.19 | 85.62 | 0.80 | 168.23 |
| TKG-22 | 42.67 | 1.05 | -0.13 | 77.22 | 1.09 | -1.10 | 107.76 | 1.05 | 50.23 |
| RT-372 | 41.11 | 1.05 | 0.19 | 79.00 | 0.95 | -0.05 | 113.44 | 1.18 | -21.68 |
| TC-25 | 43.89 | 1.12 | 11.27 | 82.22 | 0.91 | 2.93 | 100.80 | 0.81 | 166.47 |
| PRAGATI | 42.44 | 0.71 | 1.16 | 81.56 | 1.40 | 0.41 | 89.98 | 0.91 | -32.84 |
| RT-46 | 42.56 | 1.06 | 1.49 | 83.00 | 1.15 | 9.89 | 84.24 | 0.64 | 63.38 |
| RT-125 | 43.33 | 1.66 | -0.39 | 82.00 | 1.05 | 2.49 | 87.38 | 0.67 | 254.72 |
| RT-103 | 42.78 | 1.21 | -0.46 | 81.33 | 1.12 | 0.90 | 99.38 | 1.02 | 72.23 |
| GT-10 | 41.11 | 0.86 | 2.38 | 79.00 | 0.97 | -0.81 | 97.07 | 0.68 | 95.59 |
| RT-351 | 40.67 | 1.00 | 0.40 | 79.00 | 0.68 | -0.87 | 107.76 | 1.01 | 16.39 |
| Crosses | |||||||||
| RT-346 x TKG-22 | 38.56 | 1.30 | 0.12 | 74.22 | 0.99 | 1.55 | 128.67 | 1.03 | 86.22 |
| RT-346 x RT-372 | 39.78 | 0.61 | -0.32 | 77.67 | 0.97 | -0.81 | 112.30 | 0.65 | -19.24 |
| RT-346 x TC-25 | 44.11 | 1.72 | 0.74 | 77.78 | 1.13 | -0.59 | 99.64 | 1.09 | -21.72 |
| RT-346 x PRAGATI | 42.00 | 1.61 | 0.03 | 79.33 | 1.26 | 4.21 | 107.91 | 0.75 | 1.79 |
| RT-346 x RT-46 | 42.00 | 1.00 | 0.40 | 78.78 | 1.10 | 1.10 | 95.04 | 0.76 | 9.84 |
| RT-346 x RT-125 | 41.78 | 0.80 | -0.30 | 78.33 | 0.73 | 2.08 | 98.59 | 0.90 | 142.51 |
| RT-346 x RT-103 | 41.22 | 0.82 | 6.39 | 81.11 | 0.55 | 5.27 | 126.06 | 1.53 | 142.51 |
| RT-346 x GT-10 | 41.22 | 0.77 | 4.40 | 75.11 | 0.76 | -0.58 | 132.19 | 1.02 | 10.22 |
| RT-346 x RT-351 | 40.78 | 1.26 | 0.22 | 78.11 | 0.97 | 10.80 | 125.40 | 1.07 | 379.17 |
| TKG-22 x RT-372 | 37.78 | 0.85 | 0.13 | 74.11 | 1.57 | 0.46 | 145.22 | 1.49 | 2.53 |
| TKG-22 x TC-25 | 42.44 | 1.31 | 1.10 | 76.89 | 0.61 | -0.25 | 113.7 | 0.39 | 361.61 |
| TKG-22 x PRAGATI | 40.56 | 0.56 | 1.57 | 77.22 | 0.59 | -0.68 | 99.20 | 1.01 | -26.30 |
| TKG-22 x RT-46 | 41.44 | 1.25 | 0.28 | 76.67 | 0.86 | 0.32 | 113.01 | 0.93 | 417.79 |
| TKG-22 x RT-125 | 40.67 | 1.31 | -0.01 | 78 | 0.97 | -0.81 | 101.08 | 1.04 | 67.03 |
| TKG-22 x RT-103 | 41.11 | 1.52 | 0.78 | 79.67 | 0.86 | 0.32 | 108.1 | 1.08 | -13.91 |
| TKG-22 x GT-10 | 36.89 | 0.76 | 1.53 | 74.67 | 1.52 | 1.58 | 132.22 | 0.9 | 132.78 |
| TKG-22 x RT-351 | 38.22 | 0.26 | 1.65 | 74.78 | 1.53 | 0.12 | 124.99 | 0.76 | 688.11 |
| RT-372 x TC-25 | 40.56 | 1.96 | -0.34 | 76.78 | 0.87 | 2.48 | 120.13 | 0.98 | 222.90 |
| RT-372 x PRAGATI | 39.56 | 0.56 | -0.15 | 78.67 | 0.99 | -0.3 | 97.31 | 0.85 | 258.47 |
| RT-372 x RT-46 | 39.78 | 0.50 | 0.78 | 77.33 | 0.86 | 0.32 | 97.04 | 1.03 | -36.06 |
| RT-372 x RT-125 | 41.00 | 0.29 | 2.30 | 78.22 | 0.98 | -1.01 | 105.89 | 1 | -26.74 |
| RT-372 x RT-103 | 42.44 | 1.31 | -0.34 | 77 | 1.09 | 11.00 | 104.42 | 0.95 | -37.52 |
| RT-372 x GT-10 | 37.56 | 0.81 | 0.5 | 72.11 | 0.83 | 0.3 | 115.42 | 0.53 | -17.62 |
| RT-372 x RT-351 | 37.78 | 0.91 | -0.34 | 72.56 | 0.89 | -1.16 | 128.5 | 0.95 | 235.03 |
| TC-25 x PRAGATI | 41 | 0.85 | 1.22 | 76.78 | 1.1 | 6.61 | 86.78 | 0.54 | 73.67 |
| TC-25 x RT-46 | 40.78 | 1.26 | -0.56 | 79.11 | 0.71 | 4.08 | 121.87 | 1.34 | 55.34 |
| TC-25 x RT-125 | 42 | 1.15 | -0.09 | 77.11 | 0.78 | -0.16 | 115.24 | 1.24 | 21.79 |
| TC-25 x RT-103 | 41.33 | 1.11 | -0.57 | 77.78 | 1.15 | -0.03 | 93.40 | 0.90 | 712.81 |
| TC-25 x GT-10 | 40.00 | 1.32 | 4.81 | 77.11 | 0.92 | 3.17 | 113.40 | 0.69 | -11.58 |
| TC-25 x RT-351 | 39.33 | 1.26 | -0.45 | 76.22 | 0.92 | 0.05 | 116.22 | 0.57 | 215.57 |
| PRAGATI x RT-46 | 41.00 | 0.95 | -0.16 | 78.33 | 1.10 | -0.53 | 99.71 | 1.07 | 358.69 |
| PRAGATI x RT-125 | 40.33 | 0.6 | 2.33 | 77.22 | 0.71 | 4.54 | 112.56 | 1.1 | -12.86 |
| PRAGATI x RT-103 | 40.33 | 0.91 | -0.58 | 78.11 | 1.13 | -0.59 | 120.09 | 1.25 | 14.91 |
| PRAGATI x GT-10 | 41.89 | 0.95 | 2.95 | 77.89 | 1.14 | 0.89 | 108.22 | 1.14 | -10.31 |
| PRAGATI x RT-351 | 39.67 | 0.66 | -0.44 | 78.11 | 1.15 | -0.98 | 120.29 | 1.31 | 10.48 |
| RT-46 x RT-125 | 41.22 | 0.85 | 0.60 | 78.00 | 1.10 | -0.53 | 103.89 | 1.05 | -20.95 |
| RT-46 x RT-103 | 41.22 | 0.71 | 0.51 | 78.00 | 0.92 | 0.65 | 90.91 | 0.92 | 391.9 |
| RT-46 x GT-10 | 41.33 | 1.36 | -0.30 | 78.00 | 1.02 | 1.37 | 108.47 | 1.04 | -14.73 |
| RT-46 x RT-351 | 41.11 | 0.65 | -0.43 | 78.22 | 0.96 | -0.46 | 107.87 | 1.15 | 10.21 |
| RT-125 x RT-103 | 40.33 | 0.80 | 0.33 | 77.33 | 0.88 | 1.37 | 98.00 | 1.12 | -4.09 |
| RT-125 x GT-10 | 41.22 | 1.30 | 1.79 | 78.33 | 1.15 | 0.01 | 112.69 | 1.44 | -31.44 |
| RT-125 x RT-351 | 41.00 | 0.60 | 0.27 | 78.56 | 1.07 | -0.7 | 122.24 | 1.37 | 69.48 |
| RT-103 x GT-10 | 41.78 | 1.10 | 0.98 | 78.22 | 1.12 | -0.41 | 124.76 | 1.42 | 59.90 |
| RT-103 x RT-351 | 41.89 | 0.75 | -0.39 | 78.44 | 0.97 | -0.28 | 125.60 | 1.51 | 114.08 |
| GT-10 x RT-351 | 40.33 | 0.78 | 24.37 | 74.33 | 1.15 | 0.01 | 138.89 | 1.37 | -18.53 |
| General mean | 40.93 | 1.00 | 1.47 | 77.86 | 1.00 | 1.25 | 109.94 | 1.00 | 105.03 |
| S.E. (bi) | 0.70 | 0.24 | 0.94 | 0.15 | 5.23 | 0.19 | |||
Table 4: Estimates of stability parameters for days to 50% flowering, days to maturity and plant height.
The crosses RT-346 x TKG-22, RT-346 x RT-351, TKG-22 v RT-125, RT-372 x TC-25, TC-25 x RT-46 and TC-25 x RT-351 for days to 50% flowering and The crosses RT-346 x TC-25, TKG-22 x RT-372, TKG-22 x GT-10, TKG-22 x RT-351, TC-25 x RT-103 and GT-10 x RT-351 for days to maturity had lower mean performance than general mean, regression coefficient more than unity so these exhibited below average stability and suitable for better environmental conditions. The crosses TKG-22 x RT-372, RT-372 x GT-10, RT-372 x RT-351, PRAGATI x RT-103 and RT-125 x RT-103 for days to 50% flowering and RT-346 x TKG-22, RT-346 x RT-372, TKG-22 x RT-46, RT-372 x TC-25, RT-372 x RT-46, RT-372 x GT-10, RT-372 x RT-351, TC-25 x RT-351 and RT-125 x RT-103 had lower mean compared to general mean, regression coefficient was equal to unity indicated average stability and thus considered to be most stable and desirable crosses for these traits. The crosses RT-346 x RT-372, RT-372 x PRAGATI, RT-372 x RT-46, PRAGATI x RT-351, RT-125 x RT-351 and RT-103 x RT-351 days to 50% flowering and RT-346 x GT-10, TKG-22 x TC-25, TKG-22 x PRAGATI and TC-25 x RT-125 had lower mean compared to general mean, regression coefficient was below to unity indicated above to average stability and thus considered to suitable for poor environmental conditions [13].
The parent TKG-22, PRAGATI, RT-103, RT-351 for plant height and RT-346, RT-372, RT-46 and RT-351 branches per plant exhibited mean lower than general mean but regression coefficient was equal to unity referred to average stability. RT-46 exhibited lower mean compared to general mean and regression coefficient was lower than unity this indicated above average stability thus suited for poor environmental conditions for plant height. RT-103 exhibited higher mean compared to general mean and regression coefficient was higher than unity this indicated below average stability thus suited for specific environmental conditions branches per plant [14].
The crosses RT-346 x GT-10 and PRAGATI x RT-125 for plant height and 346 x GT-10, TKG-22 x RT-372, TKG-22 x RT-46, RT-125 x GT-10, RT-103 x RT-351 and GT-10 x RT-351 for branches per plant had higher mean compared to general mean, regression coefficient was equal to unity indicated average stability and thus considered to be most stable and desirable crosses for plant height. TKG-22 x RT-372, TC-25 x RT-46, TC-25 x RT-125, PRAGATI x RT-103, PRAGATI x RT-351, RT-125 x GT-10, RT-125 x RT-351, RT-103 x GT-10 and GT-10 x RT-351 for plant height and RT-346 x RT-372, RT-346 x RT-351, RT-372 x RT-351, TC-25 x RT-351 and RT-125 x RT-351 for branches per plant had higher mean performance than general mean, regression coefficient more than unity so these exhibited below average stability and suitable for better environmental conditions. The crosses RT-346 x RT-372, RT-372 x GT-10 and TC-25 x GT-10 for plant height and RT-46 x GT-10 for branches pr plant had higher mean compared to general mean, regression coefficient was below to unity indicated above to average stability and thus considered to be suitable for poor environmental conditions (Table 5).
| Parents/cross | Branches per plant | Capsules per plant | Capsule length (cm) | ||||||
|---|---|---|---|---|---|---|---|---|---|
| Mean | bi | S2di | Mean | bi | S2di | Mean | bi | S2di | |
| Parents | |||||||||
| RT-346 | 3.04 | 0.88 | -0.01 | 37.09 | 0.70 | 2.45 | 2.39 | 1.12 | 0.05 |
| TKG-22 | 3.60 | 1.11 | 0.09 | 53.07 | 1.04 | 15.28 | 2.42 | 0.73 | 0.01 |
| RT-372 | 3.46 | 0.94 | 0.03 | 46.89 | 1.07 | 43.80 | 2.53 | 0.78 | 0.01 |
| TC-25 | 3.43 | 1.04 | 0.35 | 43.07 | 0.63 | 34.17 | 2.39 | 0.92 | 0.01 |
| PRAGATI | 2.76 | 0.50 | 0.21 | 44.72 | 0.55 | 252.58 | 2.38 | 0.63 | 0.01 |
| RT-46 | 2.97 | 0.78 | -0.01 | 39.11 | 0.72 | -3.24 | 2.21 | 0.48 | -0.01 |
| RT-125 | 3.46 | 0.60 | 0.16 | 44.91 | 0.74 | 64.91 | 2.51 | 1.07 | -0.01 |
| RT-103 | 3.54 | 1.29 | -0.03 | 44.78 | 0.86 | 72.46 | 2.49 | 0.92 | 0.01 |
| GT-10 | 3.41 | 0.94 | 0.09 | 50.04 | 0.85 | 14.95 | 2.41 | 0.34 | 0.01 |
| RT-351 | 3.23 | 0.95 | 0.03 | 50.56 | 0.82 | 4.61 | 2.39 | 0.73 | 0.02 |
| Crosses | |||||||||
| RT-346 x TKG-22 | 4.16 | 1.19 | 0.15 | 63.31 | 1.56 | 10.26 | 2.78 | 1.21 | 0.03 |
| RT-346 x RT-372 | 3.89 | 1.22 | -0.01 | 57.02 | 1.52 | -8.68 | 2.78 | 0.63 | 0.01 |
| RT-346 x TC-25 | 3.46 | 1.18 | 0.01 | 46.93 | 0.85 | 94.18 | 2.51 | 1.12 | 0.01 |
| RT-346 x PRAGATI | 2.93 | 0.48 | 0.14 | 46.60 | 0.89 | 198.27 | 2.56 | 0.82 | 0.01 |
| RT-346 x RT-46 | 2.82 | 0.64 | 0.11 | 41.22 | 1.07 | -3.01 | 2.58 | 1.26 | -0.01 |
| RT-346 x RT-125 | 3.07 | 0.94 | -0.01 | 46.89 | 1.23 | 72.01 | 2.54 | 1.16 | 0.01 |
| RT-346 x RT-103 | 3.33 | 0.96 | 0.55 | 52.69 | 1.15 | 12.18 | 2.62 | 0.87 | -0.01 |
| RT-346 x GT-10 | 4.18 | 1.15 | 0.02 | 61.76 | 1.49 | 70.76 | 2.85 | 0.92 | 0.02 |
| RT-346 x RT-351 | 3.89 | 1.16 | -0.04 | 62.27 | 0.99 | 4.03 | 2.76 | 1.21 | 0.02 |
| TKG-22 x RT-372 | 4.26 | 1.09 | 0.06 | 72.22 | 1.49 | -2.46 | 2.83 | 1.26 | -0.01 |
| TKG-22 x TC-25 | 3.34 | 0.88 | 0.75 | 48.47 | 1.13 | 190.78 | 2.40 | 0.87 | 0.04 |
| TKG-22 x PRAGATI | 3.13 | 1.22 | 0.69 | 49.08 | 1.3 | 119.88 | 2.50 | 1.36 | 0.09 |
| TKG-22 x RT-46 | 3.63 | 0.95 | 0.02 | 54.48 | 0.99 | 57.43 | 2.57 | 0.15 | 0.02 |
| TKG-22 x RT-125 | 2.96 | 0.94 | 0.08 | 48.36 | 1.08 | -6.94 | 2.57 | 1.07 | 0.01 |
| TKG-22 x RT-103 | 3.18 | 0.81 | 0.67 | 51.71 | 1.56 | 57.64 | 2.60 | 1.26 | -0.01 |
| TKG-22 x GT-10 | 4.20 | 0.92 | 0.34 | 68.96 | 1.37 | 70.77 | 2.73 | 0.87 | 0.01 |
| TKG-22 x RT-351 | 4.08 | 0.96 | 0.23 | 66.04 | 1.22 | 25.42 | 2.72 | 0.92 | 0.01 |
| RT-372 x TC-25 | 3.74 | 1.26 | 0.49 | 45.73 | 0.63 | 46.5 | 2.57 | 1.12 | -0.01 |
| RT-372 x PRAGATI | 3.38 | 1.23 | 0.40 | 49.82 | 0.92 | 1.42 | 2.47 | 1.02 | 0.03 |
| RT-372 x RT-46 | 3.06 | 0.78 | 0.33 | 47.49 | 0.72 | 42.57 | 2.5 | 1.21 | 0.04 |
| RT-372 x RT-125 | 3.23 | 0.99 | 1.01 | 49.44 | 1.03 | -8.06 | 2.43 | 0.73 | 0.01 |
| RT-372 x RT-103 | 3.77 | 1.3 | 0.68 | 47.53 | 0.97 | -0.73 | 2.63 | 1.31 | 0.01 |
| RT-372 x GT-10 | 4.4 | 1.09 | 0.08 | 66.56 | 1.21 | 70.25 | 2.79 | 1.07 | 0.01 |
| RT-372 x RT-351 | 4.23 | 1.20 | -0.03 | 65.51 | 1.11 | 80.70 | 2.74 | 1.55 | 0.01 |
| TC-25 x PRAGATI | 3.23 | 0.89 | 0.43 | 40.08 | 0.72 | 58.94 | 2.51 | 0.92 | 0.01 |
| TC-25 x RT-46 | 3.13 | 0.75 | 0.03 | 53.57 | 1.32 | 7.78 | 2.67 | 1.36 | 0.01 |
| TC-25 x RT-125 | 4.1 | 0.78 | 0.23 | 41.13 | 0.39 | 302.16 | 2.48 | 1.6 | -0.02 |
| TC-25 x RT-103 | 3.26 | 0.61 | 0.15 | 46.27 | 1.06 | 98.67 | 2.4 | 0.82 | 0.04 |
| TC-25 x GT-10 | 3.80 | 0.92 | 0.14 | 48.22 | 0.68 | 156.8 | 2.57 | 0.97 | 0.04 |
| TC-25 x RT-351 | 3.72 | 1.18 | 0.04 | 43.36 | 0.67 | -7.10 | 2.60 | 0.92 | 0.05 |
| PRAGATI x RT-46 | 3.13 | 1.03 | 0.07 | 47.38 | 0.89 | -3.99 | 2.47 | 1.02 | 0.01 |
| PRAGATI x RT-125 | 3.34 | 1.08 | 0.17 | 40.80 | 0.42 | 13.96 | 2.57 | 1.21 | 0.01 |
| PRAGATI x RT-103 | 3.24 | 0.91 | 0.20 | 51.31 | 0.79 | -8.01 | 2.52 | 1.07 | 0.01 |
| PRAGATI x GT-10 | 3.57 | 1.03 | 0.36 | 49.71 | 1.24 | 57.62 | 2.58 | 0.87 | 0.05 |
| PRAGATI x RT-351 | 3.41 | 1.10 | 0.07 | 49.89 | 1.07 | 0.54 | 2.65 | 0.58 | 0.01 |
| RT-46 x RT-125 | 3.19 | 1.22 | 0.32 | 52.64 | 1.42 | 74.61 | 2.61 | 1.31 | 0.01 |
| RT-46 x RT-103 | 3.08 | 1.27 | 0.48 | 49.62 | 0.67 | 278.03 | 2.68 | 1.12 | 0.01 |
| RT-46 x GT-10 | 3.59 | 0.79 | 0.01 | 54.62 | 1.38 | 11.93 | 2.50 | 1.07 | -0.01 |
| RT-46 x RT-351 | 3.43 | 1.07 | 0.21 | 52.89 | 1.12 | 360.45 | 2.60 | 0.68 | 0.01 |
| RT-125 x RT-103 | 3.24 | 1.34 | 0.67 | 39.11 | 0.73 | 8.19 | 2.61 | 0.58 | 0.01 |
| RT-125 x GT-10 | 3.91 | 0.80 | 0.06 | 53.96 | 0.73 | -2.14 | 2.61 | 1.60 | 0.01 |
| RT-125 x RT-351 | 4.09 | 1.25 | -0.01 | 50.69 | 1.07 | -3.28 | 2.66 | 1.60 | 0.01 |
| RT-103 x GT-10 | 3.48 | 1.12 | 0.03 | 51.46 | 1.19 | 1.87 | 2.53 | 0.97 | 0.01 |
| RT-103 x RT-351 | 3.61 | 1.1 | 0.07 | 47.24 | 0.68 | 88.72 | 2.58 | 1.07 | -0.01 |
| GT-10 x RT-351 | 4.28 | 1.15 | 0.06 | 65.18 | 1.27 | 19.37 | 2.58 | 0.73 | 0.11 |
| General mean | 3.51 | 1.00 | 0.21 | 50.79 | 1.00 | 58.40 | 2.57 | 1.00 | 0.02 |
| S.E. (bi) | 0.15 | 0.26 | 2.48 | 0.25 | 0.06 | 0.28 | |||
Table 5: Estimates of stability parameters for and branches per plant, capsules per plant and capsule length (cm).
The parent TKG-22 which indicated higher mean yield than general mean and showed that the regression coefficient was equal to unity, this considered average stability, therefore this was most stable and desirable parents for capsules per plant. The parent GT-10 and RT-351 for capsules per plant and TC-25, RT-125 and RT-103 for capsule length exhibited mean lower than general mean but regression coefficient was equal to unity referred to average stability. RT-346 and RT-46 for capsules per plant and TKG-22, RT-372, PRAGATI, RT-46 and GT-10 for capsule length exhibited lower mean compared to general mean and regression coefficient was lower than unity this indicated above average stability thus suited for poor environmental conditions [15].
The crosses RT-346 x RT-103 and RT-346 x RT-351 for capsules per plant and RT-346 x PRAGATI, RT-346 x RT-103, TKG-22 x RT-125, TKG-22 x GT-10, TKG-22 x RT-351, RT-372 x TC-25, RT-372 x GT-10, RT-46 x RT-103 and RT-103 x RT-351 capsule length had higher mean compared to general mean, regression coefficient was equal to unity indicated average stability and thus considered to be most stable and desirable crosses. TKG-22 x RT-372, TC-25 x RT-46 for capsules per plant and capsule length had higher mean performance than general mean, regression coefficient more than unity so these exhibited below average stability and suitable for better environmental conditions. The crosses PRAGATI x RT-103 and RT-125 x GT-10 for capsules per plant and RT-346 x RT-372, PRAGATI x RT-351, RT-46 x RT-351 and RT-125 x RT-103 capsule length had higher mean compared to general mean, regression coefficient was below to unity indicated above to average stability were considered to be suitable for poor environmental conditions (Table 6).
| Parents/cross | Seeds per capsule | 1000-seed weight (g) | Capsule girth (cm) | ||||||
|---|---|---|---|---|---|---|---|---|---|
| Mean | bi | S2di | Mean | bi | S2di | Mean | bi | S2di | |
| Parents | |||||||||
| RT-346 | 52.98 | 0.69 | 30.22 | 3.17 | 1.31 | 0.03 | 1.91 | 0.99 | 0.02 |
| TKG-22 | 57.79 | 0.91 | -1.47 | 3.11 | 1.13 | 0.01 | 1.97 | 1.04 | 0.01 |
| RT-372 | 57.79 | 1.07 | -2.01 | 3.07 | 0.72 | 0.02 | 1.84 | 0.99 | -0.01 |
| TC-25 | 53.73 | 0.67 | 17.87 | 2.86 | 0.75 | 0.01 | 1.79 | 0.97 | 0.07 |
| PRAGATI | 52.28 | 0.72 | 14.92 | 2.82 | 0.42 | 0.02 | 1.59 | 0.88 | 0.01 |
| RT-46 | 53.14 | 0.82 | 7.71 | 2.87 | 1.13 | 0.04 | 1.81 | 0.95 | 0.01 |
| RT-125 | 55.49 | 0.84 | 17.34 | 2.77 | 1.46 | 0.05 | 1.86 | 0.97 | 0.01 |
| RT-103 | 55.04 | 0.60 | 23.95 | 2.91 | 0.84 | 0.01 | 1.73 | 1.00 | 0.02 |
| GT-10 | 55.87 | 1.10 | 1.07 | 2.93 | 0.95 | 0.01 | 1.61 | 0.85 | 0.02 |
| RT-351 | 58.44 | 1.07 | 40.10 | 3.03 | 1.28 | 0.02 | 1.77 | 0.97 | 0.01 |
| Crosses | |||||||||
| RT-346 x TKG-22 | 68.14 | 0.93 | 0.79 | 3.43 | 1.28 | 0.05 | 2.13 | 1.05 | 0.06 |
| RT-346 x RT-372 | 63.37 | 1.02 | 94.66 | 3.34 | 1.16 | 0.10 | 2.07 | 1.12 | 0.02 |
| RT-346 x TC-25 | 58.44 | 0.98 | -3.07 | 3.09 | 1.34 | 0.03 | 1.83 | 0.93 | 0.02 |
| RT-346 x PRAGATI | 62.61 | 0.72 | 0.80 | 2.81 | 0.69 | 0.15 | 1.91 | 1.09 | 0.02 |
| RT-346 x RT-46 | 57.51 | 1.11 | 30.11 | 3.14 | 1.40 | 0.09 | 2.04 | 1.23 | 0.01 |
| RT-346 x RT-125 | 61.73 | 1.22 | 1.06 | 3.03 | 0.54 | 0.01 | 1.87 | 0.95 | 0.02 |
| RT-346 x RT-103 | 59.73 | 1.06 | -1.35 | 3.08 | 1.07 | 0.01 | 1.86 | 0.97 | 0.01 |
| RT-346 x GT-10 | 67.00 | 1.02 | 1.02 | 3.39 | 1.13 | 0.01 | 2.09 | 1.09 | 0.01 |
| RT-346 x RT-351 | 67.63 | 1.03 | 6.88 | 3.25 | 1.01 | 0.24 | 1.96 | 0.9 | 0.01 |
| TKG-22 x RT-372 | 63.91 | 1.01 | 144.75 | 3.51 | 1.10 | 0.01 | 2.3 | 1.37 | 0.01 |
| TKG-22 x TC-25 | 60.16 | 1.50 | -1.73 | 3.19 | 1.04 | 0.05 | 1.78 | 0.88 | 0.05 |
| TKG-22 x PRAGATI | 57.39 | 1.18 | 3.86 | 2.94 | 1.10 | -0.02 | 1.86 | 0.93 | 0.04 |
| TKG-22 x RT-46 | 55.91 | 1.44 | 82.8 | 3.01 | 1.10 | -0.02 | 1.79 | 0.81 | 0.01 |
| TKG-22 x RT-125 | 56.58 | 0.86 | 19.65 | 3.13 | 0.98 | 0.24 | 1.90 | 0.95 | 0.01 |
| TKG-22 x RT-103 | 57.00 | 1.15 | 79.86 | 3.06 | 0.87 | 0.01 | 1.88 | 0.95 | 0.01 |
| TKG-22 x GT-10 | 69.24 | 1.13 | 1.66 | 3.38 | 0.92 | 0.12 | 2.08 | 1.09 | 0.01 |
| TKG-22 x RT-351 | 69.73 | 1.11 | -0.70 | 3.28 | 1.04 | 0.23 | 2.03 | 0.99 | 0.01 |
| RT-372 x TC-25 | 65.56 | 1.22 | 56.24 | 3.24 | 1.13 | 0.12 | 1.90 | 0.97 | 0.04 |
| RT-372 x PRAGATI | 52.83 | 0.75 | 2.72 | 3.06 | 0.92 | 0.05 | 1.98 | 1.05 | 0.02 |
| RT-372 x RT-46 | 52.18 | 0.81 | 52.26 | 2.98 | 0.92 | 0.02 | 1.87 | 0.67 | 0.01 |
| RT-372 x RT-125 | 63.93 | 1.08 | 46.62 | 3.31 | 1.04 | 0.07 | 1.89 | 0.95 | 0.01 |
| RT-372 x RT-103 | 54.93 | 1.30 | 39.51 | 2.87 | 1.28 | 0.05 | 1.89 | 0.93 | 0.02 |
| RT-372 x GT-10 | 61.93 | 1.12 | 290.27 | 3.36 | 1.01 | 0.06 | 2.06 | 1.04 | 0.01 |
| RT-372 x RT-351 | 66.31 | 1.10 | 76.43 | 3.39 | 1.10 | 0.09 | 2.08 | 1.09 | 0.01 |
| TC-25 x PRAGATI | 57.56 | 0.90 | 2.66 | 3.06 | 1.04 | 0.05 | 1.87 | 0.93 | 0.02 |
| TC-25 x RT-46 | 56.64 | 0.86 | 4.62 | 2.99 | 1.13 | 0.03 | 2.00 | 1.09 | 0.01 |
| TC-25 x RT-125 | 57.29 | 0.82 | 8.06 | 3.28 | 0.84 | 0.02 | 1.86 | 1.05 | 0.07 |
| TC-25 x RT-103 | 60.48 | 1.06 | 124.24 | 3.05 | 1.01 | 0.01 | 1.90 | 0.93 | 0.02 |
| TC-25 x GT-10 | 68.36 | 1.05 | -1.73 | 3.09 | 1.19 | 0.04 | 1.92 | 1.30 | -0.02 |
| TC-25 x RT-351 | 69.38 | 1.10 | -5.28 | 3.17 | 1.16 | 0.02 | 1.93 | 1.04 | 0.02 |
| PRAGATI x RT-46 | 58.80 | 1.11 | -2.70 | 3.02 | 0.90 | -0.02 | 1.79 | 0.95 | 0.01 |
| PRAGATI x RT-125 | 60.44 | 1.11 | -4.51 | 3.20 | 0.60 | 0.03 | 1.89 | 0.92 | 0.04 |
| PRAGATI x RT-103 | 54.82 | 0.78 | -3.93 | 2.94 | 0.78 | 0.08 | 1.94 | 1.05 | 0.02 |
| PRAGATI x GT-10 | 61.56 | 0.79 | 33.72 | 3.22 | 0.75 | 0.07 | 1.92 | 1.07 | 0.01 |
| PRAGATI x RT-351 | 63.17 | 0.79 | 26.6 | 3.10 | 0.45 | 0.02 | 1.99 | 1.05 | -0.01 |
| RT-46 x RT-125 | 60.13 | 1.14 | -1.42 | 3.06 | 1.10 | 0.01 | 1.85 | 0.93 | 0.02 |
| RT-46 x RT-103 | 54.51 | 0.98 | 44.34 | 3.23 | 1.10 | 0.09 | 1.81 | 1.12 | 0.01 |
| RT-46 x GT-10 | 57.87 | 1.08 | -3.24 | 2.92 | 1.10 | -0.02 | 1.82 | 1.14 | 0.03 |
| RT-46 x RT-351 | 57.28 | 0.89 | -0.82 | 3.06 | 0.57 | 0.03 | 1.88 | 0.99 | 0.01 |
| RT-125 x RT-103 | 60.04 | 0.92 | -0.51 | 3.19 | 1.13 | -0.02 | 1.95 | 1.00 | 0.03 |
| RT-125 x GT-10 | 59.87 | 1.18 | 0.86 | 3.08 | 0.69 | -0.02 | 1.87 | 0.74 | 0.01 |
| RT-125 x RT-351 | 63.91 | 1.13 | 63.91 | 3.07 | 0.54 | 0.01 | 1.83 | 0.78 | 0.04 |
| RT-103 x GT-10 | 67.34 | 0.83 | 6.61 | 3.11 | 1.58 | 0.08 | 1.90 | 0.95 | 0.01 |
| RT-103 x RT-351 | 60.53 | 1.13 | -4.35 | 3.21 | 1.28 | 0.10 | 1.97 | 1.11 | -0.01 |
| GT-10 x RT-351 | 69.20 | 1.02 | -0.97 | 3.10 | 0.84 | 0.10 | 2.03 | 1.14 | 0.01 |
| General mean | 60.10 | 1.00 | 26.56 | 3.11 | 1.00 | 0.04 | 1.91 | 1.00 | 0.02 |
| S.E. (bi) | 1.67 | 0.18 | 0.08 | 0.33 | 0.06 | 0.17 | |||
Table 6: Estimates of stability parameters for seeds per capsule, 1000-seed weight and capsule girth (cm).
The parents TKG-22, RT-372, RT-46 and GT-10 for seeds per capsule and RT-46, RT-103 and GT-10 for 1000 seed weight exhibited mean lower than general mean but regression coefficient was equal to unity referred to average stability. RT-372, TC-25, PRAGATI exhibited lower mean compared to general mean and regression coefficient was lower than unity this indicated above average stability thus suited for poor environmental conditions. RT-346 exhibited higher mean compared to general mean and regression coefficient was higher than unity this indicated below average stability thus suited for specific environmental conditions for 1000 seed weight. The parents RT-372, PRAGATI, RT-46, RT-125 and RT-351 for capsule girth, TC-25 for seed yield per plant and RT-346, RT-372, RT-103 and RT-351 for oil content exhibited mean lower than general mean but regression coefficient was equal to unity referred to average stability. The parents PRAGATI and RT-46 for seed yield per plant and TKG-22 for oil content exhibited lower mean compared to general mean and regression coefficient was lower than unity this indicated above average stability thus suited for poor environmental conditions for seed yield per plant [16].
The crosses RT-346 x GT-10, RT-346 x RT-351, TKG-22 x GT-10, TKG-22 x RT-351, x RT-351, RT-103 x RT-351 and GT-10 x RT-351 for seeds per capsule, capsule girth and RT-346 x GT-10, TKG-22 x RT-372, RT-372 x GT-10, TC-25 x RT-125, RT-125 x RT-103 1000 seed weight had higher mean compared to general mean, regression coefficient was equal to unity indicated average stability and thus considered to be most stable and desirable crosses. RT-346 x RT-125 and TKG-22 x TC-25 for seeds per capsule and RT-346 x TKG-22 and RT-346 x RT-372 1000-seed weight had higher mean performance than general mean, regression coefficient more than unity so these exhibited below average stability and suitable for better environmental conditions. The crosses RT-346 x PRAGATI for seeds per capsule and PRAGATI x RT-125 capsule girth had higher mean compared to general mean, regression coefficient was below to unity indicated above average stability and thus considered to be suitable for poor environmental conditions. The cross PRAGATI x RT-125 had higher mean compared to general mean, regression coefficient was below unity indicated above average stability and thus considered to be suitable for poor environmental conditions for 1000 seed weight (Table 7).
| Parents/cross | Seed yield per plant (g) | Oil content (%) | ||||
|---|---|---|---|---|---|---|
| Mean | bi | S2di | Mean | bi | S2di | |
| Parents | ||||||
| RT-346 | 3.46 | 0.67 | 0.23 | 3.17 | 1.31 | 0.03 |
| TKG-22 | 4.94 | 1.06 | -0.10 | 3.11 | 1.13 | 0.01 |
| RT-372 | 4.79 | 0.84 | -0.08 | 3.07 | 0.72 | 0.02 |
| TC-25 | 4.26 | 0.95 | 0.13 | 2.86 | 0.75 | 0.01 |
| PRAGATI | 3.11 | 0.70 | 0.14 | 2.82 | 0.42 | 0.02 |
| RT-46 | 3.03 | 0.61 | 0.05 | 2.87 | 1.13 | 0.04 |
| RT-125 | 4.09 | 0.67 | 1.37 | 2.77 | 1.46 | 0.05 |
| RT-103 | 3.73 | 0.35 | 3.82 | 2.91 | 0.84 | 0.01 |
| GT-10 | 4.88 | 0.97 | -0.02 | 2.93 | 0.95 | 0.01 |
| RT-351 | 4.99 | 0.84 | -0.04 | 3.03 | 1.28 | 0.02 |
| Crosses | ||||||
| RT-346 x TKG-22 | 6.12 | 1.35 | 0.17 | 3.43 | 1.28 | 0.05 |
| RT-346 x RT-372 | 4.78 | 1.20 | 0.61 | 3.34 | 1.16 | 0.10 |
| RT-346 x TC-25 | 4.48 | 1.06 | 1.01 | 3.09 | 1.34 | 0.03 |
| RT-346 x PRAGATI | 3.85 | 0.74 | 0.02 | 2.81 | 0.69 | 0.15 |
| RT-346 x RT-46 | 4.19 | 0.99 | 0.14 | 3.14 | 1.40 | 0.09 |
| RT-346 x RT-125 | 4.55 | 0.87 | 0.07 | 3.03 | 0.54 | 0.01 |
| RT-346 x RT-103 | 4.68 | 0.73 | 1.43 | 3.08 | 1.07 | 0.01 |
| RT-346 x GT-10 | 5.36 | 1.30 | 0.50 | 3.39 | 1.13 | 0.01 |
| RT-346 x RT-351 | 5.07 | 1.31 | -0.01 | 3.25 | 1.01 | 0.24 |
| TKG-22 x RT-372 | 6.54 | 1.41 | -0.07 | 3.51 | 1.10 | 0.01 |
| TKG-22 x TC-25 | 6.12 | 1.76 | -0.13 | 3.19 | 1.04 | 0.05 |
| TKG-22 x PRAGATI | 5.02 | 1.11 | 0.11 | 2.94 | 1.10 | -0.02 |
| TKG-22 x RT-46 | 5.09 | 1.04 | 0.22 | 3.01 | 1.10 | -0.02 |
| TKG-22 x RT-125 | 3.80 | 0.62 | 0.10 | 3.13 | 0.98 | 0.24 |
| TKG-22 x RT-103 | 4.68 | 1.11 | 0.08 | 3.06 | 0.87 | 0.01 |
| TKG-22 x GT-10 | 6.17 | 1.31 | 0.19 | 3.38 | 0.92 | 0.12 |
| TKG-22 x RT-351 | 6.32 | 1.39 | 0.54 | 3.28 | 1.04 | 0.23 |
| RT-372 x TC-25 | 5.53 | 1.57 | 0.99 | 3.24 | 1.13 | 0.12 |
| RT-372 x PRAGATI | 4.67 | 1.07 | 0.05 | 3.06 | 0.92 | 0.05 |
| RT-372 x RT-46 | 4.60 | 1.16 | 0.37 | 2.98 | 0.92 | 0.02 |
| RT-372 x RT-125 | 4.08 | 0.99 | 0.97 | 3.31 | 1.04 | 0.07 |
| RT-372 x RT-103 | 5.05 | 1.12 | 0.10 | 2.87 | 1.28 | 0.05 |
| RT-372 x GT-10 | 6.01 | 1.05 | 0.21 | 3.36 | 1.01 | 0.06 |
| RT-372 x RT-351 | 6.48 | 1.28 | -0.03 | 3.39 | 1.10 | 0.09 |
| TC-25 x PRAGATI | 4.31 | 0.92 | 0.03 | 3.06 | 1.04 | 0.05 |
| TC-25 x RT-46 | 4.77 | 0.86 | 0.03 | 2.99 | 1.13 | 0.03 |
| TC-25 x RT-125 | 4.40 | 0.82 | -0.01 | 3.28 | 0.84 | 0.02 |
| TC-25 x RT-103 | 4.76 | 1.03 | 0.15 | 3.05 | 1.01 | 0.01 |
| TC-25 x GT-10 | 4.75 | 1.5 | 1.26 | 3.09 | 1.19 | 0.04 |
| TC-25 x RT-351 | 3.97 | 0.57 | 0.34 | 3.17 | 1.16 | 0.02 |
| PRAGATI x RT-46 | 3.95 | 0.87 | 0.72 | 3.02 | 0.90 | -0.02 |
| PRAGATI x RT-125 | 4.31 | 0.94 | -0.04 | 3.20 | 0.60 | 0.03 |
| PRAGATI x RT-103 | 3.59 | 0.27 | 1.43 | 2.94 | 0.78 | 0.08 |
| PRAGATI x GT-10 | 3.89 | 0.60 | 0.27 | 3.22 | 0.75 | 0.07 |
| PRAGATI x RT-351 | 5.12 | 1.32 | 0.56 | 3.10 | 0.45 | 0.02 |
| RT-46 x RT-125 | 4.15 | 1.03 | -0.09 | 3.06 | 1.10 | 0.01 |
| RT-46 x RT-103 | 4.09 | 0.60 | 0.27 | 3.23 | 1.10 | 0.09 |
| RT-46 x GT-10 | 5.14 | 1.21 | 0.29 | 2.92 | 1.10 | -0.02 |
| RT-46 x RT-351 | 4.43 | 0.81 | 0.30 | 3.06 | 0.57 | 0.03 |
| RT-125 x RT-103 | 4.14 | 0.98 | -0.01 | 3.19 | 1.13 | -0.02 |
| RT-125 x GT-10 | 4.04 | 0.88 | -0.05 | 3.08 | 0.69 | -0.02 |
| RT-125 x RT-351 | 4.41 | 1.06 | 0.05 | 3.07 | 0.54 | 0.01 |
| RT-103 x GT-10 | 5.04 | 1.16 | 0.23 | 3.11 | 1.58 | 0.08 |
| RT-103 x RT-351 | 4.19 | 1.21 | 2.04 | 3.21 | 1.28 | 0.10 |
| GT-10 x RT-351 | 6.43 | 1.16 | 0.26 | 3.10 | 0.84 | 0.10 |
| General mean | 4.70 | 1.00 | 0.38 | 3.11 | 1.00 | 0.04 |
| S.E. (bi) | 0.25 | 0.17 | 0.08 | 0.33 | ||
Table 7: Estimates of stability parameters for seed yield per plant and oil content (%).
The crosses RT-346 x TKG-22, RT-346 x RT-351, TKG-22 x RT-372, TKG-22 x TC-25 and RT-372 x RT-351 for seed yield per plant and RT-346 x TKG-22, RT-346 x RT-372, RT-372 x RT-46 and RT-103 x RT-351 oil content had higher mean performance than general mean, regression coefficient more than unity so these exhibited below average stability and suitable for better environmental conditions. The crosses TKG-22 x PRAGATI, RT-372 x RT-103, TC-25 x RT-46 and TC-25 x RT-103 for seed yield per plant and RT-346 x GT-10, RT-346 x RT-351, RT-372 x PRAGATI, RT-372 x RT-125, RT-372 x GT-10, TC-25 x GT-10, PRAGATI x RT-125 and PRAGATI x RT-351 oil content had higher mean compared to general mean, regression coefficient was equal to unity and S2di equivalent to zero indicated average stability were considered to be most stable and desirable crosses. The crosses TKG-22 x RT-372, TKG-22 x GT-10, TC-25 x RT-46, RT-46 x GT-10 and RT-125 x RT-103 had higher mean compared to general mean, regression coefficient was below to unity indicated above average stability and thus considered to be suitable for poor environmental conditions for oil content [17].
Discussion
Knowledge about nature and relative magnitude of genotype x environment interaction is significant in regarding breeding methods, selection programme and testing procedures in crop plants. In order to minimize genotype x environment interactions and to increase accuracy in selection, stratification of environments has been employed; however, even with improvement of technique, an interaction of genotype with environment within same year remains (Allard and Bradshaw. Sprague opined that the possibility of diminishing genotype x environment interaction in field experiment is doubtful despite knowledge of the factors responsible for such interaction. The breeders have long been alert of the evils of differential responses of genotypes, when practiced under different environments; while, we were unable to quantify the same and modified their methodology. This was mostly due to the problem of their incapability to define and measures the adaptability and/or the intricacy of environments [18]. Finlay and Wilkinson stated linear regression slope as a measure of stability. Eberhart and Russell realized the need of considering both linear (bi) and non-linear (S2di) component of genotype environment interaction in judging the phenotypic stability of a genotype. Comstock and Moll, Allard and Bradshaw, Eberhart and Russell, Perkins and Jinks emphasized the significance of evaluating genotypes under different agro-climatic conditions to get consistent information on stability parameters of breeding material and different measures of stability have been used by various scientist. Later, Breese supported that linear regression could simply be observed as a measure of awareness for a particular genotype; hence, deviation around regression line (S2di) was considered as superior measures of stability. They fulfilled that genotypes with the lowest standard deviation were the most stable and vice-versa [19].
Eberhart and Russell defined a stable genotype as, which have a high mean yield (x), regression coefficient around unity (bi=1) and deviation from regression as small as possible (S2di=0). Later on, Breese advocated that linear regression (bi) could simply be regarded as a measure of response of a particular genotype, whereas the deviation from regression (S2di) as a measure of stability [20].
Based on the linear (bi) and non-linear (S2di) sensitivity, the genotypes were classified into the following four classes of stability.
A. Both bi and S2di non-significant (absence of genotype x environment) interaction. The estimates of bi and S2di were nonsignificant suggesting average stability and wider adaptability across the environments.
B. Only b significant (genotype x environment).
• The major portion of the genotype x environment interaction was accounted for the linear environmental changes (significant bi). This suggests responsiveness of the genotype and their performance can be predicated with some reliance over the environments.
• Same as (i) but significant S2di, suggesting high genotype x environment interaction and unstable performance over the environments and perfect prediction would be rather difficult.
• The major portion of the genotype x environment interaction was accounted for the deviation mean square from the expectation, the estimation; the estimation of S2di was significant whereas bi was non-significant. This indicated high unpredictability and unsuitability of the genotype.
The summarized information on genotype x environment interaction of individual genotypes based on above criteria is mentioned in tables. Majority of the parents and crosses for all the traits indicated significant regression coefficient (bi) which suggested responsiveness of the genotype and their performance can be predicted with some reliance over the environment. In present investigation, all the traits (except plant height, capsule length and seed yield for crosses) revealed that none of the parents and crosses exhibited both significant regression coefficient (bi) and deviation from regression (S2di) suggested responsiveness of the genotype and their performance can be predicted with some reliance over the environments [21].
Simultaneous consideration of the mean, regression coefficient and deviation from regression (S2di) of the individual genotype for seed yield per plant exhibited that among the parents, RT-351 (4.99) recorded highest average seed yield per plant thus average stability as the regression was not differing from unity and deviation from regression (S2di) was also non-significant [22]. Among the crosses, the crosses RT-372 x RT-103, TKG-22 x PRAGATI and TC-25 x RT-46 had regression coefficient around unity (bi=1) and non-significant deviation from regression indicated stability under normal environment. On the other hand, crosses TKG-22 x RT-372, RT-372 x RT-351, RT-346 x TKG-22 and TKG-22 x TC-25 recorded high seed yield as compared to population mean and regression coefficient greater than unity (bi>1) with non-significant deviation from regression indicated suitability and stability under favorable environments [23]. Table 8 exhibited top stable hybrids identified on the basis of high mean for seed yield per plant along with stability of component traits. These crosses also expressed better adaptability to more favorable or better environmental conditions for plant height, capsules per plant, branches per plant, capsule length, seeds per capsule, 1000 seed weight, capsule girth, seed yield and oil content [24]. Similar trends for adaptability of genotypes were also reported by Raghuwanshi (Table 9).
| Characters | Favorable environment bi>1 | Poor environment bi<1 | Different environment bi=1 |
|---|---|---|---|
| Days to 50% flowering | RT-125 | PRAGATI | TKG-22 |
| RT-103 | - | RT-372 | |
| - | - | - | |
| Days to maturity | PRAGATI | RT-351 | RT-125 |
| - | - | RT-346 | |
| - | - | RT-103 | |
| Plant height | RT-372 | - | - |
| - | - | - | |
| - | - | - | |
| Branches per plant | RT-103 | - | - |
| - | - | - | |
| - | - | - | |
| Capsules per plant | - | - | TKG-22 |
| - | - | - | |
| - | - | - | |
| Capsule length | - | - | - |
| - | - | - | |
| - | - | - | |
| Seeds per capsule | - | - | - |
| - | - | - | |
| - | - | - | |
| 1000-seed weight | RT-346 | - | TKG-22 |
| - | - | - | |
| - | - | - | |
| Capsule girth | - | - | TKG-22 |
| - | - | RT-346 | |
| - | - | - | |
| Seed yield per plant | - | - | RT-351 |
| - | - | TKG-22 | |
| - | - | GT-10 | |
| Oil content | - | - | - |
| - | - | - | |
| - | - | - |
Table 8: The best performing parents in different environments (ranked on the basis of means).
| S. per No. | Crosses | Seed yield | Stable for component traits | ||
|---|---|---|---|---|---|
| Plant (g) | bi=1 | bi>1 | bi<1 | ||
| 1 | TKG-22 x RT-372 | 6.54 | Branches per plant, 1000-seed weight | Days to maturity, plant height, capsules per plant, capsule length, capsule girth, seed yield per plant | Days to 50% flowering, oil content |
| 2 | RT-372 x RT-351 | 6.48 | Days to 50% flowering, Capsules per plant, capsule girth | Branches per plant, capsule length, seed yield per plant | Days to maturity |
| 3 | GT-10 x RT-351 | 6.43 | Days to maturity, seeds per capsule, 1000-seed weight, capsule girth | Plant height, branches per plant, capsules per plant | Capsule length |
Table 9: Stable hybrids identified on the basis of high mean for seed yield per plant along with stability of component traits.
Conclusion
In stability analysis, Genotype x Environment (G x E) interactions were significant for all the traits, indicating the influence of environmental conditions on the genotypes evaluated. Considerable interactions of genotypes with environments were obtained, as the environment plus genotypes x environments were significant for all the traits. Mean Sum of Squares (MSS) due to genotype x environment (linear) was significantly higher than the MSS due to pooled deviation for days to 50% flowering, days to maturity, plant height and seed yield per plant. The parents TKG-22, RT-372, GT-10 and RT-351 and crosses TKG-22 x PRAGATI, RT-372 x RT-103, TC-25 x RT-46 and TC-25 x RT-103 recorded high yield as compared to average mean with average responsiveness and stable performance, as they had regression coefficient around unity and non-significant deviation from regression. The crosses RT-346 x TKG-22, RT-346 x RT-351, TKG-22 x RT-372, TKG-22 x TC-25 and RT-372 x RT-351 had regression coefficient more than unity with higher than average mean and non-significant deviation from regression indicated its suitability and stability under favorable environments. Most of the crosses also showed stable performance for other yield components and oil content.
References
- Abate M, Mekbib F, Ayana A, Nigussie M (2015) Genotype x Environment and stability analysis of oil content in Sesame (Sesamum indicum L.) across diverse agro-ecologies of the awash valleys in Ethiopia. Am J Exp Agric 9: 1-2. [Crossref][Googlescholar]
- Allard RW (1960) Principles of plant breeding, John Wiley and Sons Inc, USA, pp. 485.
- Allard RW, Bradshaw AD (1964) Implications of genotype-environmental interaction in applied plant breeding. Crop Sci 4: 503-508. [Crossref][Googlescholar]
- Adebisi MA (2009) Stability analysis of seed germination and field emergence performance of tropical rainfed sesame genotypes. Rep Opinion 1: 1-8.
- Backer RJ (1969) Genotype environment interactions in yield of wheat. Can J Plant Sci 49: 743-791. [Crossref][Googlescholar]
- Genotype x Environment and stability analysis of oil content in Sesame (Sesamum indicum L.) across diverse agro-ecologies of the awash valleys in Ethiopia
- Breese E (1969) The measurement and significance of genotype x environment interactions in grasses. Heredity 24: 27-44. [Crossref]
- Chowdhury S, Datta AK, Aditi S, Sonali S, Rita P, et al. (2010) Traits influencing yield in sesame (Sesamum indicum L.) and multilocational trials of yield parameters in some desirable plant types. Indian J Sci Technol 3: 163-165. [Crossref][Googlescholar]
- Comstock RE, Moll RH (1963) Genotype x Environment interactions, symposium on statistical genetics and plant breeding. National Academy Science, National Research Council, USA, 164-196.
- Eberhart SA, Russel WA (1966) Stability parameters for comparing varieties. Crop Sci 6: 36-40. [Crossref][Googlescholar]
- Finlay KW, Wilkinson GN (1963) The analysis of adaptation in a plant breeding programme. Aust J Agric Res 14: 742-754. [Crossref][Googlescholar]
- Kangbo S, Kang CW, When PJ (2003) Genotype by environment interaction in yield of sesame. Korean J Crop Sci 48: 65-67. [Googlescholar]
- Kumar ST, Anandan A, Kumar CPS (2004) Stability of sesame (Sesamum indicum L.) varieties under different population densities. Crop Improv 31: 103-106.
- Kumar PS, Sasivannan S, Ganesan J (2006) Stability analysis in Sesamum (Sesamum indicum L.). Crop Res 31: 394-395.
- Laurentin H, Montilla D, Garcia V (2007) Interpreting genotype x environment interaction in sesame (Sesamum indicum L.). J Agric Sci 145: 263-271. [Crossref][Googlescholar]
- Malek MA, Das ML, Rahman A (2001) Genotype x environment interaction in sesame (Sesamum indicum L.). Bangladesh J Train Dev 14: 133-137.
- Mekonnen Z, Mohammed H (2009) Study on genotype x environment interaction of yield in sesame (Sesamum indicum L.). J Phytol 1: 199-205. [Googlescholar]
- Menkonnen Z, Mohammed H (2010) Study on genotype x environment interaction of yield in sesame (Sesamum indicum L.). World J Fungal Plant Biol 1: 15-20. [Googlescholar]
- Parmer RS, Chovatia UP, Barad HR, Sapara GK, Kumar R, et al. (2018) G x E interaction for Seed Yield and Its components traits in summer Sesame (Sesamum indicum L). Int J Curr Microbiol Appl Sci 7: 1921-1941. [Crossref]
- Perkins JM, Jinks JL (1968) Environmental and genotype environmental components of variability III multiple lines and crosses. Heredity 23: 339-346. [Crossref][Googlescholar][Indexed]
- Raghuwanshi KMS, Duhoon SS, Singh RB, Singh BR (2003) Stability parameters of some yield attributes in sesame (Sesamum indicum L.). J Inter-Acad 7: 396-399.
- Raikwar RS (2016) Stability for grain yield and its contributing traits in sesame (Sesamum indicum L.). Electron J Plant Breed 7: 1033-1039. [Crossref][Googlescholar]
- Weiss ES (1971) Castor, sesame and safflower, Barnes and noble. Barnes & Noble, New York, USA, pp. 529-744.
- Yirga BK, Firew M, Eyasu AA (2020) Genotype x Environment interaction and AMMI analysis of oil yield sesame (Sesamum indicum L.) genotypes in northern Ethiopia. Am J Life Sci 8: 165-171. [Crossref]
Citation: Nehra A, Gothwal DK, Jeeterwal RC, Jakhar ML, Punia SS, et al. (2023) Genotype x Environment Interactions for Seed Yield and Physiological Traits in Sesame (Sesamum indicum L.) for Food Security under Climate Resilience. J Plant Genet Breed 7:135
Copyright: © 2023 Nehra A, et al. This is an openaccess article distributed under the terms of the Creative Commons Attribution License, which permits unrestricted use, distribution and reproduction in any medium, provided the original author and source are credited.
Share This Article
Open Access Journals
Article Usage
- Total views: 1520
- [From(publication date): 0-2023 - Apr 26, 2025]
- Breakdown by view type
- HTML page views: 1146
- PDF downloads: 374