Research Article Open Access
Genetic Variability, Heritability and Genetic Advance for Yield and its Related Traits in Rainfed Lowland Rice (Oryza sativa L.) Genotypes at Fogera and Pawe, Ethiopia
Tefera Abebe1*, Sentayehu Alamerew2 and Leta Tulu31Tepi National Spices Research Center, Tepi, Ethiopia
2College of Agriculture and Veterinary Medicine, Jimma University, Jimma, Ethiopia
3Jimma Agricultural Research Center, Jimma, Ethiopia
- *Corresponding Author:
- Tefera Abebe
Tepi National Spices Research Center
PO Box 34, Tepi, Ethiopia
Tel: +251910990203
E-mail: Tefera.a02@gmail.com
Received date: March 24, 2017; Accepted date: April 04, 2017; Published date: April 11, 2017
Citation: Abebe T, Alamerew S, Tulu L (2017) Genetic Variability, Heritability and Genetic Advance for Yield and its Related Traits in Rainfed Lowland Rice (Oryza sativa L.) Genotypes at Fogera and Pawe, Ethiopia. Adv Crop Sci Tech 5:272. doi: 10.4172/2329-8863.1000272
Copyright: © 2017 Abebe T, et al. This is an open-access article distributed under the terms of the Creative Commons Attribution License, which permits unrestricted use, distribution, and reproduction in any medium, provided the original author and source are credited.
Visit for more related articles at Advances in Crop Science and Technology
Abstract
The present study consists of 36 rice genotypes that were evaluated at two locations, namely Fogera and Pawe to study genetic variability, heritability and genetic advance for grain yield and 13 yield associated traits. The experiment was conducted using 6 × 6 simple lattice design across two locations with two replications during the 2015/2016 main cropping season. The combined analysis of variance revealed statistically significant differences (p<0.05) indicating the existence of genetic variability among the 36 genotypes for all the traits studied. Genotype × location interactions were significant for days to maturity, plant height, panicle length, culm length, flag leaf length, number of filled grain per panicle, number of total spikelet per panicle, days to heading, biomass yield, grain yield and harvest index. Significant differences were observed for grain yield that ranged from 6759.00 to 2886.00 kg ha-1 with overall mean value of 5370.0 kg ha-1. Higher PCV and GCV values were exhibited by plant height, culm length, number of unfilled grain per panicle, biomass yield and grain yield, which suggests the possibility of improving this trait through selection. The highest heritability was recorded for culm length followed by plant height, biomass yield and panicle length. High to medium heritability coupled with high GCV and high genetic advance as percentage of means were exhibited for plant height, biomass yield, grain yield and number of unfilled grain per panicle. High genetic advances as percent of means were recorded by plant height, culm length, biomass yield, grain yield and number of unfilled grain per panicle.
Keywords
Genetic advance; Genetic variability; Heritability; Rice (Oryza sativa L.)
Introduction
Rice is a self-pollinated cereal crop belonging to the family Gramineae under the order Cyperales and class monocotyledon having chromosome number 2n=24 [1]. The genus Oryza is known to consist of two cultivated species i.e., Asian rice (O. sativa, 2n=24=AA) and African rice (O. glaberrima, 2n=24=AA) and 22 wild species (2n=24, 48) [2]. The river valleys of Yangtze, Mekon River area in China could be the primary center of origin of Oriza sativa [3,4]. Oryza glaberrima is indigenous to the upper valley of the Niger River and it is cultivated only in western tropical Africa [5].
The government of Ethiopia named as rice millennium crop and ranked it among the priority commodities of the country to attain food security [6,7]. It is also considered as one of the best and the cheapest alternative technology available to farmers for efficient utilization of their scarce resources, especially the land and water in swampy and water logged environments [8,9]. Rice is source of income and employment opportunities for rice farmers. It is used in the preparation of local foods such as injera, dabbo, genffo, kinchie and shorba and local beverages like tela and areki [7,10]. The straw is mainly used as fuel, feed stuff, fertilizer and industrial raw material [11].
The global production of paddy rice in 2014 was about 740.96 million tones and the cultivated area is estimated as 163.24 million hectares. From the total production, Asia accounts the largest production totaling to about 144.25 million tones whereas Africa produces approximately 11.58 million tons [12]. In 2014, average yield of rice for high producing countries 6.69, 6.75, 9.52, 5.75, 5.13 and 8.48 ton ha-1 for Japan, China, Egypt, Vietnam, Indonesia and USA, respectively [12]. In Ethiopia, in 2014, about 46, 823 ha of land was cultivated to with the total production of 1, 318, 218.53 tons.
Currently, Fogera, Gambella, Metema, and Pawe plains located in the northern, northwestern, and western regions of Ethiopia are becoming a major rice producing areas in Ethiopia. Furthermore, based on GIS information and agro-ecological requirements of rice, the potential rain fed rice production area in Ethiopia is estimated to be about 30 million hectares [7]. Of which 5.6 million ha is found to be highly suitable, and 25 million ha is suitable to rainfed upland rice while 3.7 million ha is potential available area for lowland irrigated rice in the country [6,13].
The national average yield of rice in Ethiopia is 2.81 ton/ha [12], which is much lower than the world’s average rice yield of 4.54 ton/ha [12]. This is due to insect pest and diseases occurrence (rice blast and brown spot), weeds and environmental fluctuations. In addition, poor agronomic practices; human and institutional capacity and shortage of adapted varieties for different agro-ecologies are the major rice production constraints in the country [6].
Rice is believed to be introduced to Ethiopia in 1970s Gebrekidan and Seyoum [10] and research on the crop was started in 1985 [6]. Since then, to alleviate some of the constraints to rice production by developing improved varieties researchers studied genetic variability in rice which is pre-requisite for rice breeding program since the development of an effective rice breeding program is dependent up on the existence of genetic variability and character association. Therefore, before launching any breeding program, survey of genetic variability with the help of suitable parameters such as genotypic coefficient of variation, heritability estimates and genetic advance are absolutely necessary to start an efficient breeding program.
For instance, Mulgeta [8] studied 22 released upland rice varieties and Mulugeta investigated the variability, heritability and genetic advance of 14 rainfed upland rice genotypes using morphological characterization. Moreover, Fentie et al. [14] evaluated 12 upland rice genotypes using morphological characterization. All researchers reported that the existence of adequate genetic variability and heritability and genetic advance among the tested materials. Several other researchers also reported high values of heritability and genetic advance for grain yield, 1000 grain weight, number of fertile tillers per plant, number of grain per panicle, panicle length, biomass yield and plant height in rice [15]. Genetic variation is the occurrence of differences among the individuals due to the differences in their genetic composition and the environment in which they were raised [16]. The difference of genetic variability present in introduced rice genotypes is essential to rice improvement which must be exploited by rice breeders for yield improvement to meet the demand of rice producers. However, limited attention has been given to studies on phenotypic and genotypic variability, heritability and genetic advance of yield and associated traits in introduced rainfed lowland rice genotypes to improve the grain yield in the study areas. Therefore, the present study was to assess the extent of genetic variability, heritability and genetic advance among thirty-six rice genotypes for yield and related traits with the objectives of estimating genetic variability, heritability, and genetic advance for yield and yield related traits.
Materials and Methods
Description of the study areas
Field experiments were conducted in 2015 cropping season at two locations, namely, Pawe Agricultural Research Center and Fogera National Rice Research and Training Center. The locations are situated in north western part of Ethiopia in Benishagul-Gumuz and Amhara Region states, respectively.
Fogera National Rice Research and Training Center is located 607 km from Addis Ababa (capital of Ethiopia) in the north-western part of Ethiopia. Specifically, the experimental site is located at 11°58’ N latitude, 37° 41’E longitude and at an elevation of 1810 m above sea level. Based on ten years’ average meteorological data, the annual rainfall, and mean annual minimum and maximum temperatures are 1300 mm, 11.5 C and 27.9°C, respectively. The soil type is black (Vertisol) with pH of 5.90.
Pawe Agricultural Research Center is located 578 km away from Addis Ababa. The experimental site is lies at 13° 19 N’ latitude, 37° 24’E longitude and at an elevation of 1200 m above sea level. The major soil type of the study site is well drained Nitisol with the pH value ranging from 5.3 to 5.5. Based on ten years’ average meteorological data, the annual rainfall, mean annual minimum and maximum temperatures are 1587 mm, 16.3°C and 32.6°C, respectively.
Experimental materials
The present study comprised of 34 genotypes of rice along with two checks (Table 1). Among the tested genotypes 17 were from the medium maturing group whereas 19 were from the early maturing group. All genotypes were obtained from Fogera National Rice Research and Training Center and were introduced from Africa Rice Center (Table 1).
| Number | Pedigree | Origin | Ecotype | Sources and maturity group |
|---|---|---|---|---|
| 1 | IR74052-184-3-3 | IRRI | Lowland | 2014 LRNVT-ES |
| 2 | YUNJING 23 | CHINA | Lowland | 2014 LRNVT-ES |
| 3 | WAB502-8-5-1 | Africa rice | Lowland | 2014 LRNVT-ES |
| 4 | PSBRC44 | IRRI | Lowland | 2014 LRNVT-ES |
| 5 | WAB376-B-10-H3 | Africa rice | Lowland | 2014 LRNVT-ES |
| 6 | IR 83222-F11-167 | IRRI | Lowland | 2014 LRNVT-ES |
| 7 | IR 83222-F11-18 | IRRI | Lowland | 2014 LRNVT-ES |
| 8 | IR 83222-F11-200 | IRRI | Lowland | 2014 LRNVT-ES |
| 9 | IR 83222-F11-209 | IRRI | Lowland | 2014 LRNVT-ES |
| 10 | IR 83222-F11-66 | IRRI | Lowland | 2014 LRNVT-ES |
| 11 | IR76999-52-1-3-2 | IRRI | Lowland | 2014 LRNVT-ES |
| 12 | IR 83249-F9-29 | IRRI | Lowland | 2014 LRNVT-ES |
| 13 | STEJAREE 45 | IRRI | Lowland | 2014 LRNVT-ES |
| 14 | CHOMRONG | Senegal | Lowland | 2014 LRNVT-ES |
| 15 | WAB880-1-38-20-17-P1-HB | Africa rice | Lowland | 2014 LRNVT-ES |
| 16 | WAB880-1-32-1-2-P1-HB | Africa rice | Lowland | 2014 LRNVT-MS |
| 17 | IRAT112 | Cote devoir | Lowland | 2014 LRNVT-MS |
| 18 | WAS 161-B-6-B-B-1-B | Africa rice | Lowland | 2014 LRNVT-MS |
| 19 | WAB 326-B-B-7-H1 | Africa rice | Lowland | 2014 LRNVT-MS |
| 20 | IR 83372-B-B-115-4 | IRRI | Lowland | 2014 LRNVT-MS |
| 21 | IR 83377-B-B-93-3 | IRRI | Lowland | 2014 LRNVT-MS |
| 22 | IR 83383-B-B-141-2 | IRRI | Lowland | 2014 LRNVT-MS |
| 23 | IR 83372-B-B-115-3 | IRRI | Lowland | 2014 LRNVT-MS |
| 24 | IR 83383-B-B-141-1 | IRRI | Lowland | 2014 LRNVT-MS |
| 25 | IR80420-B-22-2 | IRRI | Lowland | 2014 LRNVT-MS |
| 26 | IR80463-B-39-3 | IRRI | Lowland | 2014 LRNVT-MS |
| 27 | IR 72768-8-1-1 | IRRI | Lowland | 2014 LRNVT-MS |
| 28 | IR 75518-18-1-2-B | IRRI | Lowland | 2014 LRNVT-MS |
| 29 | IR 75518-84-1-1-B | IRRI | Lowland | 2014 LRNVT-MS |
| 30 | YUNLU N0.33 | CHINA | Lowland | 2014 LRNVT-MS |
| 31 | IR 81047-B-106-2-4 | IRRI | Lowland | 2014 LRNVT-MS |
| 32 | WAS 161-B-6-B-1 (NERICA-L-36) | Africa rice | Lowland | 2014 LRNVT-MS |
| 33 | ARCCU16Bar-21-5-12-3-1-2-1 | Africa rice | Lowland | 2014 LRNVT-MS |
| 34 | ARCCU16Bar-13-2-16-2-1-1 | Africa rice | Lowland | 2014 LRNVT-MS |
| 35 | EDIGET (CHECK-1) | Africa rice | Lowland | Released |
| 36 | X-JIGNA (CHECK-2) | Ethiopia | Lowland | Local |
LRNVT-ES=Lowland Rice National Variety Trial Early Set; LRNVT-MS=Lowland Rice National Variety Trial Medium Set; IRRI=international rice research institute Sources:Fogera National Rice Research and Training Center.
Table 1: Description of rice genotypes used for the study.
Experimental design and trial management
The experiments were laid out in simple lattice design 6 × 6 with two replications. The plot size was six rows of 5 m length with 0.2 m row spacing giving a total area of 6 m2. Spacing’s of 1.0 m and 0.30 m were used between blocks and plots, respectively. For data collection, the middle four rows only were used for determination of grain yield and yield related traits (5 m × 0.8 m=4 m2).
Planting was done by manual drilling at a rate of 36 g per plot on June 17 at Pawe and June 28 at Fogera during the 2015 cropping season. Recommended fertilizer of Urea and DAP at the rate of 64 kg N ha-1 and 46 kg P2O5 ha-1 was applied to each plot. P2O5 was applied all at planting time whereas N was applied in three splits i.e., 1/3 at planting, 1/3 at tillering and the remaining 1/3 at panicle initiation according to the national rice fertilizer blanket recommendation at each location.
Weeding was done by hand two to three times starting from 25-30 days after sowing depending on infestation level. All other agronomic practices were applied as per the recommendation for rice production in the two locations during the growing season to raise a healthy rice crop.
Agronomic data collected
Fourteen quantitative traits of morphological data at appropriate growth stage of rice plant were collected and recorded on plot and plant basis according to two rice descriptors and Bioversity International [17].
On plot basis: Days to 50% heading: Days to 50% heading was recorded as the number of days from seeding to the date on which the panicle tips when emerge in 50% of the plants in each plot of the central four rows of panicle have at least partially attained heading.
Days to 85% maturity: Was registered as the number of days from sowing to the attainment of physiological maturity in 85% of the crop stands attained maturity. It was judged by field visual observation when the turning of the straw and panicle changed to light yellow or straw color.
Grain yield per plot (g): The grain yield was determined by harvesting the rice crop from the net middle plot area of 4 m2 and threshed, cleaned and weighed using an electronic sensitive balance and then adjusted to 14% moisture content by using rice moisture tester.
Thousand grain weight (g): Grains were measured by random taking of 1000 grains that were well developed, clean and sun dried, which were collected from the middle of four rows of each plot. Finally, the moisture content of the grain yield was adjusted at 14% moisture content and weighed by using a sensitive balance.
Above ground biomass yield (gram per plot): The total above ground biomass yield produced from all the central four rows of each plot was measured at harvest after two days’ sun dried.
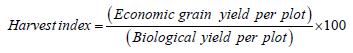
Harvest index (%): The ratio of weight of dried grain yield per plot in grams adjusted to 14% moisture content obtained from the middle four rows of each plot to the dried total weight of above ground biological yield per plot expressed in percent. Harvest index of each of the genotype was computed using the following formula:
On plant basis: Plant height (cm): The height of the plant was measured started from the base of the main stem to the tip of the tallest panicle and data recorded by a meter rule on the main tiller of 5 randomly pretagged plants in the four central rows of each plot.
Panicle length (cm): The panicle length was measured from the five panicle lengths of the main tiller randomly pre- tagged plants in centimeter started from the basal node on which the first panicle branch starts to the tip of the panicle from the middle of four rows in each plot.
Culm length (cm): Culm length was measured from ground level to the base of the panicle (neck node) and recorded from average of five randomly selected pre-tagged plants, to the nearest centimeter from four middle rows in each plot.
Flag leaf length (cm): The flag leaf length was measured from the ligule to the tip of the blade on the pre-tagged five representative selected plants and was calculated average to the nearest cm after athesis.
Fertile tillers per plant: Number of fertile tillers per plant were taken by actual counts of the total number of tillers bearing panicles per plant by taking the average number of five randomly selected pre-tagged plants that bear panicle was registered at harvest.
Number of filled grain per panicle: The number of grains were determined by counting only filled grain from five randomly selected panicles of five sample plants in each plot and averaged.
Number of total spikelets per panicle: The number of spikelet was determined by counting all spikelet (filled and unfilled) from five randomly selected panicles of five sample plants in each plot and averaged.
Number of unfilled grain per panicle: The grains that were without kernel as determined by counting only unfilled grain from five randomly selected panicles of five sample plants in each plot and averaged.
Statistical Analysis
The data were subjected to analysis of variance by using SAS 9.2 [18] and GENRES Statistical Software 7.01 [19].
Analysis of Variance (ANOVA): The relative efficiency of simple lattice design obtained was better than Randomized Complete Block Design at two locations. Therefore, the data of the mean values all experimental units were subjected analysis of variance based on simple lattice design. To perform a combined statistical analysis across location, test of homogeneity of error variances of each character for the two locations were performed by using F- test (the ratio of the largest to the smallest error variance) to the characters and the test showed homogeneity of the two locations for all characters that involved in the study. Therefore, the ANOVA was also run for the two locations separately and combined over the two locations since all characters showed homogeneity of error variance.
The analysis of variance (ANOVA) was done by using Proc GLM and Proc Lattice procedures for the data collected for grain yield and yield related traits were subjected based on simple lattice design by using SAS version 9.2 separately [18]. Then after testing the ANOVA assumptions, Fisher’s protected least significant difference (LSD) test at 5% and 1% level of significance was used for genotypes mean comparisons, whenever genotype differences were significant [20].
Estimation of variance components: Components of variance, σ2g=genotypic variance, σ2p=phenotypic variance and σ2e=error variances were calculated as suggested by Burton and Devane; Wricke and Weber [21,22].
Environmental variance (σ2e)=MSE/r. Where, MSE=error mean square and r=number of replications.
Genotypic variance ( σ2g ) = 
Where, σ2g=Genotypic variance, MSG=genotype mean square, MSgl=mean square of genotype by location interaction=number of replication and l=number of locations.
Phenotypic variance (σ2p)=σ2g+σ2gl+σ2e Where, σ2g is genotypic variance, σ2gl is genotype by location interactions, σ2e=Environmental variance) and r is number of replication.
Genotypic coefficient of variation (GCV) and phenotypic coefficient of variation (PCV) was calculated as suggested by Burton and Devane:
Phenotypic variance (σ2p)=σ2g+σ2gl+σ2e, where, σ2g is genotypic variance, σ2gl is genotype by location interactions and σ2e is environmental variance.
Where: σ2p=Phenotypic variation; σ2p=Genotypic variation and
 =Grand mean of the characters under study.
Sivasubramanian and Madhavamenon [23] GCV and PCV values were categorized as low (0-10%), moderate (10-20%) and high (20% and above).
Broad sense heritability (H2b): Heritability in broad sense (H2b) was estimated according to the formula suggested by Johnson et al. and Hanson et al. [24,25].
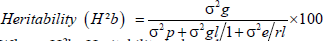
Where, H2b=Heritability in broad sense
σ2g=Genotypic variance, σ2gl=the variance of genotypes by environmental interactions, σ2e=the residual error variance σ2p=Phenotypic variance=replication and l=locations.
The Heritability was categorized as low (0-30%), moderate (30- 60%) and high (60% and above) as given by Robinson et al. [26].
Genetic advance under selection (GA): The expected genetic advance for different characters under
selection was estimated using the formula suggested by Lush and Johnson et al. [24].
GA (%)=K.H2b × σp
Where, H2b=Heritability in broad sense, σp=Phenotypic standard deviation
GA=Expected genetic advance and
k=the standardize selection differential at 5% selection intensity (K=2.063).
Genetic advance as percent of mean: Genetic advance in percentage of mean was calculated usingthe formula given by Robinson and Comstock [26].
Genetic advance in percentage of mean = 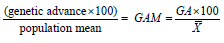
Where, GAM=Genetic advance as percent of mean
GA=Genetic advance under selection and
=Grand Mean of the trait
Genetic advance as percent mean was categorized as low (0-10%), moderate (10-20% and (≥20%) as given by Johnson et al. and Falconer and Mackay [16,24].
Results
Analysis of Variance (ANOVA)
The combined analysis of variance was revealed significant differences among rice genotypes for all traits studied (P<0.05) (Table 2). The results showed that there is a presence of acceptable amount of variability among the genotypes. This gives an opportunity for rice breeders to improve those traits through selection and hybridization to improve the desired traits. Shahriar et al. [27] also reported similar result in 34 rice genotypes for all the traits they studied. Satheeshkumar and Saravanan; Osman et al. and Fentie et al. [14,28] reported significance differences among rice genotypes evaluated in different locations. Genotype × location interactions were highly significant difference (p<0.01) except number of unfilled grain yield per panicle and 1000 grain weight but for days to maturity, plant height, panicle length, culm length, flag leaf length, number of filled grain per panicle and number of total spikelet per panicle and significant (P<0.05) for days to heading, biomass yield, grain yield and harvest index (Table 2). These significant difference of genotype × location interactions implies that differential response of genotypes under the two locations for these traits. Similar finding was previous reported by Ogunbayo et al. [29] for plant height, days to maturity, flag leaf length and panicle length. Mean squares due to location was also significant (p<0.05) for days to heading, plant height, culm length, flag leaf length, number of filled grain per panicle, number of fertile tillers per panicle, harvest index, 1000 grain weight, biomass yield and number of total spikelet per panicle (Table 2). This indicates that the phenotypic expression of characters was different at the two locations.
| Mean squares | ||||||
|---|---|---|---|---|---|---|
| Sources of variation | Location | Rep | Genotypes | Location �?Genotype | Intra block error | CV(%) |
| DF DH |
1 2240.44** |
25 16ns |
35 149.69** |
35 13.003* |
10 5.73ns |
2.82 |
| DM | 3.67ns | 150.06ns | 199.89** | 112.82** | 28.51ns | 5.7 |
| PH | 17897.98** | 64.80* | 706.98** | 140.71** | 30.74* | 4.71 |
| PL | 282.24** | 0.04ns | 6.77** | 2.34** | 2.15* | 5.52 |
| CL | 10760.61** | 33.64ns | 670.62** | 126.47** | 30.95* | 5.6 |
| FLL | 1622.75** | 0.51ns | 32.95** | 23.59** | 8.84ns | 10.37 |
| FGPP | 16409.61** | 294.69* | 173.58** | 110.67** | 58.29ns | 6.48 |
| UGY | 0.56* | 1.89* | 0.25* | 0.11ns | 0.09ns | 22.32 |
| FTP | 189.98** | 38.65** | 3.46** | 2.83** | 4.66** | 15.99 |
| NTSPP | 11481.12** | 377.00* | 183.82** | 125.48** | 71.32ns | 6.61 |
| TGW | 201.24** | 25.33ns | 17.85* | 12.54ns | 2.50ns | 11.66 |
| BY | 44.11** | 15.41* | 7.55** | 2.01* | 1.64ns | 11.28 |
| GY | 524929.20ns | 118043.80ns | 3264619.3** | 1490636.3* | 936552.1ns | 13.96 |
| HI | 0.04** | 0.024** | 0.005** | 0.0034* | 0.002* | 12.97 |
CV=Coefficient of Variation and DF=Degree of Freedom “*”=Significant at 5% probability level and “**”=Highly significant at 1% probability level and NS=Non-Significant. BY=Biomass Yield, DH=Days to Heading, CL=Culm Length, DM=Days to Maturity, FGPP=Filled grain per panicle, FLL=Flag Leaf Length, FTP=Fertile Tiller per plant, GY=Grain Yield kg ha-1, HI=harvest Index, NTSPP=Number of Total Spikelet Per Panicle, PH=Plant Height, PL=Panicle Length,TGW=Thousand Grain Weight, UGY=Unfilled grain per panicle.
Table 2: Mean square values from analysis of variance, and coefficient of variation (CV) for 14 traits of 36 ricegenotypes evaluated at two locations (Pawe and Fogera) during the 2015/2016 main cropping season.
Phenotypic and genotypic variability
Estimates of genotypic and phenotypic variances, genotypic coefficient of variation (GCV), and phenotypic coefficients of variation (PCV) are indicated in Table 3. The genotypic coefficients of variation (GCV) ranged from 7.0% for days to maturity to 35.33% for culm length (Table 3). However, phenotypic coefficients of variation (PCV) ranged from 10.60% for days to maturity to 39.23% for culm length (Table 3).
| Range | Variances | Coefficient of Variation (%) | ||||||||
|---|---|---|---|---|---|---|---|---|---|---|
| Traits | Mean±SE | Min | Max | s2p | s2g | GCV | PCV | H2b (%) | GA | GAM |
| DH | 98.07±6.90 | 82.50 | 110.00 | 277.21 | 136.69 | 11.92 | 16.98 | 49.31 | 11.89 | 12.13 |
| DM | 133.38±7.68 | 116.50 | 145.50 | 199.88 | 87.07 | 7.00 | 10.60 | 43.56 | 8.37 | 6.28 |
| PH | 83.77±14.37 | 62.60 | 110.05 | 706.98 | 566.27 | 28.41 | 31.74 | 80.10 | 39.26 | 46.87 |
| PL | 19.16±1.44 | 16.35 | 22.40 | 6.77 | 4.44 | 10.99 | 13.58 | 65.50 | 2.84 | 14.83 |
| CL | 66.02±13.91 | 46.05 | 91.40 | 670.62 | 544.15 | 35.33 | 39.23 | 81.14 | 38.99 | 59.06 |
| FLL | 21.34±3.31 | 16.15 | 30.95 | 32.95 | 9.36 | 14.34 | 26.90 | 28.41 | 1.79 | 8.39 |
| FGPP | 92.93±7.63 | 74.80 | 109.50 | 173.59 | 62.92 | 8.54 | 14.18 | 36.25 | 5.92 | 6.37 |
| UGPP | 2.84±0.79 | 1.00 | 4.95 | 2.20 | 0.84 | 32.32 | 52.41 | 38.03 | 0.72 | 25.32 |
| FTP | 7.29±0.93 | 5.85 | 9.40 | 3.46 | 0.63 | 10.92 | 25.57 | 18.24 | 0.30 | 4.10 |
| NTSPP | 97.33±7.80 | 78.95 | 114.35 | 183.82 | 58.33 | 7.85 | 13.93 | 31.73 | 4.99 | 5.13 |
| BY | 8.17±1.56 | 5.28 | 11.15 | 17.55 | 5.31 | 28.85 | 33.67 | 73.41 | 3.56 | 43.63 |
| TGW | 24.42±2.26 | 20.21 | 28.35 | 7.55 | 5.54 | 9.44 | 17.31 | 30.00 | 1.41 | 5.78 |
| GY | 5370.00±10650 | 2886.00 | 6759.00 | 3.27 | 1.77 | 24.80 | 33.65 | 54.35 | 1.49 | 27.77 |
| HI | 0.27±0.04 | 0.17 | 0.36 | 0.005 | 0.001 | 12.87 | 25.25 | 25.97 | 0.02 | 6.89 |
Phenotypic variance(s2p) genotypic variance (s2g), genotypic coefficient of variation (GCV), phenotypic coefficient of variation (PCV), broad sense heritability (h2b) and genetic advance (GA), genetic advance as percent of mean (GAM), Min=Minimum and Max=Maximum, SD=standard deviation. BY=Biomass Yield, DH=Days to Heading, CL=Culm Length, DM=Days to Maturity, FSPP=Filled Grain per panicle, FLL=Flag Leaf Length, FTP=Fertile Tiller per plant, GY=Grain Yield kg ha-1, HI=harvest Index, NTSPP= Number of Total Spikelet Per Panicle, PH=Plant Height, PL=Panicle Length, TGW=Thousand Grain Weight, UGY= Unfilled Grain per panicle.
Table 3: Estimation of mean, standard error, range, variances, coefficients of variations, broad sense heritability (H2b), genetic advance and genetic advance as percent of mean in 14 quantitative traits of 36 lowland rice genotypes evaluated across locations in 2015/2016 cropping seasons.
Heritability and genetic advance
Heritability in broad sense, genetic advances, and genetic advances as percent mean are showed in Table 3. Heritability in broad sense estimates of the 14 quantitative traits ranged from 18.24% for fertile tillers per plant to 81.14% for culm length across locations. Moreover, genetic advance varied from 0.02% for harvest index and 39.26% for plant height whereas genetic advance as percent of means ranged from 4.10% for fertile tillers per plant and 59.06% for culm length (Table 3).
Means and range of different characters under observations
The range and mean of genotypes for all studied traits also indicated wide ranges of variation which also revealed possible amount of variability among the genotypes (Table 3). Relatively high range performance revealed among the studied traits, grain yield (2886.0-6759.0 kg/ha) across locations with a mean grain yield of 5370.0 kg/ ha. The genotypes were significantly varied for grain yield and about eighty percent (80.5%) of the genotypes had higher grain yield than the standard check (Ediget) and 97.2% of them produced higher grain yield than the local check (X-Jigna). Among the genotypes, IR 83383-B-B- 141-2, IR 83372-B-B-115-4, IR 83372-B-B-115-3, IR 83383-B-B-141- 1 and IR80463-B-39-3 were the top yielders with corresponding grain yield of 6.759, 6.688, 6.685, 6.520 and 6.507 ton/ha, respectively. The local check (X-Jigna) was the lowest yielder with the mean grain yield of 2886.3 Kg/ha. Therefore, the presence of such range of variations of the traits indicated that the existence of enough variability among the genotypes which is the source of variable genetic materials. The grand mean of days to heading was 98.06 with a range of 82.5 to 110.0 (Table 3).
The maximum days to heading (110.0 days) were recorded in the genotype PSBRC44 and the earliest was recorded in CHOMRONG genotype (82.5 days). Mulugeta [8] also reported the variability among the genotypes for days to heading. The grand mean of maturity days was 133.38 with a maximum maturity period of 145 days that was registered for IR 75518-84-1-1-B genotype and the early maturity days was (116.5 days) which was recorded by CHOMRONG genotype. Among 36 genotypes, 44.4% exhibited days to maturity lower than the overall mean indicating that those genotypes were earlier maturing as compared to the others. On the one hand, as compared to the standard check variety (Ediget) 30.5% of the genotypes showed earlier maturity period. However, only 8.3% of genotypes were earlier maturing than the local check variety (X-Jigna). This suggested the chance of selecting early genotypes which can escape terminal moisture stress.
Minimum and maximum plant height ranged from 62.60 cm to 110.05 cm recorded for IR 81047-B-106-2-4 and IR 75518-84-1-1-B genotypes respectively, with a mean of 83.77 cm (Table 3). According to IRRI low land rice plant height is classified as semi-dwarf (less than 110 cm), intermediate (110-130 cm) and tall (more than 130 cm). Based on this classification, in the present study 94.4% of the tested genotypes group under the semi-dwarf class whereas the remaining 5.6% (IR 75518-84-1-1-B and CHOMRONG) genotypes fall within the tall statured class. This indicated that the tested genotypes had inherent variability in stature to develop lodging resistant varieties (semi-dwarf) that will have higher response to nitrogen application. Mitiku and Shahriar [27] also reported variation in plant height in the rice genotypes they evaluated. Number of fertile tillers per plant ranged from 5.85 to 9.4 for the genotypes ARCCU16Bar-13-2-16-2-1-1) and (IR76999-52-1-3-2), respectively.
The mean value of panicle length recorded was 19.16 cm with maximum value of 22.4 cm and minimum of 16.35 cm for IR 75518- 18-1-2-B and the standard check (Ediget), respectively. According to Bioversity International [19], panicle length is classified as very short (<11 cm), short (~15 cm), medium (~25 cm), long (~35 cm) and very long (>40 cm). Thus, based on this argument, the present finding showed that there is enough medium variability for panicle length among the genotypes for improving panicle architecture and grain yield due to high association of this trait that determines the number of grains it can hold. The grand mean of culm length recorded was 66.02 cm with the maximum and minimum value of 91.40 and 46.05 cm respectively. On the other hand, the maximum and minimum values recorded for flag leaf length were 30.95 and 16.15 cm, respectively with a mean value of 21.34 cm.
Thousand grain weight ranged from 20.21 to 28.35 g/plot for the genotype IR80420-B-22-2 and IR 75518-18-1-2-B, respectively. Karim et al. [30] reported that mean values ranged from 5.9 to 30.72 g for 1000 grain weight. Mean values for harvest index varied from 17% for local check variety (X-Jigna) to 36% for IR76999-52-1-3-2 which indicating variability among the tested genotypes in their efficiency ability in partitioning assimilate into grain yield. Moreover, the genotypes IR76999-52-1-3-2 (36%), YUNJING 23 (32%), IR 81047- B-106-2-4 (32%) and WAB880-1-32-1-2-P1-HB (31%) were the most efficient than the standard check which had harvest index of 24.5%. The maximum and minimum above ground biomass yields were harvested from WAB376-B-10-H3 (11.15 kg plot-1) and IR 83222-F11-167 (5.28 kg plot-1). Based on these results, 50% or 18 genotypes exceeded the overall mean (8.17 kg plot-1) of the tested genotypes while genotypes exceeded 72.2% and 75% of the standard check and local check, respectively.
Discussion
Phenotypic coefficients of variation (PCV) and genotypic coefficients of variation (GCV) were categorized as low (0-10%), moderate (10-20%) and high (>20%) as indicated by Sivasubramanian and Madhavamenon [23]. Therefore, according to the classification high PCV and GCV values were recorded for plant height, culm length, number of unfilled grain per panicle, grain yield and biomass yield, which suggests the possibility of improving this trait through selection. Similar results were also reported by Satheeshkumar and Saravanan et al. [28]; Hoque [31] and Devi et al. for plant height and similarly Pratap et al. for biomass yield and plant height. On the other hand, the estimates of GCV and PCV were low in the present study for days to maturity (7.00%, 10.60%) (Table 3). Similar findings were reported by Pandey [32]. In general, a high coefficient of variability indicates that there is a scope of selection and improvement of these traits. Low values indicates the need for creation of variability either by hybridization or mutation followed by selection [33].
The magnitude of phenotypic coefficient of variation (PCV) estimates in the present study was found to be slightly higher than their respective genotypic coefficient of variations (GCV) for all the studied characters which might be the result of influence of environment on the development of characters’ period. Similar report noticed earlier by many researchers [29,34] in rice. However, the narrow magnitude of difference between phenotypic and genotypic coefficients of variations were recorded for characters such as days to maturity, plant height, biomass yield, culm length and panicle length indicating limited influence of environment in the expression of these characters. The result is in agree with Idris and Mohamed [33] who reported small differences between genotypic and phenotypic coefficients of variations for plant height and panicle length. Thus, selection based on phenotypic performance of these characters would be effective to bring about considerable genetic improvement. But, there was considerable difference between the phenotypic and genotypic coefficient of variations for the rest traits which, indicates greater effects of environmental factors in the phenotypic expression of these characters. Thus, selection based on phenotypic performance of these characters would be ineffective to bring about considerable genetic improvement of these traits in the genotypes considered in the current study.
Heritability was classified as low (below 30%), medium (30-60%) and high (above 60%) as suggested by Johnson et al. [24]. Considering this delineation, high heritability values were observed for culm length (81.14%) followed by plant height (80.10%), biomass yield (73.41%) and panicle length (65.50%). High heritability in broad sense values indicate that the characters under study are less influenced by environment in their expression. Therefore, the rice breeders may make superior genotypes selection based on phenotypic performance for these traits.
Days to heading (49.31%), days to maturity (43.56%), number of filled grain per panicle (36.25%), number of unfilled grain per panicle (38.03%), number of total pikelet per panicle (31.73%) and grain yield (54.35%) had medium heritability which indicates that improvement can be made through simple selection. The results were mostly supported by the reports made earlier in rice by Krupakar and Pandey [32] for days to heading, plant height, panicle length and biomass yield per plot in rice. In contrast, flag leaf length (28.41%), number of fertile tiller per plant (18.24%), 1000 grain weight (29.73%) and harvest index (25.97%) had low heritability which indicates greater role of environment on the expression of the traits. Thus, direct selection for these traits will be ineffective. Therefore, methods of selection based on families and progeny testing are more effective and efficient. Similar results were also reported by other investigators [14,35,36] for number of fertile tillers per plant. Akinwale et al. [34] reported low heritability for 1000 grain weight. In contrary, Fentie et al. [14] and Osman et al. reported high broad sense heritability for 1000 grain weight. Dutta et al. and Rai [15,37] also observed high broad sense heritability finding for number of fertile tillers per plant and harvest index. On the contrary, Rai and Yadav et al. [15,38] reported high broad sense heritability for flag leaf length and harvest index. Shahriar et al. [27] registered high heritability for 1000 grain weight.
Heritability alone provides no an indication of the amount of genetic improvement that would result from selection of individual genotypes. Hence, knowledge about heritability coupled with genetic advance and genotypic coefficient of variations are most useful. Thus, in the present study, high to medium heritability coupled with high genotypic coefficients of variation (GCV) and high genetic advance as percentage of mean were recorded by plant height followed by culm length, biomass yield, grain yield and number of unfilled grain per panicle which indicates that the traits were simply inherited in nature and controlled by few major genes or possessed additive gene effects. Hence, making based on simple selection could be effective for improving those characters. Similar result was reported by Osman et al. who tested thirteen upland rice genotypes. Rai et al. [15] also by evaluated 40 rice genotypes and observed similar results for biological yield.
Heritability in conjunction with genetic advance would give a more reliable selection value [24]. In the present finding the genetic advance as percent of mean was ranged from 4.10% for number of fertile tillers per plant to 59.06% for culm length across locations. According to Johson et al. [24] genetic advance as percent of mean classified as low (<10%), moderate (10-20%) and high (>20%). Based on this argument, in the present study, traits such as plant height (46.87%), culm length (59.06%), biomass yield (43.63%), grain yield (27.77%) and number of unfilled grain per panicle (25.32%) gave high genetic advance as percent of mean while moderate genetic advance as percent of mean was computed for days to heading (12.13%) and panicle length (14.83%). These traits also had high and moderate heritability. Therefore, selection based on the above traits with high and moderate genetic advance as percent of mean, result in the improvement of the genotypes for the traits. The present finding is in corresponding to the work of Rahman et al. and Shrivastava et al. [39] for number of unfilled grain per panicle. Shrivastava et al. [40] noticed similar result for culm length, number of unfilled grain per panicle, biomass yield and grain yield. The finding is supported also by Mulugeta [8] for biomass yield and number of unfilled grain per panicle.
Low estimates of genetic advance as per cent mean was also noticed for days to maturity (6.28%), flag leaf length (8.39%), number of fertile tiller per plant (4.10%), number of filled grain per panicle (6.37%), number of total spikelet per panicle (5.13%), 1000 grain weight (5.78%) and harvest index (6.89%), respectively (Table 3). This indicates the characters governed by non-additive gene action and heterosis breeding will be useful. Similar results were reported by Hoque [31] for number of fertile tillers per panicle.
Conclusion
In conclusion, the present study identified the presence of adequate genetic variability among 36 tested genotypes. Hence, the information generated from this study, rice breeder can be exploited for future rice breeding program. The study was also carried out for one season and at two locations. Therefore, it is advisable to repeat the study at least more than one season considering major rice growing areas to make sound recommendations. Moreover, it is recommended that future rice research explore molecular means to further confirm the outcome of this study findings.
Conflict of Interest
There is no conflict of interest among the authors or anybody else.
Acknowledgements
First I would like to thank Ethiopian Institute of Agricultural Research for funding the research work and Jimma University College of Agriculture and Veterinary Medicine for hosting the study. Many thanks forwarded to Pawe Agricultural Research Center and Fogera National Rice Research and Training Center for giving me the opportunity to use research field, allocating the required labor, and materials for field work.
References
- Hooker JD (1979) The flora of British India. Vol 2.Reeve L & Co., Kent, England, p: 25.
- Singh SK, Bhati PK, Sharma A, Sahu V (2015) Super hybrid rice in China and India: current status and future prospects. Int J Agric and Biol17: 221-232.
- Zhao Z (2011) New archaeo botanic data for the study of the origins of agriculture in China. Current Anthropology52: 295-306.
- Gross BL, Zhao Z (2014) Archaeological and genetic insights into the origins of domesticated rice. Proceedings of the National Academy of Sciences 111:6190-6197.
- Ansari MUR, Shaheen T, Bukhari S, Husnain T (2015) Genetic improvement of rice for biotic and abiotic stress tolerance. Turkish Journal of Botany 39: 911-919.
- NRRDSE (2010) Federal Democratic Republic of Ethiopia Ministry of Agriculture and Rural Development (MoARD). Addis Ababa.
- Assefa K, Alemu D, Shiratori K, Kirub A (2011) Challenges and opportunities of rice in Ethiopian Agricultural Development. Ethiopian Institute of Agricultural Research, Addis Ababa,p: 10.
- MulugetaBJ,Firew M (2015)Genetic variability and association among yield and yield related traits in selected upland rice (Oryza sativa L. and OryzaglaberrimaSteud) Genotypes. An MSc Thesis presented to the School of Graduate Studies of Alemaya, University, Ethiopia.
- Seyoum M, Gebrekidan H (2005) Effects of N and P Fertilizers on Yield and N Uptake of Flooded Rice Grown on Vertisols of Fogera Plain of Ethlopia. Indian Journal of Fertilisers1: 47.
- Gebrekidan H, Seyoum M (2006) Effects of mineral N and P fertilizers on yield and yield components of flooded lowland rice on vertisols of Fogera Plain, Ethiopia. Journal of Agriculture and Rural Development in the Tropics and Subtropics107: 161-176.
- Liu Z, Xu A, Long B (2011) Energy from combustion of rice straw: status and challenges to China. Energy and Power Engineering 3:325.
- FAOSTAT Statistics Division online database (2015) Statistical database of the food and agriculture of the united nations.
- DawitA (2015) Rice in Ethiopia: Progress in production increase and success factors. 6th CARD General Meeting.
- Fentie D, Alemayehu G, Siddalingaiah M, Tadesse T (2014) Genetic variability, heritability and correlation coefficient analysis for yield and yield component traits in upland rice (Oryza sativa L.). East African Journal of Science8: 147-154.
- Rai SK, Suresh BG, Rai PK, Lavanya GR, Sandhya (2014)Genetic variability, correlation and path coefficient studies for grain yield and other yield attributing traits in rice (Coryza Sativa L.). International Journal of Life Sciences Research 2: 229-234.
- Falconer DS, Mackay FC (1996) Introduction to quantitative genetics. Longman, New York, p: 464.
- BioversityInternational,IRRI, WARDA (2007) Descriptors for wild and cultivated rice (Oryzaspp).International Rice Research Institute Los Banos, Cotonou, Benin, p: 63.
- SAS Institute Inc (2008)SAS/STAT® 9.2 User’s Guide. SAS Institute Inc., Cary, NC, USA.
- Fisher RA, Yates F (1963) Statistical tables for biological, agricultural and medical research. Longmen Group Limited, London, p: 146.
- GENRES (1994) A statistical package for genetic researchers. Version 7.01, Pascal Institute Software Solution(PISS).
- Burton GW, Devane EH (1953) Estimating heritability in tall fescue (Festucaarundinacea) from replicated clonal material. Agronomy Journal45:478-481.
- Wricke G, Weber WE (1986) Quantitative genetics and selection in plant breeding. Walter de Gruyter and Co. Berlin, Germany.
- Sivasubramanian S, Madhavamenon P (1973) Genotypic and phenotypic variability in rice. Madras Agric J60: 1093-1096.
- Johnson HW, Robinson HF, Comstock RE (1955) Estimates of genetic and environmental variability in soybeans. Agronomy journal47: 314-318.
- Hanson G, Robinson HF, Comstock RE (1956) Biometrical studies on yield in segregating population of Korean Lespedeza. Agron J 48:268-274.
- Robinson HF, Comstock RE, Harvey PH (1949) Estimates of heritability and the degree of dominance in corn. Agronomy Journal.
- Shahriar MH (2014) Morphological characterization and SSR-based molecular screening of advanced breeding lines of T-Aman rice for short growth duration. A thesis presented to the School of Graduate Studies of Bangladesh Agricultural University.
- Satheeshkumar P, Saravanan K (2012) Genetic variability, correlation and path analysis in rice (Oryza Sativa L.). International Journal of Current Research 4:082-085.
- Ogunbayo SA, Ojo DK, Sanni KA, Akinwale MG, Toulou B, et al. (2014) Genetic variation and heritability of yield and related traits in promising rice genotypes (Oryza sativa L.). Journal of Plant Breeding and Crop Science6:153-159.
- Karim D, Siddique NE, Sarkar U,Hasnat UZ, Sultana J (2014) Phenotypic and genotypic correlation co-efficient of quantitative characters and character association of aromatic rice. Journal of Bioscience and Agriculture Research1: 34-46.
- Hoque A (2013)Morpho-physiological and molecular characterization of rice (Oryza sativa L.) advanced breeding lines for earliness. Doctoral dissertation presented to Sokoine University of Agriculture, Morogoro, Tanzania.
- Pandey VR, Singh PK, Verma OP, Pandey P (2012) Inter-relationship and path coefficient estimation in rice under salt stress environment. International Journal of Agricultural Research7: 169-184.
- Tiwari DK, Pandey P, Tripathi S, Giri SP, Dwivedi JL (2011) Studies on genetic variability for yield components in rice (Oryza sativa L.). 3: 76-81.
- Idris AE, Justin FJ, Degas YMI, Abuali AI (2012) Genetic variability and inter relationship between yield and yield components in some rice genotypes. Am J Exp Agric 2:233-239.
- Idris AE, Mohamed KA (2013) Estimation of genetic variability and correlation for grain yield components in rice (Oryza sativa L.).Global Journal of Plant Ecophysiology3: 1-6.
- Akinwale MG, Gregorio G, Nwilene F, Akinyele BO, Ogunbayo SA, et al. (2011) Heritability and correlation coefficient analysis for yield and its components in rice (Oryza sativa L.). African Journal of Plant Science5: 207-212.
- Dutta P, Partha ND,Borua PK (2013) Morphological traits as selection indices in rice: A statistical view. Universal Journal of Agricultural Research1:85-96.
- Yadav SK, Suresh BG, Pandey P, Kumar B (2010) Assessment of genetic variability, correlation and path association in rice (Oryza sativa L.). Journal of Bio-Science18: 1-8.
- Shrivastava A, Mishra DK, Koutu GK,Singh SK (2014) Heritability and genetic advance estimation from parental lines of hybrid rice. International Journal of Scientific Research 3: 11-3.
- Shrivastava A, Mishra DK, Koutu GK (2015) Estimation of genetic parameters of variability for yield and its attributing traits in parental lines of hybrid rice. Plant Archives 15: 571-574.
Relevant Topics
- Agricultural science
- Agronomy
- Climate impact on crops
- Crop Productivity
- Crop Sciences
- Crop Technology
- Field Crops Research
- Hybrid Seed Technology
- Irrigation Technology
- Organic Cover Crops
- Organic Crops
- Pest Management
- Plant Genetics
- Plant Breeding
- Plant Nutrition
- Seed Production
- Seed Science and Technology
- Soil Fertility
- Weed Control
Recommended Journals
Article Tools
Article Usage
- Total views: 12514
- [From(publication date):
April-2017 - Nov 23, 2024] - Breakdown by view type
- HTML page views : 10741
- PDF downloads : 1773