Research Article Open Access
Genetic Structure in FCV Tobacco Population as Assessed by Multi-locus Genotyping Using SSR Markers
| Ganesh CT1*, Saiprasad GVS1, Mohan Raju B2, Sheshshayee MS2 and Udayakumar M2 | ||
| 1 Corporate R & D, ITC R&D Centre, Bangalore 560058, India | ||
| 2 Department of Crop Physiology, UAS, GKVK, Bangalore 560065, Inida | ||
| Corresponding Author : | Dr. Ganesh CT Corporate R & D, ITC R&D Centre Bangalore 560058, India Tel: +91-9916401982 E-mail: ganesh.thimmegowda@itc.in |
|
| Received March 28, 2014; Accepted April 25, 2014; Published April 27, 2014 | ||
| Citation: Ganesh CT, Saiprasad GVS, Mohan Raju B, Sheshshayee MS and Udayakumar M (2014) Genetic Structure in FCV Tobacco Population as Assessed by Multi-locus Genotyping Using SSR Markers. Adv Crop Sci Tech 2:127. doi: 10.4172/2329-8863.1000127 | ||
| Copyright: © 2014 Ganesh CT, et al. This is an open-access article distributed under the terms of the Creative Commons Attribution License, which permits unrestricted use, distribution, and reproduction in any medium, provided the original author and source are credited. | ||
Related article at Pubmed Pubmed  Scholar Google Scholar Google |
||
Visit for more related articles at Advances in Crop Science and Technology
Abstract
Association mapping studies largely depend on the genetic nature of the population. An understanding of genetic structure of population assists in designing apt studies that accounts the dynamics of variability in population. Current study is aimed at analyzing genetic structure of tobacco (Nicotiana tabacum L.) population consisted of 135 FCV (Flue Cured Virginia) genotypes using multi-locus genotyping with mapped Simple Sequence Repeat (SSR) markers. 25 unlinked SSR markers delineated 135 genotypes revealing a total of 85 alleles with an average of 3.4 alleles per locus. Contrasting allelic frequencies were observed in most of the loci studied. Bayesian method of inference employed the genotyping data to derive genetic structure information from the population. High FST measures in the subpopulations (0.44, 0.09 and 0.29 at population level K=3) indicated high inbreeding coefficient signifying a strongly structured population. Evolutionary dissimilarity estimate using DARwin also supported the finding of resilient structure in the population. These findings were found highly useful in designing appropriate mapping strategies for tobacco breeding.
| Abstract |
| Association mapping studies largely depend on the genetic nature of the population. An understanding of genetic structure of population assists in designing apt studies that accounts the dynamics of variability in population. Current study is aimed at analyzing genetic structure of tobacco (Nicotianatabacum L.) population consisted of 135 FCV (Flue Cured Virginia) genotypes using multi-locus genotyping with mapped Simple Sequence Repeat (SSR) markers. 25 unlinked SSR markers delineated 135 genotypes revealing a total of 85 alleles with an average of 3.4 alleles per locus. Contrasting allelic frequencies were observed in most of the loci studied. Bayesian method of inference employed the genotyping data to derive genetic structure information from the population. High FST measures in the subpopulations (0.44, 0.09 and 0.29 at population level K=3) indicated high inbreeding coefficient signifying a strongly structured population. Evolutionary dissimilarity estimate using DARwin also supported the finding of resilient structure in the population. These findings were found highly useful in designing appropriate mapping strategies for tobacco breeding. |
| Keywords |
| Nicotianatabacum; Population structure; SSR markers; Trait mapping |
| Introduction |
| Tobacco (Nicotianatabacum L., 2n = 48) has been cultivated for thousands of years and has served as one of the major trade commodity in different cultures. It has been one of the most important commercial crops in the world. In the past several decades, this plant has found yet another use, serving as a widely utilized model system in plant-cell culture and genetic-engineering research [1]. Because of its economic importance and value as a biological research tool, numerous investigations have been undertaken to examine its evolutionary origin and genome structure and organization. Morphological, karyotypical, and physiological characters have already been used to study the genetic background of tobacco [2,3]. However, morphological characters usually vary with the environmental conditions in which they are cultivated. The number of karyotypical characters is limited and the study of genotypic diversity based on isozyme variation is restricted to a few polymorphic enzyme systems encoded by a small number of loci [4]. Among the different agricultural crops in India, tobacco has been little studied for genetic improvement. Globally available literature on tobacco genetics is also scanty. |
| Genetic improvement in crop plants including tobacco largely depends on the population dynamics such as genetic diversity and population structure. Though a large number of tobacco varieties of different commercial types have been developed in India, their genetic base is unknown [5]. Population genetic structure data empowers breeder for rational use of genetic resources to suitably design breeding strategies to develop superior tobacco varieties. Population subdivisions have critical effects on the dynamics of alleles in populations as well as on the statistical tests imposed on genetic data sampled from such individuals. It is well known that population subdivision affects the nature of alleles in a population under the influence of mutation, drift, and selection; hence, the eventual fate of an allele is affected by population subdivision [6]. Therefore, facts on genetic structure of the population are vital for development of appropriate and informative mapping populations for trait mapping and subsequent marker assisted breeding. |
| Microsatellite markers (also known as Simple Sequence Repeats; SSRs) have been established in different crop plants as highly informative markers. The fact that SSR markers are co-dominant, abundant in genome, multi-allelic and can be reliably automated to analyze genetic parameters in Nicotiana makes them attractive as genetic markers. Availability of mapped SSRs from tobacco [7,8] in Solanaceae Genomics Network (SGN) aids in efficient use of these microsatellite markers and facilitates the integration of genetic divergence information in tobacco breeding applications. |
| With this background, we focused to analyze the genetic structure of FCV tobacco population to enable adoption of an appropriate mapping strategy for maker based trait tagging. Particulars on population genetics are critical for effective utilization of genetic variability in tobacco breeding for sustainable crop improvements. |
| Materials and Methods |
| Plant material and populations |
| Core germplasm collection of FCV tobacco population consisting of 135 genotypes (Appendix I) representing the total available FCV tobacco gene pool was used for the study. Leaf materials from these genotypes were collected from the field plantation maintained at Indian Leaf Tobacco Development (ILTD) germplasm at Rajahmundry in Andhra Pradesh, India. For those genotypes in which leaves were not readily available, seedlings were raised in vermiculite media under laboratory conditions and emerging young leaves were used for DNA isolation. During field sampling, leaves were immediately placed in dry ice, transported to lab and stored at -80°C until further analysis. Disease-free healthy leaves were cleaned thoroughly with sterile water for isolating good quality DNA. |
| DNA isolation and SSR genotyping |
| DNA from plant material was isolated using DNeasy Plant Mini Kit 250 (Qiagen, USA). Protocol was suitably optimized to isolate good quality DNA from all the lines. DNA quality was tested under agarose electrophoresis at 0.8% gel concentration and also quantified using NanoDrop 8000 (Thermo Fisher Scientific Inc., USA). SSR markers representing all the linkage groups were selected from SGN database (www.sgn.cornell.edu) based on tobacco linkage map published by Bindler et al. [7]. Oligonucleotide primers were synthesized from Sigma Genosys and their suitable PCR amplification conditions were optimized. |
| PCR conditions were optimized with minor modifications to Don et al. [9] protocol in 25 µl reaction with ~10 ng of template DNA, 0.2 µM of each primer, 100 µM of each dNTPs, 10 mM Tris-Cl (pH 8.3), 50 mM KCl, 1.5 mM MgCl2, and 1 unit of Taq polymerase (Sigma Inc.). PCR amplification conditions were as follows; Initial denaturation at 94°C for 5 minutes, followed by 40 cycles of 30 seconds at 94°C, 30 seconds at annealing temperature of respective primer pair and an extension of 1 minute at 72°C. The final extension was at 72°C for 5 min. A two-stage touchdown amplification profile was designed where specific PCR products were not found. Reactions were conducted with a 1°C reduction in annealing temperatures at each cycle from 65°C to 55°C, followed by 25 cycles at an annealing temperature of 55°C. PCR products were subjected to electrophoresis on 1.5% agarose gel stained with ethidium bromide (0.5 µl/10 ml of gel) at 150 V to identify the optimum annealing temperature for each of the SSR primers. For high resolution separation of SSR amplicons, a reliable Polyacrylamide Gel Electrophoresis (PAGE) protocol was suitably developed for tobacco. The samples were prepared for PAGE electrophoresis by adding 4.0ul of Gel loading buffer (0.25% bromophenol blue; 0.25% xylene cyanol; 30% Glycerol) to the reaction mixtures. Samples were electrophoresed on 10% non-denaturing polyacrylamide gels (gels were prepared in Tris-borate buffer, pH 8.0) using a mini PAGE apparatus. Each gel was run for 1.5 hrs at a 150-V with constant current. The DNA bands were visualized by staining with ethidium bromide. The sizes of the PCR products were estimated by comparison to an accompanying standard size 50bp and 20 bp ladder. With this optimized PCR and PAGE conditions, all the SSR primers were screened to test their suitability for genotyping. The sequences of SSR primers and their amplicons sizes are presented in Appendix II. Final genotyping was done on 15 µl reaction volume and amplicons were analyzed on PAGE for ideal fragments analysis. Profiles were scored for each marker across all the genotypes and the data was analyzed. |
| Data Analysis |
| Bayesian model-based program STRUCTURE (10,11) and DARWin 5.0 [12] were used to analyze the genotyping data. Using a burn-in length of 20,000 and a run length of 100,000, STRUCTURE was run with admixture model with correlated allele frequencies. Ten independent simulations were run for each level of K (the number of populations). Statistical estimation of the K value was possible with the LnP(D) output value from the STRUCTURE [13]. LnP(D) is the logarithmic likelihood of the observed genotype distribution in K clusters and it is maximum at optimal K level [10]. Phylogenetic analysis based on neighbor-joining model using Nei’s distances was also performed to understand the genetic dynamics of the population. The polymorphism information content (PIC) of each microsatellite locus was determined as described by Weir [14] as PIC = 1-S Pi2, where Pi is the frequency of the ith allele in the genotypes examined. Allele frequencies were compared between populations using Wright's F statistics to calculate the fixation index FST. FST is a measure of between population variance and gives the proportion of overall diversity which is attributable to differences between populations [15]. |
| The distribution of genetic variation within and among the subpopulations was analyzed using F statistics [16], where 1 - FIT = (1 - FIS) (1 - FST). FIT is the correlation between individuals within the total sample (i.e. total fixation index), and is made up of two components; FIS, which describes deviations from Hardy-Weinberg expectations within subpopulations, and FST which measures differentiation between subpopulations. FST was calculated for each allele at each locus, from the relationship FST= s2/p(l - p), where s2 is the total variance among samples, and p is the mean allelic frequency. To determine the extent to which any deficits of heterozygotes could be attributed to variance in allelic frequencies among the subpopulations (the Wahiund effect), the relationship between heterozygote deficits and variance of allelic frequencies among subpopulations was calculated as s2/He - H0 (where s2 is the variance summed for each locus, He is the expected heterozygosity, and H0 is observed heterozygosity for the total population as detailed by Johnson and Black [17]). |
| Results |
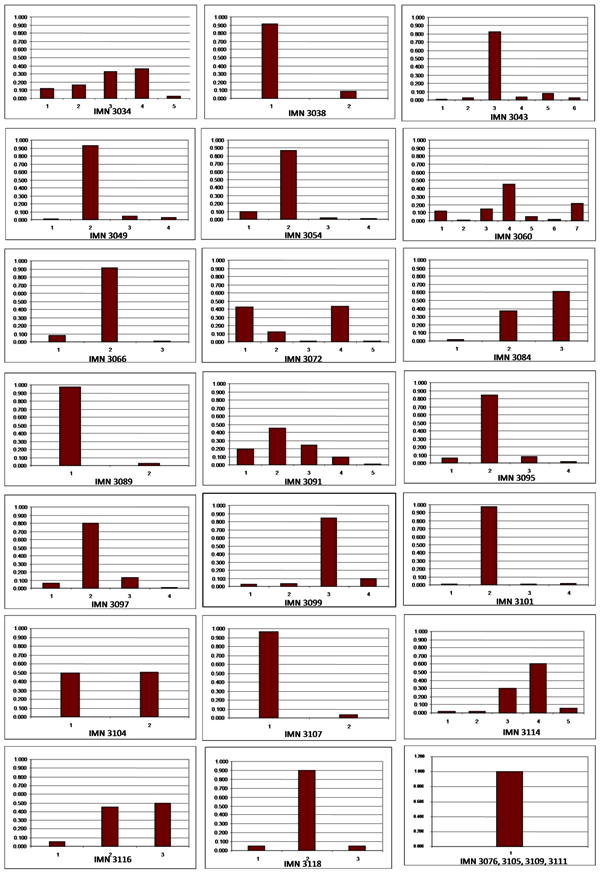
| SSR markers were successfully amplified in accordance with their reported amplicon sizes. Most of the tandem nucleotide repeats selected for study were of three base repeats as they are easy scorable for their allelic variations upon polyacrylamide gel based genotyping as used by many researchers [18]. A total of 85 alleles were detected at 25 unlinked loci as assessed by SSR primer pairs spanning all the 24 linkage groups [7] of tobacco. The PIC values ranged from 0.26 to 0.73 with an average of 0.48. The number of alleles per SSR locus ranged from 2 to 7 with an average of 3.4 alleles per locus. Microsatellite loci IMN3099 was the most informative locus with 7 alleles detected across the population. The data on allelic frequencies at different loci tested are presented in Figure 1. |
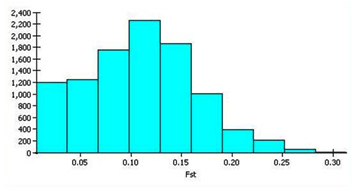
| Allelic data when analyzed revealed significant information on population heterozygosity levels and FST values. At a metapopulation level (assigned K= 1), the average distances (expected heterozygosity) between individuals in entire population was 0.2941 with a mean FST value of 0.1078 (Figure 2). This signifies the deficit in heterozygosity in the metapopulation. |
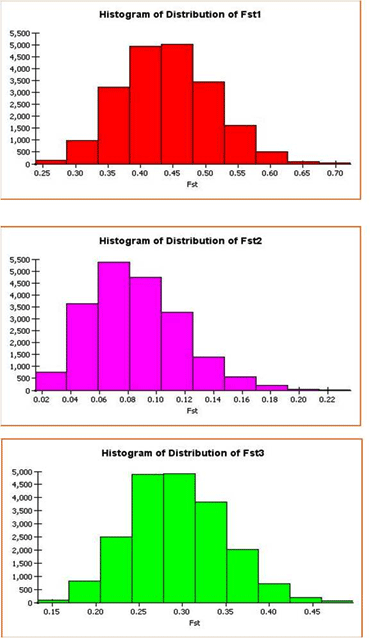
| Different levels of K were statistically assigned to the population to understand the genetic nature of the population variation. Structure model analyzes the data on the basis of posterior probability of goodness of fit. At varied levels of assigned K, the maximum LnP(D) output determines the optimum levels for consideration. Data was analyzed for varied levels of K up to 15 and highest LnP(D) was observed at K = 3. Average expected heterozygosity between individuals in same cluster for these three populations were 0.1887, 0.3589 and 0.2606 with mean FST values of 0.4415, 0.0859 and 0.2934 respectively (Figure 3). These three subpopulations showed intense levels of inbreeding within in the clusters as supported by these Strong FST values. |
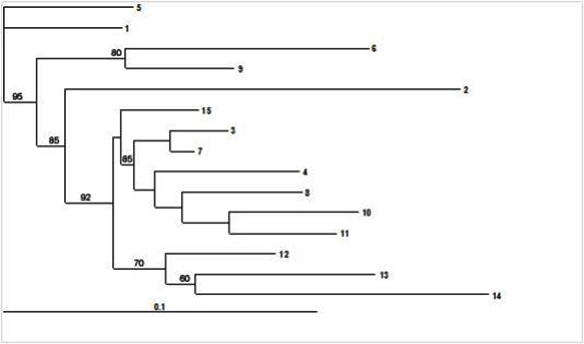
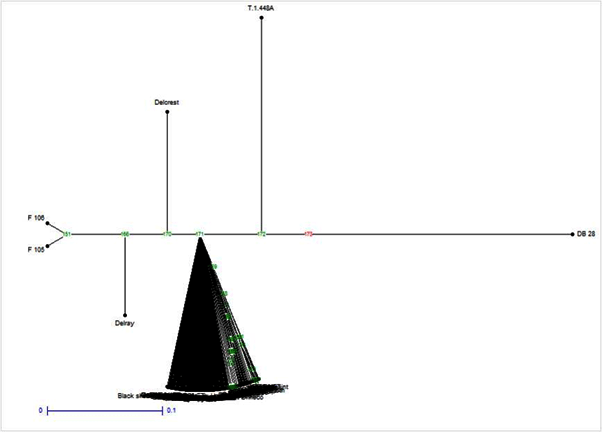
| Additionally, Cluster analysis was performed on 15 subdivisions based on the allele- frequency divergence among those subpopulations. It was very evident from this analysis that there was a high degree of inbreeding within this population as evidenced by inbreeding driven subdivisions (Figure 4). Estimating admixture proportions can be particularly challenging if there are very few representatives of the parental populations. Grouping of all the 135 individuals based on their estimated population membership coefficient Q matrix with three prevailing subdivisions is presented in Figure 5. The data was further tested with another model of analysis to validate our results. This included analysis with DARwin (DARwin 5.0: Dissimilarity Analysis and Representation for Windows) as used in rice research [19]. This model assumes the basis of evolutionary dissimilarities using microsatellite derived allelic data and performs clustering of individuals. The narrow clustering of the genotypes with limited divergence further supported our findings that the present populations possess a strong genetic structure (Figure 6). |
| Discussion |
| The current population genetic analyses using STRUCTURE was the most common approach and found to be highly suitable to address the issue of characterizing population differentiation. Inappropriate a priori grouping of individuals into populations may diminish the power of such analyses to elucidate biological processes, potentially leading to unsuitable mapping strategies or trait management research approaches. Population structure in 113 tomato accessions was also estimated in similar lines by employing SSR markers to identify markers linked to late blight resistance in Solanum phureja for breeding programs [20]. In another study similar approach with multilocus sequence data was conducted to infer population structure and demographic history in several wild tomato species (Solanum section Lycopersicon) by Thomas et al. [21]. Hence our current analysis of genetic structure in FCV tobacco population was critical to establish substantial evidences on the genetic structure in existing population of tobacco germplasm. |
| Multi-locus genotyping of FCV tobacco population consisting of 135 genotypes using mapped SSR markers successfully led to the identification of a strong genetic structure. Bayesian method of inference employed the genotyping data to derive genetic structure information on the population. It showed high FST measures in the subpopulations indicative of high inbreeding coefficient and high heterozygote deficit signifying an intensely structured population. With the data indicating that current population was not ideal for association mapping approach, alternative mapping options were worked out and accordingly biparental mating derived mapping population was developed for the trait mapping exercise. Our current results are in line with results of Fricano et al. [22] who also highlighted that the global population of tobacco is highly structured. Though other reports on similar findings can be found on population genetics of tobacco, germplasm specific genetic structure details are helpful to breeders for effective utilization of resources. The strong genetic structure in the current population suggest that tobacco might have experienced a series of selection followed by high inbreeding for several decades leading to a genetic bottleneck and limited divergence during its commercial cultivation. |
| It is well-realized in the past with various crops, that unsuited population when used in mapping results in spurious marker-trait associations. Hence the current results are very important in FCV tobacco molecular breeding for designing suitable mapping strategy to tag markers for traits of economic significance. While one continue to breed FCV tobacco, it is critical here that the genetic resources of the wild relatives of tobacco should be systematically evaluated and carefully utilized in commercial breeding. These sources will supplement and might even challenge the established lines in their effectiveness in breeding programs. The impact of this population genetics component can be rationally used to handle genetic diversity strategies and by breeders for effective use of existing variation in various breeding programs for enabling sustainable genetic improvements for yield and quality in tobacco. |
| Acknowledgment |
| We thank ILTD for providing all the germplasm samples for analysis; Dr CC Lakshmanan and Mr. TV Ramaswamy for their perpetual inspiration and an elegant vision and the R&D AgriScience division for their support at various times. |
| References |
References
|
Tables and Figures at a glance
| Appendix I | Appendix II |
Figures at a glance
 |
 |
 |
 |
 |
 |
|||||
| Figure 1 | Figure 2 | Figure 3 | Figure 4 | Figure 5 | Figure 6 |
Relevant Topics
- Agricultural science
- Agronomy
- Climate impact on crops
- Crop Productivity
- Crop Sciences
- Crop Technology
- Field Crops Research
- Hybrid Seed Technology
- Irrigation Technology
- Organic Cover Crops
- Organic Crops
- Pest Management
- Plant Genetics
- Plant Breeding
- Plant Nutrition
- Seed Production
- Seed Science and Technology
- Soil Fertility
- Weed Control
Recommended Journals
Article Tools
Article Usage
- Total views: 14469
- [From(publication date):
August-2014 - Apr 04, 2025] - Breakdown by view type
- HTML page views : 9887
- PDF downloads : 4582
