Research Article Open Access
Genetic Diversity Analysis of Urtica Parviflora in Uttarakhand Himalayas by Rapid Marker
Sandeep Sharma1*, Syed Atif Ali2, Alok Khare3 and Tapan Kumar Nailwal21National Bureau of Plant Genetic Resources (ICAR), Pusa Campus New Delhi, India
2Departments of Biotechnology, Kumaun University, Nainital, Uttarakhand, India
3Departments of Botany, Bareilly College, Bareilly, India
- Corresponding Author:
- Sandeep Sharma
Division of Plant Physiology
IARI New Delhi 110012, India
Tel: +919557285687
E-mail: saan.sharma07@gmail.com
Received date: January 30, 2015; Accepted date: May 25, 2015; Published date: June 01, 2015
Citation: Sharma S, Ali SA, Khare A, Nailwal TK (2015) Genetic Diversity Analysis of Urtica Parviflora in Uttarakhand Himalayas by Rapid Marker. J Biotechnol Biomater 5:183. doi:10.4172/2155-952X.1000183
Copyright: © 2015 Sharma S, et al. This is an open-access article distributed under the terms of the Creative Commons Attribution License, which permits unrestricted use, distribution, and reproduction in any medium, provided the original author and source are credited.
Visit for more related articles at Journal of Biotechnology & Biomaterials
Abstract
Urtica parviflora is herbaceous perennial medicinal plant distributed in Himalayan region from 400m to 3000m amsl altitude range. In the present study, five genotypes of U. parviflora were collected from different altitudes having variability in morphological traits. This genotype was subjected to Random Amplified Polymorphic DNA (RAPD) marker analysis to assess the genetic diversity at molecular level and develop molecular marker for their identification. Fairly rich genetic diversity was found through RAPD marker analysis. A total 66 scorable bands were produced in five samples with 8 primers. Out of 66 bands, 43 bands were found to be polymorphic i.e., 65.15% polymorphism. The dendrogram of samples shows three major clusters. The samples of similar altitudes were found to be present in one cluster.
Keywords
Urtica parviflora; RAPD marker; Genetic diversity; Primer; Polymorphism
Introduction
Himalayan region harbors rich diversity of valuable medicinal plants, research should focused different levels for sustainable utilization of these resources in order to develop the medicinal plants sector [1].
Family Urticaceae (nettle family), a part of the larger group order Urticales, is mostly tropical and subtropical in both the hemispheres Zomlefer, Mabberley [2,3] have listed 48 genera with 1050 species in family Urticaceae. Nettles (Genus: Urtica), are herbaceous perennial plants but some are annual and few are shrubby. There are 30-45 species of flowering plant of the genus Urtica in the family Urticaceae, with a cosmopolitan though mainly temperate distribution. The most prominent member of the genus is the stinging nettles Urtica parviflora and Urtica dioica, native of Europe, Africa, Asia, and North America. The plant is evenly distributed in Himalayan region especially in lower to mid hill zone with 450m to 3500 m amsl altitudinal range [4]. U. parviflora leaves have stinging hairs and used in dysentery, joint pain and liver disorders [5]. Leaves and fresh roots used for the treatment of fractures, dislocation of bones, boils and treatment of dermatitis [6].
Knowledge of the amount and the distribution of genetic variation among the population provide a guide for the predicting the degree of inheritance, variation and level of heterosis that are prerequisite for effective breeding programs [7]. Genetic polymorphism is classically defined as the simultaneous occurrence of a trait in the same population of two or more discontinuous variants or genotypes. A major achievement occurred in marker technology with the development of markers based on DNA sequence. The ideal DNA marker should be highly polymorphic and evenly distributed throughout the genome. Codominant inheritance, easy access availability, high reproducibility is the properties of ideal DNA marker [8,9]. The genetic markers based on DNA provide a genetic diagnostic tool that permit direct identification of genotypes in environment independent manner in any tissue and developmental stage [10]. It will have great benefit for plant breeders when the DNA markers are closely linked to traits of interest. Various types of DNA-based molecular techniques were utilized to evaluate DNA polymorphism like RAPD, RFLP, AFLP [11-13]. The technique based on PCR amplification of genomic DNA with single primers of arbitrary nucleotide polymorphism was called Randomly Amplified Polymorphic DNA (RAPD). It was reported that the percentage of GC contents of primers should be greater than 50% and primer sequence being 9-10 nucleotides in length [8,14]. The amplified fragments are separated electrophoretically and banding patterns are detected by different methods such as staining and autoradiography.
RAPD markers were used for evaluation of genetic diversity in many plant species such as tobacco [15] Lycopersicon [16], sugarcane [17], Solanum [18].
Materials and Methods
Collection of sample
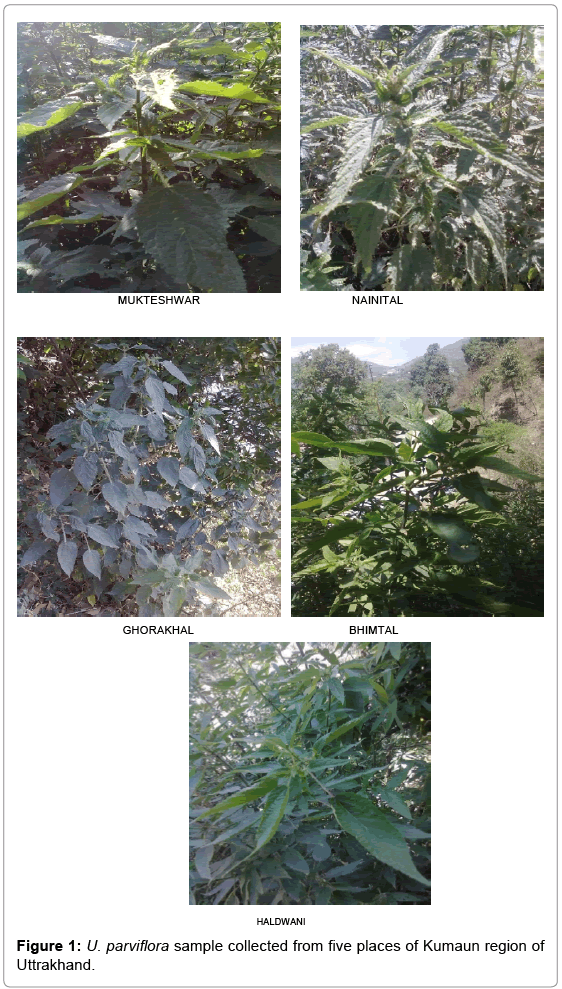
Fresh juvenile leaves of U. parviflora were collected in the first week of month of March, 2011 from five different altitudes in Nainital district of Uttarakhand (India) viz., Mukteshwar (2800m amsl), Nainital (2200m amsl), Ghorakhaal (2000m amsl), Bhimtal (1300m amsl) and Haldwani (424 m amsl) [4]. These leaves were brought to laboratory in perforated polybags. After washing these were kept in deep freezer at -20°C temperature.
DNA extraction
DNA isolation was done using CTAB (Cetyl trimethyl ammonium bromide) method. The leaves were ground in liquid nitrogen and DNA was extracted with 2% CTAB extraction buffer (2% CTAB, 1.4M NaCl, 100 mM Tris HCl, 20mM EDTA and 1% Mercaptoethanol). Further isolation was continued according to the method described by Doyle and Doyle (1990) with some modifications due to high content of phenolic compounds and polysaccrides in Urtica. In the extraction buffer 2%-4% of PVP (Polyvinylpyrrolindone) was used for removal of these phenolic compounds. Phenol: chloroform: isoamyalcohol (25:24:1) was used in place of chloroform: isoamyalcohol (25:24). After addition of isopropanol, DNA gets precipitated along with pigments, due to high content of chlorophyll and polyphenols in this species. Therefore, immediately after adding isopropanol, DNA spooled out with the help of micropipette in separate eppendorf tube.
DNA quantification
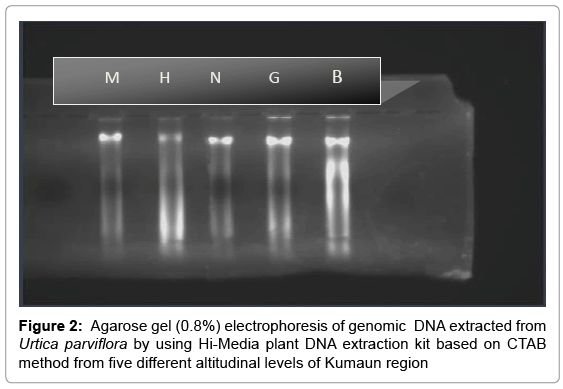
Quality of the extracted DNA was checked by running on 0.8% agarose gel. Ethidium bromide solution was used to stain the gel. Purity and concentration of genomic DNA was estimated by calculating the ratio of optical densities measured at 260-280 nm with a spectrophotometer (Thermo Scientific Type UV1, England). Appropriate dilutions of DNA were made for further amplification and RAPD analysis.
Polymerase chain reaction
Polymerase chain reaction (PCR) was performed on DNA thermal cycler (Biometra) using 20 μl reaction mixture containing 10mM Tris- HCl (pH 8.0), 50 mM KCl, 1.5 mM MgCl2, 100 μM of each dNTP, 50pM Primer, 50 ng of DNA and two unit of Taq DNA polymerase. Twenty, Ten-base pair primers (GeNeiTM Bangalore) were used for amplification reactions. Only those primers showing polymorphic results were selected for the purpose of diversity and similarity analysis. The reaction component was added to PCR tubes kept on ice. The PCR conditions of 94°C (1 minute) for denaturation, 35°C (1 minute) for annealing and 72°C (2 minutes) for primer extension were maintained.
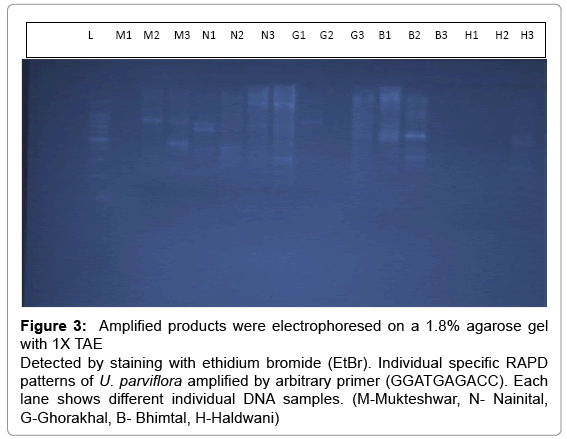
PCR products were electrophoresed on 1.8% (w/v) agarose gels, in 0.5X TAE Buffer at 80 V for 3 hrs and then stained with ethidium bromide (0.5μg/ml). Gels with amplification fragments were visualized and photographed under UV light and the intensity of bands was observed. Out of twenty primers used eight primers produced recognizable bands. The photographs of gels were used to score data for RAPD markers. Each DNA fragment amplified by a given primer was considered as a unit character and the RAPD fragments were scored as present (1) or absent (0) for each of the primer accession combinations. Diversity coefficient of each primer (number of polymorphic bands/ total number of band) and pairs-wise genetic similarity were calculated using NTSYS-PC (version 2.11a) software [19].
Result and Discussion
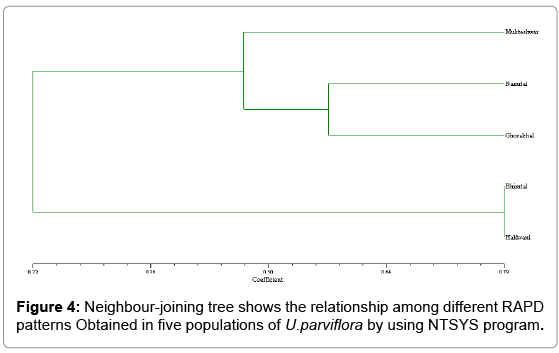
The Urtica genotypes selected on the basis of morphological characters were subjected to DNA analysis to determine the genetic diversity available at different altitudes in Himalayan region. DNA isolated by CTAB (Cetyl trimethyl ammonium bromide) method yielded strong and reliable amplification products showing its compatibility for RAPD – PCR using random primers. DNA isolated by this method was of high purity (A260/A280 ratio were 1.6-1.8) having very low contamination of polyphenols and polysaccharides (Table 1). For this purpose, DNA extracted from the Urtica genotypes was amplified using twenty random primers and run on the agarose gel. Out of 20 RAPD primers used, eight primers generated strong amplifications and resulted in polymorphic products (Table 2). The remaining primers were not considered for compiling the results because they were either not polymorphic or did not give clear amplifications. A total of 66 scorable bands were produced in five samples with eight primers. This data was utilized for further computation. Out of 66 bands 43 bands were polymorphic (65.15%). Data matrices were prepared in which the presence of bands was coded as (1) and absence as (0). The similarity index values obtained for pair wise comparison among U. parviflora populations from five different altitudes are shown in Table 3. The similarity index based on eight RAPD markers ranged from 42% to 78%. Similarity was found in genotype collected from similar altitudinal range pairs of Bhimtal and Haldwani (78%) order followed by Mukteshwar and Nainital (65%), Mukteshwar and Ghorakhaal (59%), Nainital and Ghorakhaal (57%) and Ghorakhaal and Bhimtal (53%). Minimum similarity was observed between the genotype pairs of Mukteshwar and Haldwani (42%). A dendrogram was constructed from five different populations of U. parviflora based on the similarity index (SI) values. The SI values were computed as a ratio of number of similar bands to total number in pair wise comparison of populations. The similarity matrix obtained by RAPD bands among five U. parviflora populations are shown in Table 3. Based on DNA finger-printing data, the genetic distances for five U. parvifloa populations were calculated using NTSYS (Numerical Taxonomy System) program. Option Sequential Agglomerative Hierarchical Non-overlapping (SAHN) was used which resulted in the construction of dendrogram shown in Figures 1-4.
| Sample | Altitudes (meters) | Absorbance | Quantity | ||
|---|---|---|---|---|---|
| OD (260 nm) | OD (280 nm) | Ratio (260/280) | DNA (µg /µl.) | ||
| Mukteshwar | 2800 | 0.052 | 0.031 | 1.7 | 0.65 |
| Nainital | 2200 | 0.182 | 0.096 | 1.8 | 2.27 |
| Ghorakhal | 2000 | 0.116 | 0.067 | 1.73 | 1.45 |
| Bhimtal | 1300 | 0.163 | 0.097 | 1.7 | 2.037 |
| Haldwani | 424 | 0.167 | 0.100 | 1.67 | 2.6 |
Table 1: The quantity and purity of DNA obtained from the qualitative and quantitative analysis of our five DNA samples.
| S. No. | Primer (5N→3N) |
Total number of loci | Number of monomorphic loci | Number of polymorphic loci | Polymorphism (%) |
|---|---|---|---|---|---|
| 1. | CAGGCCCTTC | 5 | 2 | 3 | 60.00 |
| 2. | TGCCGAGCTG | 8 | 4 | 4 | 50.00 |
| 3. | CAATCGCCGT | 7 | 2 | 5 | 71.42 |
| 4. | AGCCAGCGAA | 9 | 4 | 5 | 55.55 |
| 5. | AGGGAACGAG | 12 | 2 | 10 | 83.33 |
| 6. | GTTGCGATCC | 8 | 3 | 5 | 62.50 |
| 7. | AGCGTCCTCC | 11 | 4 | 7 | 63.63 |
| 8. | GGATGAGACC | 6 | 2 | 4 | 66.66 |
Table 2: Polymorphism revealed by different RAPD primers.
| Rows/Cols | Mukteshwar | Nainital | Ghorakhal | Bhimtal | Haldwani |
|---|---|---|---|---|---|
| Mukteshwar | J000E + 000 | ||||
| Nainital | 6.555555 | 1.0000000 | |||
| Ghorakhal | 5.902439 | 5.750000 | 1.0000000 | ||
| Bhimtal | 5.112121 | 4.944444 | 5.333333 | 1.0000000 | |
| Haldwani | 4.215151 | 4.578947 | 4.636363 | 7.857142 | 1.000000 |
Table 3: Jaccard’s similarity analysis based on eight RAPD primers in five different altitudinal populations of Urtica parviflora.
Figure 3: Amplified products were electrophoresed on a 1.8% agarose gel with 1X TAE Detected by staining with ethidium bromide (EtBr). Individual specific RAPD patterns of U. parviflora amplified by arbitrary primer (GGATGAGACC). Each lane shows different individual DNA samples. (M-Mukteshwar, N- Nainital, G-Ghorakhal, B- Bhimtal, H-Haldwani)
The dendrogram has grouped all the five populations into three major clusters A, B and C. Cluster A is further classified into two subclusters A1 and A2 and cluster B into sub clusters B1 and B2. The major clusters A and B are comprised of 2 populations, while the cluster C is comprised of one population. The maximum similarity was found between population A1 (Haldwani) and A2 (Bhimtal), with similarity index value 78%, while population C (Mukteshwar) and A1 (Haldwani) has shown least similarity i.e., 42%.
Molecular characterization of germplasm is basic to the improvement of the species and can be done at the DNA level. Present findings suggest that the genetic variability present in U. parviflora was quite appreciable due to elevational variation. As sample from lower altitudes (Haldwani) showed low genetic similarity with sample collected from higher altitudes (Mukteshwar). There is a general belief that nettle accessions found at higher elevations have high medicinal value compared to accessions found in lower altitudes. Various characters might be responsible for this assumption, as, U. parviflora leaves are known to be genetically variable in number of stinging hairs per unit leaf area as well as other characters. It was found that leaf samples collected from lower altitudes have lesser number of stinging hairs as compares to samples collected from higher altitudes. Overall variations in trichome numbers accounted for difference in important clinical values associated with this plant with respect to plant distribution at different altitudes. Various environmental factors like rainfall, temperature, altitude and the dosage of the UV rays may be responsible for such variation within the species. Spatial and genetic variations are often assumed to result from environmental heterogeneity and different selection pressure.
The results of study indicate that there is rich genetic diversity is available at molecular level in U. parviflora genotypes growing at different altitudes of Himalayan region in Uttarakhand. It would also be helpful for the planning of breeding strategies and future programs. The genetic diversity might be utilized for breeding purpose to tailor the genotypes having high medicinal value and useful for pharmaceutical industry.
Acknowledgement
All experimental work completed in the biotechnology Lab., Departments of Biotechnology, Kumaun University, Nainital, Uttarakhand.
References
- Kala CP (2004) Revitalizing traditional herbal therapy by exploring medicinal plants: A case study of Uttaranchal State in India. In: Indigenous Knowledges: Transforming the Academy, Proceedings of an International Conference Pennsylvania: Pennsylvania State University, 15-21.
- Zomlefer WB (1994) Guide to Flowering Plant Families. University of North Carolina Press, Chapel Hill.
- Mabberley DJ (1997) A Portable Dictionary of the Vascular Plants. In: The Plant-Book.Cambridge University Press, New York.
- Does MP, Ng DK, Dekker HL, Peumans WJ, Houterman PM, et al. (1999) Characterization of Urticadioica agglutinin isolectins and the encoding gene family. Plant MolBiol 39: 335-347.
- Gurung G (1999) The medicinal plants of Sikkim Himalaya. Subash Publication, Sikkim.
- Ramachandran K (1992) Wealth of India (Raw Materials). Publications and Information Directorate, Council of Scientific and Industrial Research, New Delhi.
- Duan YP, Chen WG, Li MS, Li XH, Liu X, et al. (2006) The genetic diversity among 27 maize populations based on SSR data. SciAgricSinica 39: 1102-1114.
- Goel C, Verma P, Ahmad N, Nailwal KT (2011) Molecular Characterization of the Nettle Plant UrticaParviflora Based on RAPD Marker. JPBMS 5:1-5.
- Botstein D, White RL, Skolnick M, Davis RW (1980) Construction of a genetic linkage map in man using restriction fragment length polymorphisms. Am J Hum Genet 32: 314-331.
- Zietkiewicz E, Rafalski A, Labuda D (1994) Genome fingerprinting by simple sequence repeat (SSR)-anchored polymerase chain reaction amplification. Genomics 20: 176-183.
- Tanksley SD, Wang ZY (1989) Restriction Fragment Length Polymorphism in Oryza sativa L. Genome. 32: 1113-1118.
- Powell W, Morgante M, McDevitt R, Vendramin GG, Rafalski JA (1995) Polymorphic simple sequence repeat regions in chloroplast genomes: applications to the population genetics of pines. ProcNatlAcadSci U S A 92: 7759-7763.
- Joshi SP, Ranjanekar PK, Gupta VS (1999) Molecular markers in plant genome analysis. CurrSci77: 230-240.
- Williams JG, Kubelik AR, Livak KJ, Rafalski JA, Tingey SV (1990) DNA polymorphisms amplified by arbitrary primers are useful as genetic markers. Nucleic Acids Res 18: 6531-6535.
- Del Piano L, Abet M, Sorrenlino C, Acanfora F, Cozzolino E, et al. (2000) Genetic variability in Nicotianatabacum and Nicotiana species as revealed by RAPD procedure. BeitregeZur TabInt 19: 1-15.
- Kochieva EZ, Ryzhova NN, Khrapalova IA, Pukhalskii VA (2002) Using RAPD for estimating genetic polymorphism in and phylogenetic relationships among species of the genus Lycopersicon (Tourn.) Mill.Genetika 38: 1298-1303.
- Nair VN, Selvi A, Sreenivasan TV, Pushpalatha KN (2002) Molecular diversity in Indian Sugarcane varieties as revealed by randomly amplified DNA polymorphisms. Euphytica127: 219-225.
- Singh AK, Singh M, Singh R, Kumar S, Kallo G (2005) Genetic diversity within the genus Solanum(Solanaceae) as revealed by RAPD markers. CurrSci 90: 711-716.
- Rohlf FJ (1998) NTSYS-PC Numerical Taxonomy and Multivariate Analysis System. Version 2.1, Exeter Software, New York.
Relevant Topics
- Agricultural biotechnology
- Animal biotechnology
- Applied Biotechnology
- Biocatalysis
- Biofabrication
- Biomaterial implants
- Biomaterial-Based Drug Delivery Systems
- Bioprinting of Tissue Constructs
- Biotechnology applications
- Cardiovascular biomaterials
- CRISPR-Cas9 in Biotechnology
- Nano biotechnology
- Smart Biomaterials
- White/industrial biotechnology
Recommended Journals
Article Tools
Article Usage
- Total views: 14981
- [From(publication date):
August-2015 - Mar 31, 2025] - Breakdown by view type
- HTML page views : 10411
- PDF downloads : 4570
