Research Article Open Access
Frequency Analysis and Feature Extraction of Impressive Tools
A.K.M Fazlul Haque*Dept. of ETE, Daffodil International University, 102, Sukrabad, Dhanmondi, Dhaka – 1205, Bangladesh
- *Corresponding Author:
- A.K.M Fazlul Haque
Dept. of ETE
Daffodil International University
102, Sukrabad, Dhanmondi
Dhaka – 1205, Bangladesh
E-mail: akmfhaque@daffodilvarsity.edu.bd
Visit for more related articles at International Journal of Advance Innovations, Thoughts & Ideas
Abstract
This paper has introduced the significance of frequency component of sinusoids and analyzed the characteristics of frequency analysis tools. Fourier transform, Short Time Fourier Transform (STFT), Wavelet Transform have been considered for evaluating the signal component. Signals have been taken both offline and empirical and finally frequency coefficients are tested and evaluated to verify the characteristics of the tools.
Keywords
FFT, Wavelet, frequency, Sinusoids.
Introduction
Frequency component extraction is the vital and key aspects to analyze the signal for proper diagnosis. Receivers receive the composite baseband signal containing different sinusoids. It is needed to extract the frequency component from the signal. There are significant impressive tools for the signal analyses. Fourier analysis is one of the most well-known of these, which breaks down a signal into constituent sinusoids of different frequencies [1-3]. It can also be defined that Fourier analysis is as a mathematical technique that can transform time doming signal to frequency domain. In spite of great importance for extracting frequency component, Fourier analysis has a somber drawback. Fourier coefficients contain only frequency information where time information is lost. It is quite not possible to tell by showing the frequency component when a particular event took place. Some abrupt signal contains numerous non-stationary or transitory characteristics, Fourier analysis is not appropriate to detecting them. To remedy the situation, Dennis Gabor (1946) adapted the Fourier transform to analyze only a small section of the signal at a time -- a technique called windowing the signal. Gabor's adaptation, called the Short-Time Fourier Transform (STFT), maps a signal into a two-dimensional function of time and frequency. STFT introduces a sort of compromise between the time- and frequency-based views of a signal. This information is obtained with limited precision, and that precision is identified by the size of the window. But the drawback of STFT is that particular size for the time window is the same for all frequencies. Wavelet analysis is a windowing technique with variable-sized regions that allows the use of long time intervals where it is demanded more precise low-frequency information, and shorter regions high-frequency information. Wavelet analysis has been introduced to capable of revealing aspects of data that other signal analysis techniques miss, aspects like trends, breakdown points, discontinuities in higher derivatives, and self-similarity. Wavelet analysis also compresses or de-noises a signal without appreciable degradation. There are some existing works related to this field [4-6]. They extracted the features for specific purpose. In this paper, the significance of frequency component of sinusoids has been analyzed for evaluating the characteristics of frequency analysis tools.
Background
The Fourier transform of the symbolic scalar f with default independent variable x. The default return is a function of w. The Fourier transform is applied to a function of x and returns a function of w. mathematically, the process of Fourier analysis is represented by the Fourier transform:
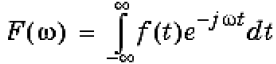
which is the sum over all time of the signal f(t) multiplied by a complex exponential. (Recall that a complex exponential can be broken down into real and imaginary sinusoidal components.) The results of the transform are the Fourier coefficients F(ω), which when multiplied by a sinusoid of frequency ω yield the constituent sinusoidal components of the original signal. Fourier analysis is extremely useful for data analysis, as it breaks down a signal into constituent sinusoids of different frequencies. For sampled vector data, Fourier analysis is performed using the discrete Fourier transform (DFT). The fast Fourier transform (FFT) is an efficient algorithm for computing the DFT of a sequence; it is not a separate transform. It is particularly useful in areas such as signal and image processing, where its uses range from filtering, convolution, and frequency analysis to power spectrum estimation. Working with the Fourier transform on a computer usually involves a form of the transform known as the discrete Fourier transform (DFT). The DFT is usually defined for a discrete function f (m,n) that is nonzero only over the finite region 0 <= m <= M-1 and 0 <= n <= N-1. The two-dimensional M-by-N DFT and inverse M-by-N DFT relationships are given by:


The values F (p,q) are the DFT coefficients of f(m,n) . The zero-frequency coefficient, F(0,0), is often called the "DC component." DC is an electrical engineering term that stands for direct current [1-3].
Here the ECG signal is used with the finite number of iteration. The sinusoidal periodicity is definite with the assist of Dirichlet condition. The Dirichlet conditions are as follows.
1. The ECG signal has a finite number of discontinuities in any period.
2. The ECG signal contains a finite number of maxima and minima during any period.
3. The signal is absolutely integrable in any period.
The FFT method uses normally DFT method to satisfy the procedure to plot the signal in frequency domain both in frequency response and phase response. The L-point DFT is sufficient to uniquely represent the sequence of the discrete signal in the frequency domain, it is apparent that it does not provide sufficient detail to yield a good picture of the spectral characteristics of the signal. If we wish to have better picture, we must interpolate the frequency response at more closely spaced frequencies. In fact, we can view this computation as expanding the size of the sequence L points to N points by appending N-L zeros to the discrete sequence, that is, zero padding. Then the N-point DFT provides finer interpolation than the L-point DFT. The continuous time domain ECG signal has been distorted to discrete time domain signal using sampling theorem. The discrete values and the DFT point have been taken to be used in the DFT process. Here the discrete values n are taken in terms the DFT point of m which are belonging to the above two DFT equation. The parameters p and q hold the DFT coefficients that can help to draw the plot of frequency response and the exponential part which carries the phase that can help to draw the plot of the phase response of the ECG signal.
Continuous wavelet transform (CWT) is defined as the sum over all time of the signal multiplied by scaled, shifted versions of the wavelet function ψ.
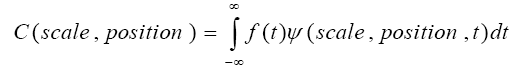
The results of the CWT are many wavelet coefficients C, which are a function of scale and position. Multiplying each coefficient by the appropriately scaled and shifted wavelet yields the constituent wavelets of the original signal. For many signals, the low-frequency content is the most important part. It is what gives the signal its identity. The high-frequency content, on the other hand, imparts flavor or nuance. To gain a better appreciation of this process, it is performed a one-stage discrete wavelet transform of a signal. The decomposition process can be iterated, with successive approximations being decomposed in turn, so that one signal is broken down into many lower resolution components. This is called the wavelet decomposition tree. The wavelet packet method is a generalization of wavelet decomposition that offers a richer range of possibilities for signal analysis. In wavelet analysis, a signal is split into an approximation and a detail. The approximation is then itself split into a second-level approximation and detail, and the process is repeated.
Simulation and Results
In this section, some sinusoids, especially ECG and audio signal have been generated both offline and empirical. By considering noise, the noise corrupted signal has also been generated for evaluating the existing tools. The features of ECG pattern having amplitude of 3.5mV and pulse repetition rate of 75 per minute. This signal is shown in Fig.2. A noisy signal of the ECG is considered having frequency of 1/5 Hz and amplitude of 1.5 mV which is approximate 40 percent of the standard ECG signal. This signal is shown in Fig.1.
Based on the above parameters, features are extracted and evaluated of the signal using FFT. The dissimilarities are identified by the parameters such as amplitude, frequency, phase and pole-zero plots. Signals can be prescribed by its poles and zeros (together with a gain factor). Poles and zeros provide functional insights into a filter's response, and can be used to extract the feature. Audio signal is taken as input for evaluating Wavelet show in Fig.2. The time domains of the signal, power spectral density, and composition of the signals have been demonstrated.

Figure 1: Signal pattern extraction using FFT.

Figure 2: Signal pattern extraction using Wavelet.
Conclusion
In this paper, the significance of frequency component of sinusoids has been extracted. The small changes of the sinusoids are detected using FFT, which were not visible in the conventional graphical presents of the signal. The frequency response and the pole-zero locations have been considered to evaluate the signal differences between normal and noisy signal. The above evidences based on FFT, wavelet, and power spectral density of both analysis pronounce that the feature extraction using wavelet method behaves significant than other conventional system to find out the good detection of small changes of the signal.
References
- A.K.M Fazlul Haque,” FFT and Wavelet-Based Feature Extraction For Acoustic Audio Classification”, International Journal of Advance Innovations, Thoughts & Ideas, Vol 1, No.1
- A.K.M Fazlul Haque, “Improved Detection of ECG Features Using Wavelet For Emergency Medical Application” International Journal of Advance Innovations, Thoughts & Ideas, Vol 1 No.2.
- A.K.M Fazlul Haque, Md. Hanif Ali, M. Adnan Kiber, Md. Tanvir Hassan “Automatic Feature Extraction of ECG Signal using FFT” Journal of Bangladesh Electronic Society, Vol 9, No. 1-2, 2009.
- Karel J.M.H., Peeters R.L.M., Westra R.L., Moermans K.M.S., Haddad S.A.P. and Serdijn W.A., Optimal discrete wavelet design for cardiac signal processing, Proceedings of the 2005 IEEE, Engineering in Medicine and Biology 27th Annual Conference.
- Mahamoodabadi S.Z., Ahmedian A., Abolhasani M.D., ECG feature extraction using daubechies wavelet, Proceedings of the fifth IASTED International Conference VISUALIZATION, IMAGING and IMAGE PROCESSING, September 7-9, 2005, Benidorm, Spain.
- Gilbert Strang, Truong Nguyen, (1997), Wavelets and Filter Banks, Wellesley-Cambridge Press, 1997.
Relevant Topics
- Advance Techniques in cancer treatments
- Advanced Techniques in Rehabilitation
- Artificial Intelligence
- Blockchain Technology
- Diabetes care
- Digital Transformation
- Innovations & Tends in Pharma
- Innovations in Diagnosis & Treatment
- Innovations in Immunology
- Innovations in Neuroscience
- Innovations in ophthalmology
- Life Science and Brain research
- Machine Learning
- New inventions & Patents
- Quantum Computing
Recommended Journals
Article Tools
Article Usage
- Total views: 13985
- [From(publication date):
March-2013 - Apr 01, 2025] - Breakdown by view type
- HTML page views : 9304
- PDF downloads : 4681