Formulation and Evaluation of Mesoporous Silica Nanoparticles Loaded fast Dissolving Tablet of Tamoxifen
Received: 01-Nov-2022 / Manuscript No. cpb-22-79415 / Editor assigned: 03-Nov-2022 / PreQC No. cpb-22-79415 / Reviewed: 17-Nov-2022 / QC No. cpb-22-79415 / Revised: 21-Nov-2022 / Manuscript No. cpb-22-79415 / Published Date: 30-Nov-2022 DOI: 10.4172/2167-065X.1000296
Introduction
Mesoporous silica nanoparticles
MSN invented in 1992 by Mobil R and D Corporation. They synthesized mesoporous solids from aluminosilicate gels by utilizing liquefied crystal template mechanism. To achieve a greater affinity towards target site, more complex structure of drug is obtained. These drugs having high activity are mostly water insoluble or poorly solubility in water. 90% of API is having low water solubility. Various methods are used to enhance bioavialibility of drug. E.g. Solid dispersion, size reduction, nanoparticles, etc. Out of this methods mesoporous silica nanoparticles method is extensively used recently. They have a scope in various types of cancer
Silica precursor and micelle templates are used for development of mesoporous structure. After development of MSN, drug is loaded in silica nanoparticles. It leads to enhancement of bioavialibility of drug. Bioactive molecule is trapped into mesoporous silica. It is called as mesoporous silica nanoparticles. Active pharmaceutical ingredient is delivered to site of action. It has unique advantages like tunable pore size, great constancy and inflexible framework, uniform pore size, high pore volume and greater surface area. Hence MSN are widely used now a days to enhance bioavialibility of drug [4,5].
MSN generally have a 2-50 nm pore volume. Different types of nanoparticles have a different particle size to produce desirable effects generally particle size maintained below 200nm to enhance bioavialibility [6].
Material and method
Material
Tamoxifen purchased from Neon Laboratories Ltd, Kandiwali, Mumbai. CTAB purchased from Advent Chem Bio Pvt Ltd, Bhiwandi. TEOS purchased from Dr. Khan Industrial Consultant Pvt. Ltd. Ratnagiri. Mannitol purchased from Sankalp Healthcare and Allied Products Pvt Ltd, Karad. Microcrystalline cellulose purchased from DFE Pharma, Benglore. Sodium starch glycolate, ethanol, magnesium stearate, talc purchased from research lab, Mumbai [7,8].
Preformulation study:
Preformulation study is used to check purity of drug. Study also performed to check compatibility of API and excipients.
Authentication:
Authentication of excipients is performed using FTIR spectroscopy, melting point.
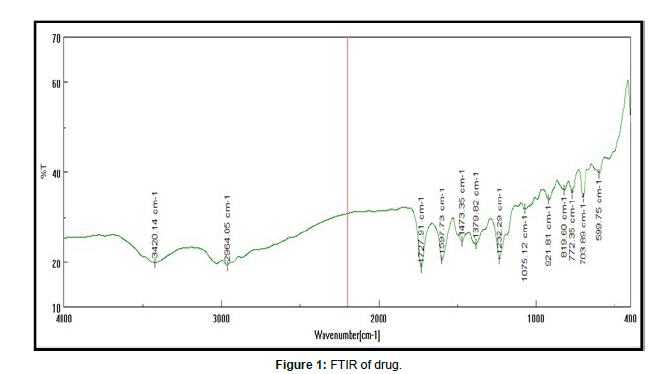
Fourier transformer infrared (ftir) spectroscopy:
FTIR performed using the Jasco FTIR – 410 spectrophotometer. IR spectrum of drug and excipient recorded using potassium bromide (KBr). To perform FTIR pallet method is used.
Melting point:
Melting point of active pharmaceutical ingredient was recorded using melting point apparatus (VEEGO). Capillary process was utilized to perform the test [9,10].
Construction of calibration curve:
Determination of λ MAX:
Weighed amount of tamoxifen was dissolved in buffer solution having pH 6.8 to obtain 100 μg/ml solutions. 1 ml solution was removed and diluted up to 10ml by phosphate buffer solution. λ max determined at 200 – 400 nm. Calibration curve determined in following two solutions.
Calibration curve of tamoxifen in phosphate buffer 6.8 Calibration curve in ethanol
Formulation and characterisation of drug loaded
Mesoporous silica nanoparticles
Formulation OF mesoporous silica nanoparticles: Procedure:
Silica nanoparticles were prepared using precipitation method. 1.6 gm of CTAB mixed with 200ml distilled water and 60 ml ethanol and 3 ml TEA. Mixture were stirred continuously until
clear solution obtained. 5 ml TEOS added dropwise with continuous stirring. Solution stirred continuously for 24 hrs. Turbid suspension is centrifuged at 3000 rpm for 30 min. Obtained precipitate washed with distilled water and then ethanol. Product is air dried [11,12].
Drug loading:
Solvent evaporation method is utilized for drug loading. Drug is dissolved in ethanol. SiNP were added to the solution. Solution was stirred for 2 hours. Coupling agent APTES was added dropwise and further stirred for 2 hrs. Solvent evaporated during stirring. Product dried. SiNP stored in air tight containers for further studies.
Optimisation of process variables using 32 factorial designs:
32 factorial design used for formulation of MSN. Concentration of SiNP (x1) and concentration of APTES (x2) are selected as independent variable. Three levels determined from literature review. Total 9 bathes were prepared. Stastical model is utilized to decide effect of independent variables on dependent variables that is entrapment efficiency (Y %). Coded values are taken for independent variable. Three levels are taken in coded form that is low (-1), Medium (0) and high (+1). Design expert software was used to obtain values of coefficient in equation.
II factors (independent variables) and their levels:
X1 = SiNP (gm) X2 = APTES (ml)
From literature review concentration of SiNP and APTES determined is as follows:
Characterisation of mesoporous silica nanoparticles:
Particle size:
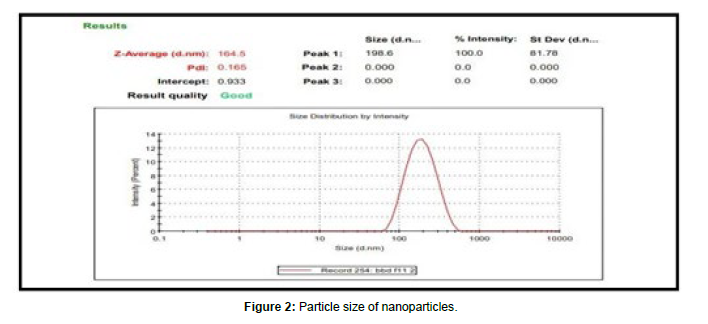
Particle size is determined using Malven Zetasizer. Study performed using water as dispersion medium at 250C
% Entrapment efficiency
Amount of tamoxifen encapsulated in mesoporous silica nanoparticles was determined using UV spectrophotometer. Accurately weighed 10 mg MSNs was liquefied in 10 ml ethanol. Extracted in phosphate buffer having pH 6.8. Stirred continuously for 30 min for evaporation of organic solvent. Solution is filtered by Whatman filter paper and analysed at 237 nm using UV spectrophotometer. % entrapment efficiency is calculated using following formula.

Scanning electron microscopy
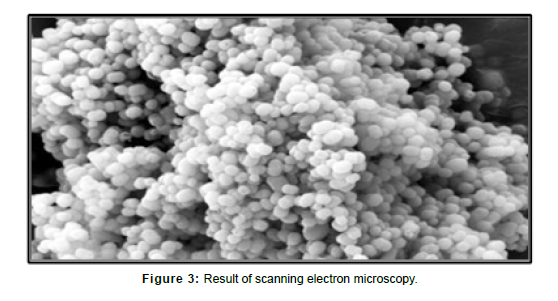
Surface morphology of tamoxifen is determined using scanning electron microscope. Sample was fixed on SEM stub utilizing two sided adhesive tape. Sample coated with thin layer of gold under vacuum. Sample was analysed in SEM chamber at 10Kv.
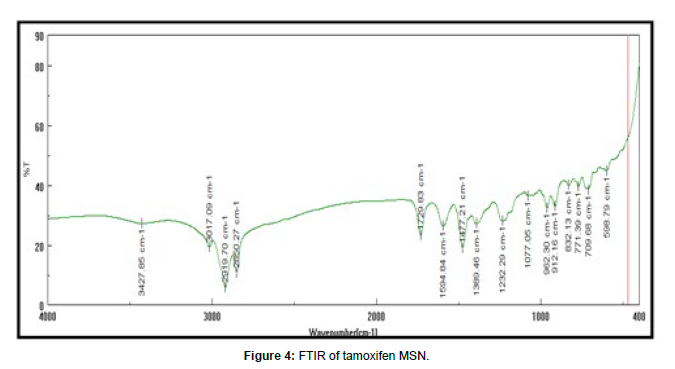
Ftir of tamoxifen msn FTIR spectra of tamoxifen, tamoxifen MSN were recorded on Jasco FTIR 410 spectrophotometer at room temperature. KBr pallet technique adopted to analyze IR at resolution of 4cm-1 over the range of 4000 – 400 cm-1.
X- ray diffraction
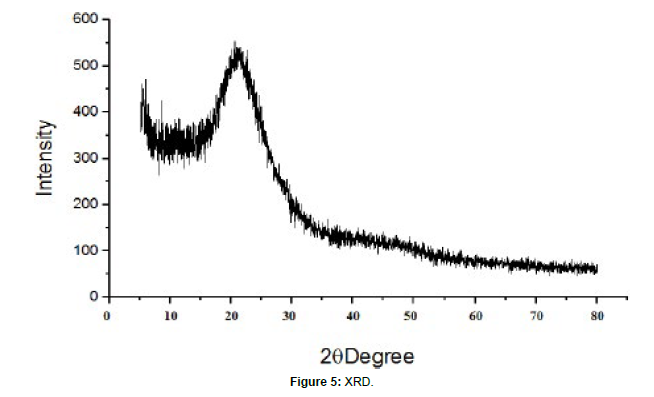
X- ray diffractometer (Rikagu Miniflex 600 ) was used to study XRD patterns. Monochromatosized Cu – Ka radiation (1.542 A) used to load the sample and diffraction pattern were recorded in range of 50 – 500. Study performed at voltage of 30 Kv.
Differntial scanning colorimetry
Differential scanning colorimeter (DSC 7020 Hitachi) was used for study of MSN and drug. Temperature and enthalpy was calibrated using hermetically sealed aluminum crucibles with heating at constant pace of 100c/min over the temperature ranges of 20 – 250 0C. Further drug and MSN were analysed. Purging nitrogen gas with flow of 50ml/ min used [13,14].
Solubility studies
Solubility study is performed according to technique by Higuchi and Connors. Weighed amount of MSN were dissolved into solvent for 24 hrs. Then filtered by using Whatman filter paper. Absorption of solution recorded by using UV spectrophotometer at 237 nm.
Formulation of fdt
Optimized batch used for formulation of tablet. Four batches of tablet were prepared. Batches are selected by literature review. Direct compression technique was applied for preparation of tablet.
Direct compression:
Powder blend was mixed in mortar and pestle. Tablet were prepared using 6mm punch and ten station rotary punching machine.
Evaluation of fdt
Precompression evaluation of fdt
Bulk density, tapped density, Hausner’s ratio, compressibility index, angle of repose these tests are performed
Post compression studies
Thickness, hardness, friability, weight variation test, drug content, solubility study, in vitro drug release, these are the various studies performed in post compression studies.
Result and Discussion
Preformulation study
Authentication
Authentication of drug performed using melting point, FTIR and UV spectroscopy. Excipient was authenticated by FTIR method. studies confirmed purity of drug.
Melting point:
Melting point of drug was detected 138-1410C. It is found within standard melting point range.
Uv spectroscopy
Standard solution of tamoxifen was scanned on UV spectrophotometer within the ranges of 200
– 400 nm. Absorption maxima of drug were detected 237 nm.
Construction of calibration curve
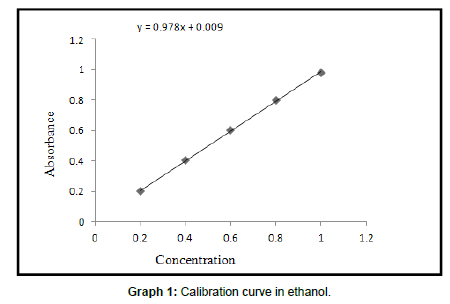
Calibration curve of tamoxifen in ethanol
Readings for calibration curve of tamoxifen in ethanol
Optical characteristics for calibration curve of tamoxifen in ethanol
Equation line: y = mx + c
y = 0.978x + 0.009
Standard calibration curve was obtained by plotting concentration Vs. absorbance. Graph is linear for ranges from 0.2 – 1 μ/ml. Table shows the standard values of tamoxifen. These values are used for calculation of in vitro drug release and drug content.
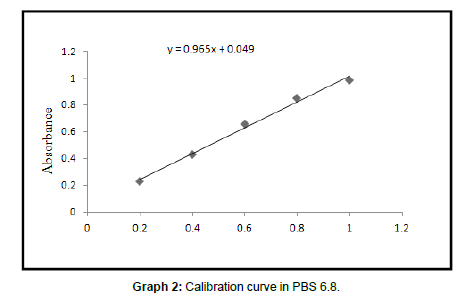
Calibration curve of tamoxifen in PBS pH 6.8 Readings for calibration curve of tamoxifen in PBS pH 6.8
Formulation and Characterisation of drug loaded mesoporous silica nanoparticles
Formulation of msn
MSN were prepared successfully as per procedure given in chapter 5 experimental.
Drug loading
Nine batches of drug loaded mesoporous silica nanoparticles were prepared successfully as per given in chapter 5 experimental.
Factorial design with surface plot and optimisation of process variables
Preparation of factorial design
32 full factorial designs were used for determination of batches. Batches were evaluated at three levels and total nine combinations obtained. To generate equation % entrapment efficiency taken as response that is dependent variables. This is used to generate predictor equation with independent variables (SiNP and APTES) showed all values within limit, shows that given model is fitted to optimize %entrapment efficiency. Design expert version 12 models used to obtain values of coefficient in equation.
| Coded values | Actual values | |
|---|---|---|
| X1 | X2 | |
| -1 | 100 | 0.2 |
| 0 | 200 | 0.35 |
| 1 | 300 | 0.5 |
| Ingredients | F1 | F2 | F3 | F4 | |
|---|---|---|---|---|---|
| MSN | 40 | 40 | 40 | 40 | |
| SSG | 2 | 4 | 6 | 8 | |
| Microcrystalline cellulose | 24 | 22 | 20 | 18 | |
| Mannitol | 50 | 50 | 50 | 50 | |
| Magnesium stearate | 2 | 2 | 2 | 2 | |
| Talc | 2 | 2 | 2 | 2 | |
| Total | 120 | 120 | 120 | 120 |
| CHARACTERISTIC | VALUE |
|---|---|
| Correlation coefficient | 0.999 |
| Slope | 0.978 |
| Intercept | 0.009 |
| Sr. No. | Characteristic | VValue |
|---|---|---|
| 1 | Correlation coefficient | 0.9959 |
| 2 | Slope | 00.965 |
| 3 | Intercept | 00.049 |
| Coded values | Actual values | |
|---|---|---|
| X1 | X2 | |
| -1 | 100 | 0.2 |
| 0 | 200 | 0.35 |
| 1 | 300 | 0.5 |
| BATCH NO. | VARIABLE LEVEL IN CODED FORM | |
|---|---|---|
| X1 | X2 | |
| F1 | -1 (100) | -1 (0.20) |
| F2 | -1 (100) | 0 (0.35) |
| F3 | -1 (100) | +1 (0.50) |
| F4 | 0 (200) | -1 (0.20) |
| F5 | 0 (200) | 0 (0.35) |
| F6 | 0 (200) | +1 (0.50) |
| F7 | +1 (300) | -1 (0.20) |
| F8 | +1 (300) | 0 (0.35) |
| F9 | +1 (300) | +1 ( 0.50) |
Polynominal fitting effect on % entrapment efficiency
% entrapment efficiency from all batches used to generate predictor equation with independent variables as concentration of SiNP (mg) and concentration of APTES (ml).
Optimisation
Optimization of batches was carried out depending upon results obtained.
| BATCH NO. | % Entrapment efficiency |
|---|---|
| F1 | 33.05 |
| F2 | 29.53 |
| F3 | 17.61 |
| F4 | 63.1 |
| F5 | 57.09 |
| F6 | 39.68 |
| F7 | 88.29 |
| F8 | 77.82 |
| F9 | 70.77 |
| Std. Dev. | 2.97 | R² | 0.9887 |
| Mean | 52.99 | Adjusted R² | 0.9849 |
| C.V. % | 5.60 | Predicted R² | 0.9774 |
| Adequate Precision | 41.4289 |
| Concentration of SiNP (mg) | 300 |
| Concentration of APTES (ml) | 0.2 |
| SOLUBILITY (mg/ml) | |||
|---|---|---|---|
| Sr. No. | Formulation | Water | PBS pH 6.8 |
| 1 | Tamoxifen | 0.02 | 0.032 |
| 2 | MSN | 0.12 | 0.165 |
Table No. 10: Results for solubility studies
| BATCH | BULK DENSITY | TAPPED DENSITY | HAUSNER’S RATIO | COMPRESSIBILITY INDEX | ANGLE OF REPOSE |
|---|---|---|---|---|---|
| A | 0.139±0.001 | 0.1413±0.000 | 1.0153±0.01 | 2.46±1.06 | 27.016±0.263 |
| B | 0.120±0.000 | 0.1213±0.000 | 1.0033±0.003 | 1.63±0.543 | 20.83±0.219 |
| C | 0.127±0.000 | 0.132±0.000 | 1.0123±0.005 | 1.276±0.497 | 14.01±1.366 |
| D | 0.117±0.000 | 0.120±0.000 | 1.018±0.008 | 2.1483±0.488 | 11.3±4.11 |
| BATCH | THICKNESS | HARDNESS | FRIABILITY | WEIGHT | % DRUG CONTENT | DISINTEGRATION |
|---|---|---|---|---|---|---|
| VARIATION | TIME | |||||
| A | 2.5 ± 0.000 | 2.76 ± 0.033 | 0.99 ± 0.05 | 119.15 ±0.35 | 96.88 ±0.20 | 280.66 ±0.66 |
| B | 2.3 ± 0.095 | 2.56 ± 0.088 | 0.83 ± 0.08 | 119.31 ±0.552 | 97.68 ±0.03 | 224.66 ±0.33 |
| C | 2.4 ± 0.033 | 2.66 ± 0.082 | 0.58 ± 0.00 | 120.45 ±0.724 | 97.16 ±0.03 | 176.00 ±1 |
| D | 2.3 ± 0.0882 | 2.33 ± 0.066 | 0.33 ± 0.46 | 120.15 ±0.477 | 97.78 ±0.03 | 126.00 ±0.57 |
| TIME | A | B | C | D |
|---|---|---|---|---|
| 0 | 0 | 0 | 0 | 0 |
| 15 | 0 | 00.03 ± 0.01 | 00.04 ± 0.00 | 00.05 ± 0.00 |
| 30 | 00.23 ± 0.00 | 01.95 ± 0.01 | 01.90 ± 0.03 | 02.70 ± 0.22 |
| 45 | 02.91 ± 0.01 | 04.84 ± 0.16 | 05.00 ± 0.04 | 06,75 ± 0.13 |
| 60 | 06.04 ± 0.01 | 09.74 ± 0.14 | 09.98 ± 0.09 | 12.95 ± 0.09 |
| 75 | 11.88 ± 0.02 | 15.52 ± 1.30 | 17.49 ± 0.26 | 20.57 ± 0.11 |
| 90 | 18.62 ± 0.04 | 24.45 ± 1.31 | 26.97 ± 0.30 | 30.41 ± 0.10 |
| 105 | 26.28 ± 0.06 | 39.81 ± 2.32 | 38.66 ± 0.28 | 42.51 ± 0.10 |
| 120 | 35.75 ± 0.09 | 47.00 ± 2.12 | 52.89 ± 0.33 | 56.83 ± 0.08 |
| 135 | 46.98 ± 0.11 | 62.80 ± 4.89 | 68.78 ± 0.34 | 74.74 ± 0.07 |
| 150 | 60.02 ± 1.75 | 80.71 ± 1.98 | 86.78 ± 0.36 | 95.58 ± 0.06 |
32 full factorial design layout
Responses of all batches were recorded in From the results optimized batch was detected Batch No. F7. From the design optimized concentration was found as concentration of SiNP at maximum level (X = +1) and concentration of APTMS at low level (X = -1).
Characterisation of msn
% Entrapment efficiency
Final equation in terms of coded factors
% Entrapment efficiency = +52.99 + 26.12 *A – 9.40 B
Final equation in terms of actual factors
% Entrapment efficiency = + 22.68890 + 0.26150*SiNP – 62.64444 APTES
% Entrapment efficiency of nine batches given in Table 14. To determine the effect of independent variables 2D and 3D plots were constructed. Factorial design shows all values are within limits. P value is less than 0.5 hence it is significant. Actual and predicted R2 value shows difference of less than 0.2, hence it is reasonable. 2D and 3D plots shows that high amount of nanoparticles and low amount of binding agent shows high entrapment efficiency. As per equation A has positive effect and B has negative effect on response. This shows the increase in entrapment efficiency as increase in amount of SiNP and decrease in amount of APTES. Reason could be consumption of active bonding sites by APTES. % entrapment efficiency was ranged from 17.61 – 88.29 % of all the experimental runs.
Particle size
Particle size is important characteristic for good drug delivery. Good tuning of particle size is important for drug Particle size is determined using Malvern Zetasizer. According to particle size was detected 164.5 nm.
Scanning electron microscopy
Surface morphology of tamoxifen is found as per image. Morphology shows that mesoporous silica nanoparticles have a spherical structure, uniform shape with smooth surface.
X – ray diffraction
X – Ray diffraction (Rikagu Miniflex 600) was utilized to study nature of MSN shows XRD patterns of MSN. XRD graph of MSN shows broad peaks and absence of sharp peaks, this indicated amorphous nature of MSN. This indicates that, drug was in amorphous or noncrystaline form and it was loaded successfully in MSN.
Solubility studies:
Solubility of tamoxifen and MSN was detected 0.020 and 0.120 respectively in water. 0.032 and 0.165 in PBS having pH 6.8 tamoxifen is a BCS class IV drug hence it is having low water solubility. From the above results, it is concluded that solubility of drug increased when loaded into MSN. Study shows that MSN act as solubility enhancer.
Formulation and evaluation of fdt
Formulation of fdt
Batch F7 were selected for formulation of fast dissolving tablet. Further batches were prepared according to Table No. 6
Precompression evaluation of fdt
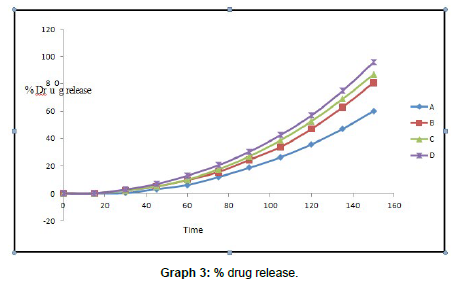
Pre compression studies performed successfully. All studies shows results within standard limit Results of percent drug release are recorded in table no. All batches shows drug release between 0.03– 95.58%. Batch D shows highest drug release that is 95.58% at 150 seconds. It is because high concentration of superdisintegrant. This batch contains 8gm of superdisintegrant. Sodium starch glycolate is used as superdisintegrant. Study was carried out up to 150 seconds.
Conclusion
The present work is formulation and evaluation of MSN loaded FDT of tamoxifen. Aim of work was to enhance solubility and dissolution of drug. Tamoxifen is the anticancerous drug. It is widely used for therapy of breast carcinoma. Tamoxifen is BCS class II drug which is having problem with solubility. It is having very low solubility in water and is soluble in ethanol, methanol. Now a day’s nanoparticles technique is extensively utilized to improve solubility of anticancerous drugs. FDT is used to achieve immediate action of drug and to avoid first pass metabolism of drug. Due to this reasons more quantity of API reaches to site of action. Hence, both nanoparticles and FDT resulted in increased solubility and immediate action. Is result in increased bioavialibility.
Batch D shows rapid drug release which is possible due to MSN. Main aim of project is to increase solubility and rapid release of drug was achieved.
References
- Narayan R, Nayak U Y, Raichur A M, Garg S (2018) Mesoporous silica nanoparticles: A comprehensive review on synthesis and recent advances. Pharmaceutics.
- Mehmood A, Ghafar H, Yaqoob S, Gohar UF, Ahmad B (2017) Mesoporous silica nanoparticles: a review. J. Dev. Drugs.
- Bharti C, Nagaich U, Pal A K, Gulati N (2015) Mesoporous silica nanoparticles in target drug delivery system: A review. Int J Pharm Investig 5: 124-133.
- Rahane R D, Rachh P R (2018) A review on fast dissolving tablet. Journal of Drug Delivery and Therapeutics. 8: 50-55.
- Masih A, Kumar A, Singh S, Tiwari A K (2017) Fast dissolving tablets: A review. Int J Curr Pharm Res 9:8-18.
- Gupta A K, Mittal A, Jha K K (2012) Fast dissolving tablet-A review. The pharma innovation.
- Moreira A F, Dias D R, Correia I J (2016) Stimuli-responsive mesoporous silica nanoparticles for cancer therapy: A review. Micro Mesporous Mat 236: 141-57.
- Kumar S, Malik M M, Purohit R (2017) Synthesis methods of mesoporous silica materials. Mat Today Proc 4: 350-357.
- Heel R C, Brogden R N, Speight T M, Avery G S (1978) Tamoxifen: a review of its pharmacological properties and therapeutic use in the treatment of breast cancer. Drug 16: 1-24.
- Ahmad I (2018) Tamoxifen a pioneering drug: An update on the therapeutic potential of tamoxifen derivatives. Eur J Med Chem 143: 515-531.
- Raymond C R, Paul J S, Quinn M E (2009) Handbook of Pharmaceutical Excipients.
- Shaskey P, Marine Q (2009) Handbook of Pharmaceutical Excipients.
- Shaskey P, Marine Q (2009) Sodium starch glycolate, Handbook of Pharmaceutical Excipients.
- Wang W, Fang C, Wang X, Chen Y, Wang Y et al. (2013) Modifying mesoporous silica nanoparticles to avoid the metabolic deactivation of 6- mercaptopurine and methotrexate in combinatorial chemotherapy. Nanoscale 5: 6249-6253.
Pubmed, Google Scholar, Crossref
Pubmed, Google Scholar, Crossref
Pubmed, Google Scholar, Crossref
Pubmed, Google Scholar, Crossref
Citation: Jadhav V (2022) Formulation and Evaluation of Mesoporous Silica Nanoparticles Loaded fast Dissolving Tablet of Tamoxifen. Clin Pharmacol Biopharm, 11: 296. DOI: 10.4172/2167-065X.1000296
Copyright: © 2022 Jadhav V. This is an open-access article distributed under the terms of the Creative Commons Attribution License, which permits unrestricted use, distribution, and reproduction in any medium, provided the original author and source are credited.
Share This Article
Recommended Journals
Open Access Journals
Article Tools
Article Usage
- Total views: 1903
- [From(publication date): 0-2022 - Apr 02, 2025]
- Breakdown by view type
- HTML page views: 1561
- PDF downloads: 342
