Forest Ecology and sustainable management of the western escarpment of the Rift valley of the Gamo Zone, Southern Ethiopia
Received: 25-Jan-2022 / Manuscript No. jee-22-52479 / Editor assigned: 27-Jan-2022 / PreQC No. jee-22-52479 (PQ) / Reviewed: 08-Feb-2022 / QC No. jee-22-52479 (R) / Revised: 14-Feb-2022 / Manuscript No. jee-22-52479 / Accepted Date: 25-Feb-2022 / Published Date: 25-Feb-2022 DOI: 10.4172/2157-7625.1000317
Abstract
Sustainable use of forest biodiversity through comprehensive studies are gave better life and survival of life on earth. This study was conducted in the western escarpment of the Rift valley of the Gamo Zone, Southern Ethiopia. The main objective was to investigate forest ecology and sustainable management of the study area. A systematic sampling method was used to collect vegetation data from a total 58 quadrats, each 20 × 20 m (400 m2) and five 1 × 1 m (1 m2) sub-quadrats were established at the four corners and at the centre for sapling and seedling estimation. Tree and shrub species were listed; Height (H ≥ 1.5 m) and DBH ≥ 2 cm were measured and recorded. R-statically software and origin were used to analyse the data. A total of 69 woody plant species represented by 48 genera and 29 families were recorded of which Fabaceae was comprised the highest number of species (n=11). Four plant community types were identified and community type 1 had the highest H’ (3.2) and evenness (0.80) whereas the lowest H’ (2.00) and evenness (0.59) was recorded in community type 2. The highest similarity index was observed between community types 4 and 1 while the lowest was between community 3 and 1. The high density of saplings (440.2/ha) and seedlings (825.49/ha) were dominated by few species. However, 3 species (2.9%) had no seedlings and/or saplings at all. Therefore, human induced pressure will be minimizing to investigate current forest ecology and sustainable management, and raising awareness to surrounding community.
Keywords
Forest Ecology; Sustainable management; Diversity
Introduction
Forests worldwide are known to be critically important habitats in terms of the biological diversity they contain and in terms of the ecological functions they serve [1]. Ecologically, the forest gives important environmental benefits by providing carbon sink/ carbon storage service, watersheds protection services (protect soil erosion and flooding) and providing habitats for a large number of animals. Also, the forest serves as a source of food, household energy, construction and agricultural material, tourism and recreation values and medicines for both people and livestock.
The vegetation classification of Africa lay into 21 floristic regional centers of endemism. Ethiopia is dominantly part of Somalia-Masai and Sudanian regional centers of endemism. The diverse topographic factors coupled with the diverse climatic factors have created diverse vegetation types in the country. Consequently, the vegetation of Ethiopia is one of the richest in floristic diversity in Africa and/or in the world and it is now known that 6000 vascular plant species are found, with about 10% endemism. Ethiopia (including Eritrea) has been divided into 16 floristic regions, namely Gojam, Gondar, Bale, upland Shewa, Sidamo, Afar, upland Welo, Tigray, Welega, Illubabor, Kefa, Gamo-Gofa, Arsi, Harerge, Eritrea west and Eritrea east.
Plant communities are the collection of plant species that are growing together in a particular location that shows a definite association with each other. It is the combination of plants that are dependent on their environment, influence one another and modify their environment. Plant communities are largely based on physiognomy or the growth form of the vegetation. Andreucii (2000) explained plant communities as a combination of species that can vary more or less gradually along gradients or discontinuously across spatial variation. This is because they have similar requirements for existence in terms of environmental factors such as light, temperature, water, drainage and soil.
Ethiopia is one of the top 25 biodiversity-rich countries in the world and hosts two of the world’s 34 biodiversity hotspots, namely: the Eastern Afromontane and the Horn of Africa hotspots. It is also among the countries in the Horn of Africa regarded as a major center of diversity and endemism for several plant species. The diverse topography gave rise to a wide range of altitudes and agro-ecological zones. This has resulted in wide variations in rainfall, humidity and temperature as a result of which the country comprises ten ecosystems that range from Afroalpine at the highest elevations to desert and semidesert ecosystems at the lowest elevations. Because of the combined effects of topographic and climatic factors, the country is endowed with diverse ecosystems that are inhabited by diverse animal, plant and microbial species [2].
The study area is facing rapid deforestation and degradation of forest resources due to population pressure that forced the conversion of forest land into other forms (agriculture, settlement, etc.). There was no previous study in the area documenting forest ecology and sustainable management in the study area. Hence in order to address these following research objectives were provided to investigate forest ecology of the study area, to assess the sustainable management methods of the study area.
Materials and Methods
Description of the study area
The study was carried out in the western escarpment of the rift valley of the Gamo Zone, Southern Ethiopia (Figure 1). The forest areas lie at the latitude of 06°07:52’N; longitude of 037°35’07E and elevation of 1208 masl. The topography of the area is characterized by undulant features and streams and rivers. The topography of forests makes the areas suitable position to observe Lake Abaya and this might give additional tourist destiny in the Gamo Zone.

Figure 1: Location map for the study area.
Vegetation cover
Friis (2010) described the vegetation of the study area as Combretum-Terminalia woodland and wooded grassland, Acacia- Commiphora woodland and bushland and Dry evergreen Afromonatne forest. The most common tree species in the area are Terminalia brownii, Combretum molle, Ziziphus mauritiana, Pappea capensis, Cadaba farinosa, Vachellia spp. and Senegalia spp. Balanites aegyptiaca, Commiphora abyssinica, Rhus natalensis, Olea europaea subsp. cuspidata, Psydrax schimperiana, Acokanthera schimperi and Juniperus procera.
Geology and soil
The geology of the Western Rift-valley Escarpment is mainly quaternary volcanic alluvial deposits and lacustrine clay. The soil types are classified into sand, sandy clay loam, sandy loam and loam sandy [3].
Climate
The climate of the study area is a bimodal rainfall pattern and maximum and minimum mean annual rainfall for 20 years between1990-2019 was 1141.1 mm and 491.8 mm, respectively. The maximum and minimum mean annual temperature was 33.6°C and 15°C, respectively (Figure 2).

Figure 2: Annual mean maximum and minimum and rainfall in mm (1990-2019).
Sampling, design and vegetation data collection
A systematic sampling technique was used to collect vegetation data to ensure full coverage of environmental variation and habitat heterogeneity following Kent and Coker (1992). One hundred and two main quadrats (plots) were selected to determine the various parameters of the vegetation in the study area.
Seven transects parallel to each other and approximately 500 m apart from each other were laid along the altitudinal gradient in the western escarpment of the Rift valley. The sampling quadrats were placed at a regular interval of 200 m between each other beginning from the lowest altitude of the escarpment and extending to the highest altitude. Fifty eight main quadrats, each 20 m × 20 m (400 m2) quadrats were used. A Modified-Whittaker nested vegetation sampling method was used to collect species richness, cover-abundance, population, height and Diameter at Breast Height (DBH) of tree species at multiple spatial scales, using 1 m2, and (5 × 5 m) 25 m2 within a 20 m × 20 m (400 m2) main quadrat. Data on trees and shrubs were collected in the main quadrats. Data on seedlings and saplings were collected in 25 m2 subquadrats. The sub-quadrats were placed at the four corners and one at the center of the main quadrat [4].
Height was measured using a Suunto Clinometer and Compass, and DBH was measured using a caliper. Individuals with DBH ≥ 2 cm and height ≥ 1.5 m were considered as trees/shrubs. Individuals with DBH between 0.5 cm and 2 cm and height between 0.5m and 1.5 m were considered as saplings while those with root collar diameter ≤ 0.5 cm and height ≤ 0.5 m were considered as seedlings.
In each quadrat anthropogenic disturbance factors including grazing and disturbance (marks of cutting, fuelwood collection, fire, and charcoal production) were recorded. Impact of grazing intensity class was estimated following Kebrom (1997) and Zerihun and Backeus (1991), as 3 = heavy; 2 = moderate; 1 = lightly; and 0 = not grazed, while the state human activities were estimated following Leul (2010) and Kumelachew and Tamrat (2002) using modified 0-3 subjective scale to determine the degree of the impacts of fuelwood collection, charcoal production, selective tree cutting and fire. The sum of all scores for each quadrat was determined following an overall ranking of human disturbances index in each quadrat following Venkateswaran and Parthasarathy (2003).
Geographical location, altitude, slope and aspect (the direction of the slope of the sample quadrat faces) were recorded using a Garmin GPS 72 (± 3 m accuracy). Slope (%) was recorded using a Suunto Clinometer and Compass. Aspect was coded following Zerhun (1989) as: North=0; East=2; South=4; West=2.5 and NW=1.3.
Voucher specimens of each species encountered in the quadrats and sub-quadrats were collected, pressed and identified in the National Herbarium of Ethiopia, Addis Ababa University and deposited in the Herbarium of Arba Minch University [5].
Data analysis
Plant community
Plant community type classification was determined by polythetic hierarchical agglomerative cluster analysis using similarity ratio by ward method of R version 3.5.3. ‘Vegan’ and ‘cluster’ packages were used for this analysis.
Diversity
Species diversity and evenness were determined by using the Shannon-Wiener diversity index.
Shannon Diversity Index
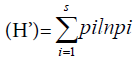
Where ni = the number of individuals belonging to the ith of S species in the sample, n = the number of individuals in the sample, Pi= the probability of sampling species i, ln
  the natural logarithm of the probability of sampling species i.
Shannon’s equitability (J) was calculated to test species evenness as: Equitability (J) 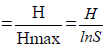
The similarity of species composition among plant communities was assessed using Sorensen’s similarity index:
Ss = 2a/2a+b+c
Where, Ss = Sorensen’s coefficient (index), a = number of species shared between communities, b = number of species found in the first community and c = number of species found in the second community [6].
Vegetation structural
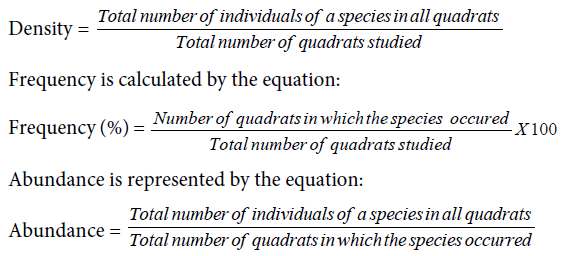
Structural data were analysed using origin, R statistical software and performed on the bases of density, DBH, height, frequency, basal area per hectare and IVI were calculated.
Density is a total number of individuals of each species in all the quadrats is divided by the total number of quadrats studied. Density is calculated by the equation:
Regeneration status
Regeneration status was determined based on the number of seedlings and saplings following Khan (1987). Seedlings and saplings count in the five subplots were summed up and used the value for a plot with an area of 20 m2 to convert into a hectare [6].
Results and Discussion
Floristic composition
A total of 69 species belonging to 48 genera and 29 families were identified. Fabaceae was the most dominant family in terms of species number represented by 11 (16%) species; followed by Anacardiaceae 6(9%) species and Combretaceae and Capparidaceae 5 (15%) species; Tiliaceae represented by 4 (6%) species; Moraceae, Olacaceae and Verbenaceae represented by 3 (13%) species; Balanitaceae, Burseraceae, Celastraceae, Ebenaceae, Rubiaceae, Santalaceae and Vitaceae, represented by 2 (20%) species; 14 (21%) families represented by single species. The plant habit analysis showed that 50.7% trees, Tree/Shrubs 11.6%, Shrubs, 30.4% and 7.3% lianas (Figure 3).

Figure 3: Distribution of plant species by their habits.
Species diversity and evenness
The highest species richness and diversity was observed in quadrat 18 (n=21, H=2.56) while the lowest species richness and diversity was observed in quadrat 27 (n=3, H=0.97). The highest species diversity was observed in community 1 (H’=3.19) and evenness values were 0.8. Community type 2 had the lowest species diversity (H’=1.97) and J value (0.58) (Table 1).
| Community | Richness | H | Shannon_Evenness |
|---|---|---|---|
| 1 | 53 | 3.197991 | 0.80548 |
| 2 | 29 | 1.971309 | 0.585428 |
| 3 | 49 | 2.91693 | 0.749503 |
| 4 | 48 | 2.037823 | 0.526406 |
Table 1: Indices of diversity and evenness in the study area.
Plant communities
Hierarchical classification of the plant species into different communities has been done by agglomerative hierarchical classi using similarity ratio. Based on the analysis of the percentage of cover data of species, four plant community types (clusters) were identified from the classification strategies (Figure 4) [7].

Figure 4: Dendrogram showing community types of the study area.
Similarity between the community types
The Sorensen’s similarity coefficient of the four communities showed that the highest similarity was observed between communities 4 and 1 and followed by between communities 4 and 3 whereas the lowest similarity was observed between communities 3 and 1 (Table 2).
| Community | Community 1 | Community 2 | Community 3 | Community 4 |
|---|---|---|---|---|
| Community 1 | 1 | |||
| Community 2 | 0.5348837 | 1 | ||
| Community 3 | 0.2909091 | 0.5277778 | 1 | |
| Community 4 | 0.8529412 | 0.7333333 | 0.8148148 | 1 |
Table 2: The Sorensen's similarity of the communities.
Vegetation structure
Frequency
Woody plant species were classified into five frequency classes: A=81–100, B=61–80, C=41–60, D=21–40, E= 0–20 % (Figure 6). The most frequently distributed species were Euclea divinorum (84.3%), followed by Rhus natalensis (83.3%), Terminalia brownie (74.5%), Combretum molle (71.6%), Pappea capensis (62.8%) and Dodonaea angustifolia (54.9%) and least frequently distributed species Aloe gilbertii and Calpurnia aurea (1.96%) (Figure 5).
DBH classes

Figure 5: Distribution of species by Frequency class.
DBH were categorized into seven classes (0-5 cm; 5.1-10 cm; 10.1- 15 cm; 15.1-20 cm; 20.1-25 cm; 25.1-30 cm and ≥ 30.1cm). The number of stems in DBH class < 5 cm was 6462.04/ha (62.5%) and had the highest density, whereas DBH ≥ 25.1cm had the lowest density with 88.4/ha (5.1%) (Figure 6). Four different patterns (Inverted J-shape, J-shape, Bell shape and Irregular shape) were revealed based on the analysis of the number of individuals in each DBH size class and eight selected species from five community types shown those patterns (Figure 7).
Height distribution

Figure 6: The distribution of DBH in the study area.

Figure 7: Selected five species DBH class distribution.
The height classes were classified into six categories (I=0-2.5m; II=2.6-5.0 m; III=5.1-7.5 m; IV=7.6-10 m; V=10.1-12.5 m and VI > 12.6 m). The height class frequency distribution of trees and shrubs showed that higher in the height class between 2.6-5 m (51%) and lower between 10.1-12.5 m (0.24%) (Figure 8).

Figure 8: Height distribution of the study area.
Importance Value Index (IVI)
The IVI values were classified into four classes (IVI > 10.1, IVI b/n 5.1-10, IVI b/n 1-5 and IVI < 1). The IVI analysis revealed that IVI > 10.1 represented by 30%, IVI > 5.1-10, 12.6%, IVI > 1-5, 8.7% and IVI < 1, 18.7%. On the other hand, about 18.7% of species each has less than 1% IVI values, for instance, Abutilon figarianum (0.17), Polyscias fulva (0.17), Calpurnia aurea (0.11) and Aloe gilbertii (0.11).
Regeneration status
The seedling and sapling stages were represented by 49 species belonging to 39 genera and 23 families in the study area. The density of saplings (440.2/ha) and seedlings (825.49/ha) were dominated by few species. The seedling and sapling densities in descending order for top five species were Terminalia brownie (77.45/ha), Olea europaea subsp. Cuspidate (48.78/ha), Pappea capensis (41.2/ha), Mystroxylon aethiopicum (29.7/ha) and Dichrostachys cinerea (17.9/ha) (Figure 9).

Figure 9: Regeneration status of the study area.
Discussion
The total number of species recorded in the study area was relatively higher as compared to similar studies in Ethiopia such as Zengena forest: 50 species; West Hararghe zone: 48 species and Kuandisha Afromontane forest: 66 species and lower than Grat-Kahsu dry Forest of Tigray region:102 species; Denkoro forest: 174 plant species (Abate et al., 2006); Komto forest: 180 plant species; Kimphe Lafa: 130 plant species; Belete forest:157 species. This might be due to bimodal rainfalls (high moisture), topography and selection harvesting seems to promote the typical forest species composition. Similarly, report was observed in the Chancha (Desalegn and Zerihun, 2005).
Fabaceae was the dominant family reported in the present study. Similarly, studies carried out at Hirmi woodland vegetation in Tigray Region and Metema deciduous woodlands: Hail (2012) reported the same.
The family Fabaceae contains drought tolerant, deciduous and spiny species that are well adapted to the prevailing drought conditions and have the potential to diverse ecologies of the countries. Those families also show dominant position in Flora of Ethiopia and Eritrea (Fabaceae: 678 species; Poaceae: 609 species and Asteraceae: 472 species. Fabaceae and Asteraceae might have got the top dominant position probably due to having efficient pollination and successful seed dispersal mechanisms that might have adapted them to a wide range of ecological conditions in the past [8].
Magurran (1988) suggests that the Shannon diversity index value falls between 1.5 and 3.5 forests is of good diversity. Diversity index (H’ = 3.2) and evenness (J= 0.80) in the study area was higher as compared to other forest studies in the country such as Zengena forest: H’=2.74; Kuandisha Afromontane forest: H’=2.5; Grat-Kahsu protected dry natural vegetation of Tigray region: H’=2.38; Tara Gedam: H’ = 2.98, J=0.65; Yemrehane Kirstos Church: H’=2.88, J=0.79; and Berbere: H’=2.95, J=0.76 and lower than Metema Area: H’=3.6, J=0.48; Sire Beggo in Gololcha District: H’=3.8, J=0.87 and East Wollega Zone: H’=3.98, J=0.88.
All four community types showed generally high species diversity, Evenness and dominance. This shows those plant communities are categorized based on the % of cover of tree and/or shrub species and others habit hence belong to the same community. In each community type the sample quadrats are shown differences in altitude, soil type, PH and other environmental factors. The community types varied in size, ranging from 9-30 quadrats and shared high species numbers. In all community types, vegetation structure showed four patterns that are inverted J-shape, bell-shape, irregular shape and J-shape pattern [9].
An inverted J-shape pattern was observed in all community types and species shown this pattern were Combretum molle, Pappea capensis and Terminalia brownii. These species had a high number of individuals in the lower DBH size classes and the low number of individuals in the higher DBH size classes. This implies that it has good regeneration potential and resists drought conditions and human induced pressures. Similar results were reported from Girma and Melesse (2020); Ahmed (2017); Fikadu (2014); Feyera (2007); Feyera and Demel (2001).
The second pattern (Bell-shaped) was shown in the community 1, 2and 3 showed relatively high numbers of species in the middle classes. Species shown this pattern were Ficus sycomorus. These species are common shade and fodder trees that could be used. They have poor regeneration potential and are exposed to human induced pressure.
Third pattern (Irregular) was shown in the community 1, 3 and 4 and these communities showed that disturbance and irregular pattern of DBH. This implies a non-uniform number of the individual at any DBH class. Species with this pattern were Pappea capensis, Sclerocarya birrea and Senegalia mellifera. In the study area, these species are important for household furniture making, fuelwood, live fences and exposure to humane induced pressure (especially, selective tree cutting). Similar results were reported by Debissa (2017) Vegetation Ecosystem of Ethiopia; Fikadu (2014) in the boda dry evergreen Montana forest and Teshome (2012) in the rangeland of Southeast Ethiopia [10].
Finally, a ‘J-shape’ pattern was shown in the community 2 and 4. It has a low number of individuals in the lower DBH size classes and a high number of individuals in the higher DBH size classes. Species shown these patterns were Balanites aegyptiaca and Ficus vasta. This could be due to the high exposure of the escarpment for heavy grazing/ browsing, harvested at an early growth stage by the local people for fodder, charcoal production, live fence and built local houses. Several studies were reported in the different regions of the country for example Feyera (2007) in the Sheko forest; Ahmed (2017) in the Hallideghie wildlife reserve; Debissa (2017) Vegetation Ecosystem of Ethiopia; Fikadu (2014) in the boda dry evergreen Montana forest; Teshome (2012) in the rangeland of Southeast Ethiopia and Feyera and Demel (2003) in the Kimphe Forest.
Overall, communities 3 and 4 needed conservation at the community level and at species level Balanites aegyptiaca, Crateva adansonii, Faidherbiaa lbida, Vachellia tortilis and Sclerocarya birrea. This is due to expansion of agriculture, settlement and energy sources (Charcoal production and fuelwood collection) and household furniture expensive in the market [11].
Conclusion
The species diversity of the study area was comprised 69 plant species belonging to 48 genera and 29 families. Shannon diversity index value falls between 3.2 and 0.59 forest is of good diversity. Four plant communities were identified and described with varying degrees of species richness, evenness and diversity. Community type 1 had the highest species diversity and richness while community 2 had low species diversity recorded. The variation in species composition and diversity among communities could be associated with different environmental factors, such as organic matter, altitude, soil properties, slope, aspect and disturbances [12].
DBH class < 5cm had highest density (62.5%) and DBH ≥ 25.1cm had the lowest density (3%). The density of woody species decreases with increasing DBH and height, indicating the predominance of small-sized individuals in the area. Four population patterns have been observed; inverted J, J- shaped, irregular and bell-shaped. Species with high IVI values were recorded for example Pappea capensis (17.73), Combretum molle (15.75), Terminalia brownii (14.23),Euclea divinorum (14.18) [13].
Regeneration analysis of woody species revealed that the density of seedlings (825.49/ha) and saplings (440.2/ha) were dominated by few species and most of the tree species (48.5%) are without seedling and sapling stage in the escarpment, some tree species are without sapling stage while others are represented by all stages (seedling, sapling and mature). Based on this result communities 3 and 4 are priority classes for conservation. This study revealed that a number of valuable plant species are found in the escarpment, and if conservation measures are not introduced soon there may be a great loss of species diversity and associated components of biodiversity [14, 15].
References
- Ayalew A, Bekele T, Demissew S (2006) The Undifferentiated Afromontane forest of Denkoro in the central highland of Ethiopia: A floristic and Structural Analysis. Ethiop J Sci 29: 45-56.
- Eshetea A, Stercka F, Bongers F (2011) Diversity and production of Ethiopian dry woodlands explained by climate and soil stress gradients. For Ecol Manag 261: 1499-1509.
- Berhanu A, Demissew A, Woldu Z, Didita M (2017) Woody species composition and structure of Kuandisha afromontane forest fragment in Northwestern Ethiopia. J Res 28: 343-355.
- Assefa A, Demissew S, Woldu Z (2013) Floristic composition, structure and regeneration status of Masha forest, south-west Ethiopia. Afr. J Ecol 52: 151-162.
- Dibaba A, Soromessa T, Kelbessa E, Tilahun A (2014) Diversity, Structure and Regeneration Status of the Woodland and Riverine Vegetation of Sire Beggo in Gololcha District, Eastern Ethiopia. Momona Ethiop J Sci 6: 70-96.
- Walelign A, Ketay D, Yemshaw Y, Edwards S (2007) Diversity and status of regeneration of woody plants on the peninsula of Zegie, Northwestern Ethiopia. Trop Ecol 48: 37-49.
- Ayanaw A, Dalle G (2018) Woody species diversity, structure, and regeneration status of yemrehanekirstos church forest of Lasta Woreda, North Wollo Zone, Amhara region, Ethiopia. Int J For Res 1-8.
- Muhammed A, Eliasb E (2020) Tree species composition, structure and regeneration status in Munessa natural forest, Southeastern Ethiopia. Eurasian J Forest Sci 8: 35-53.
- Asmelash B, Orjan T, Stein RM (2013) Woody plant assemblages in isolated forest patches in a semiarid agricultural matrix. Biodivers Conserv 22: 2519-2535.
- Brook W, Sodhi SN, Bardshaw CJA (2008) Synergies among extinction drivers under global change. Tre In Ecol Evol 23: 453-460.
- CBD, Plant Conservation Report (2020) A review of progress towards the Global Strategy for Plant Conservation 2011-2020.
- Cristofoli S, Monty A, Mahy G (2010) Historical landscape structure affects plant species richness in wet heathlands with complex landscape dynamics. Landsc Urban Plann 98: 92-98.
- Darbyshire I, Lamb H, Umer M (2003) Forest clearance and regrowth in Northern Ethiopia during the last 3000 years. The Holocene 13: 537-546.
- Asefa D, Ayele T, Ayana M (2019) Characterizing soils and the enduring nature of land uses around the Lake Chamo Basin in South-West Ethiopia. J Ecol Environ 43: 2-32.
- Taketay D (2001) Deforestation, wood famine, and environmental degradation in Ethiopia’s highland ecosystems: urgent need for action. Northeast Afr Stud 8: 53-76.
Indexed at, Google Scholar, Crossref
Indexed at, Google Scholar, Crossref
Indexed at, Google Scholar, Crossref
Indexed at, Google Scholar, Crossref
Indexed at, Google Scholar, Crossref
Indexed at, Google Scholar, Crossref
Indexed at, Google Scholar, Crossref
Indexed at, Google Scholar, Crossref
Citation: Dingamo T, Takele S, Woldu Z, Demissew S (2022) Forest Ecology and Sustainable Management of the Western Escarpment of the Rift Valley of the Gamo Zone, Southern Ethiopia. J Ecosys Ecograph 12: 317. DOI: 10.4172/2157-7625.1000317
Copyright: © 2022 Dingamo T, et al. This is an open-access article distributed under the terms of the Creative Commons Attribution License, which permits unrestricted use, distribution, and reproduction in any medium, provided the original author and source are credited.
Share This Article
Recommended Journals
Open Access Journals
Article Tools
Article Usage
- Total views: 2261
- [From(publication date): 0-2022 - Apr 04, 2025]
- Breakdown by view type
- HTML page views: 1708
- PDF downloads: 553