Forensic Analysis with the Help of Liquid Chromatography
Received: 02-Jun-2022 / Manuscript No. gnfs-22-71169 / Editor assigned: 06-Jun-2022 / PreQC No. gnfs-22-71169 (PQ) / Reviewed: 20-Jun-2022 / QC No. gnfs-2271169 / Revised: 23-Jun-2022 / Manuscript No. gnfs-22-71169(R) / Accepted Date: 23-Jun-2022 / Published Date: 30-Jun-2022 DOI: 10.4172/2572-0899.1000190
Abstract
Despite its forensic importance as trace evidence, soil is under-utilized by forensic scientists due to a lack of research into the suitability of analytical approaches and a subsequent lack of understanding of the soil composition. Ultra-high performance liquid chromatography was used to analyze acetonitrile extractions from 210 soil samples taken from four locations across the Geelong and Surf Coast Shire areas of Victoria, Australia from March 2020 to January 2010. With the aid of principal components analysis of the UV-visible data chromatograms, it was found that this method could discriminate soil between locations, time points, and age points, and therefore, for the first time, shows that the method may offer a reliable method for forensic soil analysis. The approach used PCoA plots representing Bray-Curtis similarities comparing the UHPLC peak profiles which was able to show that the soil chemistry changes are cyclic, a factor that will help improve the utility of this approach for forensic analysis. As the separation was performed using a C18 column, the LDA scores suggest that hydrophobicity based on methyl selectivity may be important in spatial discrimination using this method. Further this type of approach generates a simple visual data.
Keywords
Analytical chemistry; Forensic science; Liquid chromatography; Soil chemistry
Introduction
Due to the ubiquitous nature of soil, it is often present on objects or people associated with crimes through transfer on location of the crime. It can be found on or associated with tools, weapons, tyres and shoes, and individuals, along with burial sites and as such, soil can be useful to validate or eliminate case theories. However, it is important to note that soil evidence is often present in small quantities or hard to recover, and therefore soil sampling and analysis techniques used should ideally be sensitive and non-destructive. The use of soil within a criminal context date back as far as Germany in 1856, where comparisons of sandy soils along a train route were compared via microscopy as evidence in a coin heist. Other scholars highlight the use of soil in the popular works of Sir Arthur Conan Doyle in Sherlock Holmes in the late 19th and early 20th centuries, Hans Gross – an Austrian forensic scientist who, in 1893, suggested that ‘the dirt on someone's shoe could tell more about where a person had last been than toilsome inquires’ a German chemist who, in 1908, used soil samples on a suspect's shoe to support the theory of the crime in the murder of Margarethe Filbert [1-3]. Despite this long history of forensic soil analysis, it is yet to gain popularity in many forensic facilities, and has even fallen out of favor since the 1990s. It has been suggested that this lack of forensic use is due to soil, and its associated examinations, being considered to require highly trained experts, high costs, and technical instrumentation. As such, in Australia, most soil examinations are performed outside of government facilities and often do not fall under the certification of standard forensic laboratories and, as such, the results may not always be fit for court. It has been suggested that the ideal trace evidence should be very small and highly individualistic with a high likelihood of transfer and retention between materials. Traces should also be easily and quickly collected, separated, and concentrated, with the smallest traces being able to be categorized and for easy comparison to be possible through a computerised searchable database. Based on these criteria, scholars such as Fitzpatrick have suggested that soil is ideal trace evidence, as the range of factors influencing soil profiles make it highly unique with very small particles that are easily transferred and categorized. Whilst technology currently limits the ability to create a computerised, searchable database covering all soil variables, some soil databases have been started across the globe, especially in the United Kingdom –where multi-laboratory confirmation for surface and near-surface soil sample elemental analysis is being employed - and the United States of America. However, their results only showed promise as a presumptive test and it was suggested that HPLC analysis be used in conjunction with analyses such as colour, texture, and density gradient. Although, their paper did highlight how, if major peaks of the chromatogram could be identified, that this could provide potentially useful information for investigators should the peak show a compound consistent with certain ecologies. Reuland and Trinler's experiments used a quick acetonitrile extraction, however, required samples to be dried in an oven for two hours as well as evaporation of excess supernatant following extraction, which lowered the time efficiency of this process, although some time efficiency was returned through a 10-minute isocratic HPLC run [4-7].
Materials and Method
Throughout the project, six sites across four locations in the Geelong and Surf Coast Shire were used. Soil samples were collected from four locations: a private residence in Gherang (S 38.320, E 144.061 [Bush 1–3]), Deakin University Waurn Ponds Campus (S 38.195, E 144.294), a sheep farm in Middleware, and a cattle farm in Modewarre (S 38.273, E 144.102). All locations were classified as sod sol soils, which are characterized by high sodium content, and all non-Bush locations are classified as non-forest, with the Bush location classified as native open forest. However, locations had different landform patterns, with the Bush location being a plateau, the cattle farm being lava plains bordering on alluvial plains, and the sheep farm bordering landform patterns lava and alluvial plains and rises. The sample processing method was optimized from the one presented by McCulloch, Morgan and Bull in their 2017 paper where optimization of the soils samples with the key factors optimized here the included the centrifugation, which was more rapid, an increase in solvent volume from 500 μL to 1 mL and the use of a 0.45 μm filter. Samples were frozen (−20 °C) between collection and processing to prevent decomposition of organic compounds. Samples of 250 mg were measured, using weighing by difference, in quintuplicate into 1.5 mL micro centrifuge tubes. The initial HPLC trials were performed with 10 replicates to gain an understanding of localized heterogeneity of the soils. Soil was transferred using a clean spatula which was washed with acetone between each sample. Acetonitrile (1 mL) was added to each tube via an auto pipette and then the samples were solicited at room temperature for 20 min. The tubes were then centrifuged at 12,500 rpm for 2 min and the supernatant was then transferred to HPLC vials via a 1 mL syringe and 0.45 μm filters. All samples were stored at −20 °C until analysis.
Results and Discussion
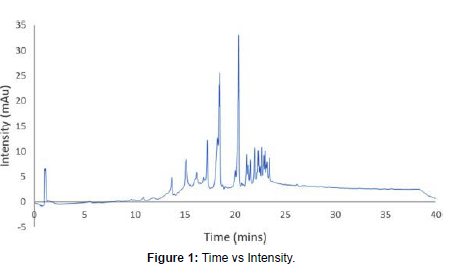
The characteristic UHPLC chromatograms for the extracted soil samples can be observed in Fig. 3 where here was an average of 30 peaks per sample (minimum (min.): 14, maximum (max.): 50, median: 31, mode: 35), and an average of 42 samples per peak (min: 1, max: 169, median: 7, mode: 1 (Figure 1).
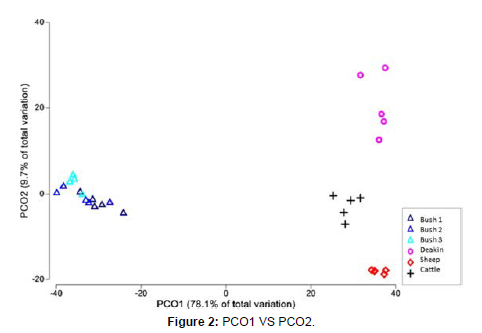
The full UHPLC peak profiles from the spatial samples were analysed and a PCoA plot was generated, and the results can be observed. It was found that the samples clustered by location – represented by different shapes – and, in the case of the Bush sites, by site – represented by different colors. Whilst some locations, such as the Sheep farm (red open diamonds), clustered more tightly than others, such as Deakin (open pink circles), the data is clearly discriminated based on location (Figure 2).
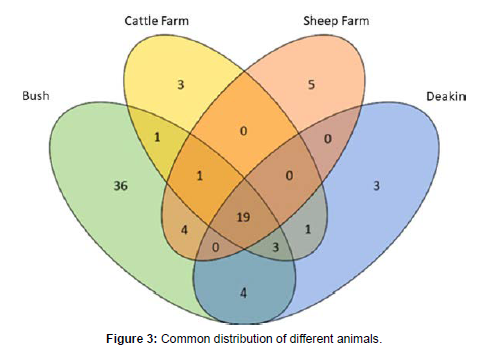
The most similar sites when group averages were taken – were between Bush 2 and Bush 3 (91.6% similarity), with the most similar non-Bush sites being the Sheep farm and the Cattle farm (71.7% similarity). The most difference between sites was seen between the Sheep farm and Bush 3 (24.3% similarity). Group-average agglomerative hierarchical clustering (Bray-Curtis similarity) revealed that the non-Bush sites were more similar to each other (61.1–71.7%) than the Bush sites (24.3–38.9%). Similarly, the Bush sites were more similar to each other (83.7–91.6%) than Deakin, the Sheep farm, and the Cattle farm (24.3- 38.9%). As such, it was found that broadly the six sites clustered into two groups consisting of the Bush sites and the non-Bush sites. These groups are consistent with the PCoA plot, which shows the non-Bush sites all on the right and Bush sites clustering in one group on the left. An important finding is that, whilst the Bush location is geographically closer to the Sheep farm (approximately 8 km) and the Cattle farm (about 6 km) than either of these latter locations are to Deakin (approximately 16 km and 19 km, respectively). As such, it appears that geographical closeness does not equate to chemical similarity. A Venn diagram, (SI Figure 1), examining the 67 peaks present in Bush site samples, showed that Bush 1 and 3 had more unique peaks (11 and 14, respectively) than Bush 2 (4). In contrast, the non-Bush sites had 44 peaks present. As such, of the 79 peaks present in spatial samples, 84.8% were present in the Bush sites and 55.7% were present in the non-Bush sites. Further, 45.6% of peaks present in the spatial samples were unique to the Bush sites whereas only 13.9% were unique to the non-Bush sites, showing that even in one location – such as the Bush location – there is heterogeneity. As such, it would be interesting to conduct further examinations to see if sampling from more sites at the non-Bush locations would produce a larger number of peaks unique to those locations and thus aid forensic discrimination [8-10].
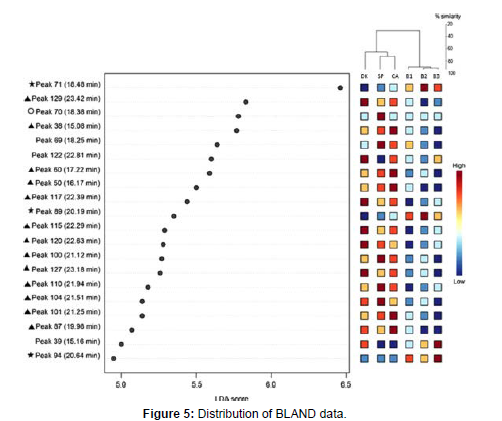
It is important to consider the limitations of these experiments and the data analysis, which was performed on automatically integrated peaks. As Peaks 69, 70, and 71 – which are all key peaks for temporal discriminations consistent across all sites – all have very similar retention times (18.38, 18.48, and 18.55 min respectively). As such, they co-elute with Peaks 69 and 70 appearing as shoulders on Peak 70.. This means that, whilst these peaks are driving differentiation, manual integration – or manual confirmation of the automatic integration – may be required to confirm these peaks. From a forensic perspective the mass spectrometry extracted ion chromatograms aid in this process however for utilizing the simpler and cheaper UV-visible detector highlighted here separation improvements might be required on a case by case level including targeting these peaks for a multidimensional chromatography separation Despite this limitation, it is observed here that a range of peaks are driving the change and the approach is appropriate. Importantly this robust approach might be of benefit to forensic jurisdictions where budgets are tight and mass spectrometry is out of reach for prioritizing (Figure 3).
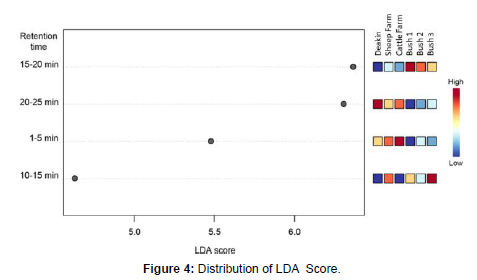
As the separation occurred using a C18 column, the LDA scores suggest that hydrophobicity based on methyl selectivity may be important in spatial discrimination using this method. On a C18 column, compounds are retained based on polarity, with non-polar compounds, such as those with more methyl groups, eluting later than compounds.
Mass spectrometry was used to examine some of these key peaks and to gain a broad understanding of the mass range of molecules involved in driving the differentiation in this project. The characteristic negative and positive (Figure 4) mass spectra from each site are shown in and the masses of key ions from these peaks shown in (SI Table 1). The team made efforts to cross reference the key molecular ions with the NIST database however no key matches were identified. The data here forms a platform noting the mass spectral data of the key metabolite of interests and fractionation and NMR characterization is required to fully elucidate these chemical structures. Further the soil biochemistry is known to be very complex and the micro biome of soil and secondary metabolites from plant species interacting with soil add to this complexity (Figure 5).
Overall, the relative abundances of all sites top 20 peaks follow patterns that support the hypothesis of a seasonal effect on soil chemistry, with higher abundances clustering in time points per season. For instance, Peak 103 in Bush 1 is present at higher intensities at blue, winter time points (T3 to T7) than other time points. However, there are some peaks key – such as Peaks 38 and 89 at Bush 3 - to discrimination that do not follow these patterns, which suggests that temporal changes to soil's chemical fingerprint are more complex that just a seasonal pattern. For instance, the key components driving the discrimination are likely to be generated through the plant materials as it degrades at specific sites and from the organic material contribution from the animals on the farms.
Conclusion
Through the examination of 270 soil samples, it was found that ultra-high performance liquid chromatography with UV-visible detection can be used to discriminate between soil samples taken from different locations, and at different times. It was found that the methods previously suggested by other scholars showed great promise for improving forensic practice when handling soil trace evidence, especially when refined as per this project. The method was also found to be sensitive and able to detect difference in small sample sizes an amount that might be useful for forensic investigations. It was also found that there was significant differentiation with PCoA analysis between both site and time, and site and age, indicating that soil samples are unique to both time and place, allowing for greater discrimination between samples. This study highlights the importance of the cyclic nature of soil chemistry and the impact of seasonal changes which need to be considered as part of forensic soil analysis.
References
- Lo YMD, Corbetta N, Chamberlain PF, Rai V (1997) Presence of fetal DNA in maternal plasma and serum Lancet 350:485-487.
- Devaney SA, Palomaki GE, Scott JA, Bianchi DW(2011)Noninvasive fetal sex determination using cell-free fetal DNA: A systematic review and meta-analysis. J Am Med Assoc 306: 627-636.
- Johnson CL, Warren JH, Giles RC (2003) Validation and uses of a Y-chromosome STR 10-plex for forensic and paternity laboratories. J. Forensic Sci 48:1260-1268.
- Sullivan KM, Mannucci A (1993)A rapid and quantitative DNA sex test: Fluorescence-based PCR analysis of X–Y homologous gene amelogenin. BioTechniques 15: 636-638.
- Fan HC, Blumenfeld YJ, Chitkara U, Hudgins L, Quake SR (2010) Analysis of the size distributions of fetal and maternal cell-free DNA by paired-end sequencing. Clin Chem 56: 1279-12869.
- Fry DL (1968) Acute vascular endothelial changes associated with increased blood velocity gradients. Circ Res 22(2): 165-197.
- Caro CG, Fitz-Gerald JM, Schroter RC (1971) Atheroma and arterial wall shear. Observation, correlation and proposal of a shear dependent mass transfer mechanism for atherogenesis. Proc R Soc Lond B Biol Sci 177(46): 109-159.
- Ku DN, Giddens DP, Zarins CK (1985) Pulsatile flow and atherosclerosis in the human carotid bifurcation. Positive correlation between plaque location and low oscillating shear stress. Arteriosclerosis 3:293-302.
- Friedman SG, Kerner BA, Friedman MS (1989) Limb salvage in elderly patients. Is aggressive surgical therapy warranted. J Cardiovasc Surg 30(5): 848-851.
- Korner I, Blatz R, Wittig T (1999) Serological evidence of Chlamydia pneumoniae lipopolysaccharide antibodies in atherosclerosis of various vascular regions. Vasa 28(4):259-263.
Indexed at, Google Scholar, Crossref
Indexed at, Google Scholar, Crossref
Indexed at, Google Scholar, Crossref
Indexed at, Google Scholar, Crossref
Indexed at, , Google Scholar, Crossref
Citation: Levine D (2022) Forensic Analysis with the Help of Liquid Chromatography. Glob J Nurs Forensic Stud, 6: 190. DOI: 10.4172/2572-0899.1000190
Copyright: © 2022 Levine D. This is an open-access article distributed under the terms of the Creative Commons Attribution License, which permits unrestricted use, distribution, and reproduction in any medium, provided the original author and source are credited.
Share This Article
Open Access Journals
Article Tools
Article Usage
- Total views: 1560
- [From(publication date): 0-2022 - Apr 04, 2025]
- Breakdown by view type
- HTML page views: 1223
- PDF downloads: 337

