Research Article Open Access
Fluid Interaction with Tight Rocks to Induce Energy Recovery
Wang Dongmei*, Zhang Jin, Raymond Butler, Adam Clark , Dave Koskella and Racheal Rabun
School of Geology & Geological Engineering, University of North Dakota, USA
- *Corresponding Author:
- Wang Dongmei
School of Geology & Geological Engineering
University of North Dakota, USA
Tel: +1 701-777-6143
E-mail: Dongmei.Wang@Engr.und.edu
Received Date: March 12, 2017; Accepted Date: March 18, 2017; Published Date: March 25, 2017
Citation: Dongmei W, Jin Z, Butler R (2017) Fluid Interaction with Tight Rocks to Induce Energy Recovery. Oil Gas Res 3: 134. doi: 10.4172/2472-0518.1000134
Copyright: © 2017 Dongmei W, et al. This is an open-access article distributed under the terms of the Creative Commons Attribution License, which permits unrestricted use, distribution, and reproduction in any medium, provided the original author and source are credited.
Visit for more related articles at Oil & Gas Research
Abstract
The research using aqueous surfactant fluid to interact with tight rocks to increase petroleum production was conducted from our group in 2009. As part of our effort to assess the potential for imbibition to recovery oil from shale, we studied the porosity, permeability to oil, permeability to waters (brine water, and surfactants), and spontaneous surfactant intake for Bakken and Niobrara rocks. We observed that porosities for Niobrara cores were generally higher than those from Bakken cores. Consistent with the Darcy equation, rate-independent water and oil permeability was noted. Cores from the Niobrara and Bakken formations exhibited a broad range of permeability, ranging from 0.11 to 26 microdarcys (μD). In the Niobrara formation, permeability was least in marl (0.1-4 μD), larger in chalk (1-15 μD), and greatest in sandstone (8-26 μD). Although variations occurred, the absolute permeability to water, permeability to oil, and permeability to surfactant formulations were all comparable. The surfactant formulations tested exhibited a favorable potential for fluid flowing in both formations by spontaneous imbibition. The average oil recovery by spontaneous imbibition of the selected surfactants was ranged from 13 to 57% OOIP at optimal salinity, at least 5 percentage incremental in oil recovery over brine water imbibition.
Keywords
Tight rock; Recovery; Permeability; Porosity
Nomenclature
BOPD: Barrels of Oil Per Day
OOIP: Original Oil in Place, ml
TDS: Total Dissolved Solids
Vrock: Volume of the Shale Rock, cm3
W1: Dry Weight of the Shale Rock, g
WO: Weight after Oil Saturation, g
â�?³W: Weight Change, g
μo: Oil viscosity, cP
μs: Surfactant Solution Viscosity, cP
μw: Water Viscosity, cP
ρo: Oil Density, g/cm3
ρw: Brine Density, g/cm3
�?: Porosity, Fractional
SI Metric Conversion Factors
cp × 1.0*E-03 =Pa•s
ft × 3.048*E-01=m
in. × 2.54*E+00=cm
mD × 9.869 233E-04=μm2
μD × 9.869 233E-07=μm2
psi × 0.00689E+00=MPa
Introduction
As an unconventional energy resource, the Bakken Formation has long been considered an important source rock for oil in the Williston Basin. Numerous studies have examined the geochemistry and hydrocarbon potential of the Bakken shale. The naturally fractured Bakken Formation consists of thin shale and silty carbonate sequences, capable of producing oil at economic rates when completed using hydraulically fractured horizontal wells. However, because of its low permeability and oil-wet character [1]. It has undergone several stages of development since the 1950’s, including vertical drilling, horizontal wells, and horizontal wells with hydraulic fracturing. Wells completed in unconventional plays exhibit limited drainage areas and yield a low oil recovery [2-4]. Up until 2010, primary recovery values in the range of only 3%-10% OOIP have been reported for the Bakken [5]. The Bakken Formation in North Dakota is a relatively thin clastic unit solely in the subsurface and consists of three informal units termed the Lower, Middle, and Upper members. The formation reaches a maximum thickness of 46 m (150 ft) in the central portion of the basin. The Middle Bakken member is the primary producing interval, ranging from 40 to 70 ft in thickness. Lithologies vary from argillaceous dolostones and siltstones to clean, quartz-rich arenites and oolitic limestones. These self-sourced reservoirs are over-pressured. The porosity is commonly 2-3%, with one-tenth of that volume, or 0.2% in micro-fractures. The ratio of fracture to matrix permeability is 100 to 1, with an effective permeability for the fracture system of only 0.6 md. Oil production is possible through an extensive fracture system, both natural and hydraulically fractured. Gosnold constructed a temperature gradient contour map for much of the Williston Basin. The paleogeothermal gradient used in the model was about -40°C/Km [6]. Pitman concluded that the temperature of the Middle member at maturation ranged from 80 to 120°C, based on organic acid experimental studies and a burial model [7]. The upper shale member of the Bakken is lithologically similar to the lower shale member and consists of dark-gray to brownish-black to black, slightly calcareous, organic-rich shale [8]. The maximum thickness can reach 9 m (28 ft) for the Upper member in North Dakota, and 17 m (55 ft) for the Lower member in North Dakota. Both upper and lower shales have low porosity and ultra-low permeability. The Niobrara Formation is also a major tight hydrocarbon resource. Niobrara Shale is similar of the Bakken Shale (North Dakota) in natural fractures and low permeability, and includes chalks, shales and sandstones. From 1969 to 1979, the average production rate per well was less than 5 Barrels of Oil Per Day (BOPD). A search of all completion techniques associated with Niobrara Formation was thoroughly conducted, and only one was found to have a slight degree of success. This was a stimulation treatment involving introduction of a surface tension reducing surfactant that increased the production rate to 10 BOPD [9]. Large production declines seen in the late stages of Niobrara stimulation development were reportedly due to failed penetrating fractures [10]. Since 2001, the Niobrara has been a hot play for oil. The Wattenberg field in the Denver–Julesburg basin (DJ Basin) is still in the early stages on the Niobrara play, but results look very promising. The Niobrara Formation is a sequence of marine shale, marl, and thin carbonate deposits varying from 45-100 feet in thickness. The major target members in this paper are located from 6800 ft to 7100 ft in depth. The permeability measured in the most permeable part is in microdarcies Yang [11], and porosity is 5-10%. Although vertical drilling remains economic, horizontal wells with multiple-fractures stages are gaining ground. The lithologies and welllog curves of Bakken Formation and Niobrara Formation described in this paper are shown by Figures 1 and 2. Table 1 shows a general geological property comparison. As part of our series of investigations involving aqueous liquid imbibition (using surfactant or brine formulations) to stimulate oil recovery from shale (Wang et al. and Zhang et al.), we are studying fluid flow through, and especially, uptake of surfactant solutions into tight sands, shale, and chalk to displace oil. The ultimate objective of these studies is to determine whether surfactant formulations can imbibe into and displace oil from shales. Our previous target was the Bakken Formation in North Dakota. Our earlier studies in this area focused on the microdarcy permeability of Bakken cores to Bakken oil (with no water present). Permeabilities were basically independent of flow rate, in agreement with expectations from the Darcy equation. At optimal salinity, the incremental oil recovery (during imbibition into Bakken cores at 120°C) was up to 18% OOIP more than that observed during comparable experiments using previous formulations at 15-30% total dissolved solid (TDS). To further our understanding of flow behavior in tight rocks, we are also investigating porosity and permeability characteristics of shale/chalk/ marl samples from the Niobrara Formation (Colorado). In this paper, we determined porosities and permeabilities without application of high overburden stresses to avoid breaking thin core slices of several types of tight rocks (shale/chalk/marl) from different formations in two different basins (Williston Basin in North Dakota and DJ Basin in Colorado). The method utilized an ISCO pump which can provide very low flow rates to the tight rocks. Because of our measurement method, technically, we measure the effective porosity that is accessible to our oil and brine. Our primary interest here is investigating whether surfactant imbibition is feasible as an oil displacement mechanism in shale/chalk. Permeabilities were determined over a range of flow rates and throughput values using either Bakken crude oil or Niobrara crude oil. Furthermore, we tested the ability of the cores (filled with oil) to spontaneously imbibe surfactant formulations. These tests involve two oils and the respective formation waters (synthesized based on actual produced water analysis).

Figure 1: Lithology and well log of Well AV Wrigley 163-94-0707 H1 of Bakken Formation.

Figure 2: Lithology and well log of Niobrara Formation (Modified from Sonnenberg 2012 and Pollastro 1992).
| Bakken | Niobrara | |
|---|---|---|
| Age | Late Devonian/Mississippian | Upper Cretaceous |
| Lithology | Interbedded sequence of siltstones and sandstones with less amounts of shale, dolostones, and limestones rich in silt, sand, and oolites | Chalk Marl Sandstone |
| Depth* | 7338 to 7450 ft. | 6536 to 6809 ft. |
| Thickness | 112 ft (include upper and lower members) | 273 ft. |
| Porosity | 2-6% | 5-10% |
| Permeability | <0.1 md | < 0.1 md |
| Fractures | M & F | M & F |
| Spacing | 640-1280 | 640 |
| Oil Gravity* | 43° | 41° |
| Pressure | Mod-high | Normal to High |
| Temperature* | 120°C | 107°C |
| Formation water salinity* | 280,000 mg/L | 25,418 mg/L |
*Conversion is exact.
Table 1: Geological Properties of the Bakken and Niobrara Formations.
Methodology
Porous media and test fluids
Porous media: The shale rock plugs were from the Middle member of Bakken Formation (Well #16433 and Well #17450) and four stratigraphic zones in the Niobrara (Well #X). The lithologies of the two wells from Bakken Formation varied from a light-gray to mediumdark- gray, interbedded sequence of siltstones and sandstones with less amounts of shale, dolostones, and limestones rich in silt, sand, and oolites. Contrast the lithologthies of the well from Niobrara Formation is combined by chalk, marl, and tight sandstone. Our core plugs were typically 25-26 mm in diameter and 1-10 mm in thickness for porosity and permeability tests, and 25-38 mm in thickness for spontaneous imbibition tests. The dimensions of each core were measured very accurately to 0.01 mm with a precision digital caliper. Tables 2 and 3 list properties of the initial cores used for porosity and permeability measurements.
| Core | Length, mm | Diameter, mm | Porosity, volume fraction |
|---|---|---|---|
| 1 | 2.95 | 24.54 | 0.05 |
| 2 | 2.17 | 24.85 | 0.01 |
| 3 | 2.34 | 24.98 | 0.015 |
| 4 | 2.27 | 24.8 | 0.016 |
| 5 | 2.11 | 24.84 | 0.012 |
| 6 | 2.4 | 24.84 | 0.045 |
| 7 | 2.26 | 24.94 | 0.02 |
| 8 | 2.44 | 24.79 | 0.03 |
| 9 | 2.72 | 24.81 | 0.038 |
| 10 | 2.16 | 25.18 | 0.019 |
| 11 | 2.55 | 24.83 | 0.055 |
| 12 | 2.28 | 24.9 | 0.022 |
| 13 | 2.21 | 24.75 | 0.017 |
| 14 | 2.06 | 24.81 | 0.012 |
| 15 | 2.35 | 24.91 | 0.046 |
| 16 | 2.38 | 24.89 | 0.054 |
| Average | 0.029 |
Table 2: Porosity of Bakken Cores.
| Core | Lithology | Length, mm | Diameter, mm | Porosity, volume fraction |
|---|---|---|---|---|
| 1 | Core-1-Chalk | 9.25 | 25.5 | 0.022 |
| 2 | Core-2-Chalk | 12.61 | 25.53 | 0.024 |
| 3 | Core-3-Chalk | 9.91 | 25.46 | 0.02 |
| 4 | Core-4-Marl | 9.44 | 25.45 | 0.057 |
| 5 | Core-5-Codell Sandstone | 7.65 | 25.33 | 0.057 |
| 6 | Core-6-Codell Sandstone | 7.61 | 25.32 | 0.134 |
| 7 | Core-7-Codell Sandstone | 10.31 | 25.33 | 0.098 |
| Average | 0.057 |
Table 3: Porosity of Niobrara cores.
Test fluids
Oils: Cores were saturated with crude oil from the Bakken Formation in the Williston Basin of North Dakota (Well H. Davidson 2-11H). The API gravity is 43.2° API, reservoir temperature is 248°F (120°C), and formation water salinity is ranged from 150,000 to 300,000 mg/l. Crude oil from the Niobrara Formation has an API gravity of 41.2°API, reservoir temperature is 225°F (107°C), and formation water is salinity 25,418 mg/l.
Surfactants: Surfactant samples selected for imbibition testing and compared at different temperatures are listed in Table 4.
Salts: NaCl, KCl, CaCl2, and MgCl2: These salts were used to change salinity of the aqueous phase based on chemical analysis of formation water.
Base: NaBO2•4H2O: This alkaline compound was used to change the pH of the aqueous phase.
| Sample | Supplier | Type | Molecular structure |
|---|---|---|---|
| SA | Tiorco | Anionic | Internal Olefin Sulfonate |
| ST | Tiorco | Nonionic | Ethoxylated tallow amines |
| SNA | Tiorco | Nonionic | Alcohols, ethoxylated |
| SNB | Nalco Champion | Nonionic | Alcohols, ethoxylated |
Table 4: Surfactant formulations.
Porosity and permeability testing procedures
Two methods were used to saturate the cores. In Method A for Bakken cores in Table 2, a vacuum was applied to the core, and then oil was pumped into the core using the apparatus described in Figure 3 in the range of 0.05 to 0.1 ml/hr of injection rate. Contrast to the Bakken cores, the cores from Niobrara we tested were more fragile. So, Method B for Niobrara cores was used in the Table 3, the core was simply placed into a beaker and oil imbibed spontaneously into the core during a 4-weeks period (Those cores are fragile when packed into a core holder). The Bakken cores were mostly 2-mm cores, and Niobrara cores were 6-12 mm in thickness. The last column of Tables 2 and 3 list porosity values for individual cores. In our experiments, no overburden pressure was applied. Application of significant overburden pressure can decrease porosity and permeability. However, in order to avoid breaking these thin slices, we did not apply an overburden pressure. Our interest at this stage of the investigation is focused on establishing the degree of imbibition that is possible (Tables 4 and 5). All cores used in Tables 2 and 3 were cleaned (extracted with toluene and methanol) before porosity determination. For the permeability test, an ISCO 100 DX pump with low flow rate capability was used. The pump (which has a built-in pressure transducer) provides a wide range of flow rates (from 0.001 to 60 cm3/min) for pressures up to 10,000 psi (690 bars or 70 MPa). The system provides a method to evacuate and saturate the core slices prior to permeability measurement. We first pumped distilled water into the ISCO Model DX-100™ syringe pump using 500 mL/hr flow rate, and then pumped the DI water into a transfer cylinder with the same flow rate. We next pumped the test liquid (crude oil) into the transfer cylinder. (The oil occupied the upper part, while water resided in the lower part of the cylinder. The cylinder capacity was about 250 ml). This step minimized corrosion in the pump. For the brine/surfactant formulation experiments, we added another transfer cylinder (that contained brine) in sequence after the oil transfer cylinder. In this setup, distilled water from the ISCO pump drove oil from the first transfer cylinder to displace brine/ surfactant solutions (in the second transfer cylinder) into the core and core holder. The core holder accommodates cylindrical core slices that are 25-26 mm in diameter and 0-10 mm in thickness, at pressures up to 3,000 psi (207 bars or 20.7 MPa). In Figure 3, flat O-rings were placed upstream and downstream of the core, and the top part of the core holder was screwed into place-squeezing the O-rings onto the core and providing a seal to force the injected fluid to flow through the core. The O-rings have an outside diameter of 25 mm and inside diameter of 16.23 mm. These diameters were used to calculate the effective section area of the core plug when using Darcy’s flow equation to obtain the permeability for fluid flow through rocks. These O-rings were designed and tested to provide an effective seal between the ends of the core and the core holder. In this system (Figure 3), valves A and B are two-way valves to control flow of distilled water to/from the pump. Valve C is a two-way by-pass valve that is used during evacuation and saturation of the core slice. Valves D, E, F are three-way valves that control fluid input/outflow for the transfer cylinder. Once the aqueous liquids were placed, we increased the injection rate until a constant pressure was reached. Otherwise, we maintained a constant rate and observed pressure changes. A constant flow rate was set at 0.005 to 0.105 ml/ hr at the very beginning of injection, depending on the core thickness. We recorded the pressure change in each 30 minutes until pressure stabilized. Then we doubled the injection rate. The time to reach a constant pressure generally required 8 to 10 hours. After the first liquid drop was produced, we observed and recorded the pressure changes and waited for pressure stabilization. In all experiments for porosity and permeability measurement, the temperature was ambient (~23°C). For porosity tests, cores were taken out from the core holder, and weight the mass of wet core. Permeability was determined by Darcy’s law. For spontaneous imbibition, imbibition cells were immersed into a temperature bath. Core plugs were soaked with crude oil and stored for four to eight weeks or utilized pressurization with an ISCO pump in order to achieve to a saturated status, and then placed into glass imbibition cells with precision graduations of 0.1 ml. The cells were filled with a volume of surfactant solution first, and then immersed into a temperature bath at reservoir temperature (107°C and 120°C) for up to 500 hours until no more oil was displaced out. The volume of oil expelled was used to calculate the oil rate and %OOIP oil recovery. For preserved cores, treatment with toluene and methanol was performed after imbibition, and then the cores were soaked with crude oil again after drying in order to obtain the original oil saturation. During the spontaneous imbibition process, cores had top and bottom faces open. No confining pressure was added during the process of spontaneous imbibition. We assume there was no gas phase present in the cores. Before the core samples were processed, only oil existed in the cleaned cores, and both water and oil were present in the preserved cores.
| Sample | Flow rate, cm3/hr | Pressure drop, psi | Permeability to water, µD |
|---|---|---|---|
| Core-1-Chalk | 2.005 | 757 | 5.5 |
| 1.005 | 366 | 5.7 | |
| 0.505 | 193 | 5.4 | |
| Core-2-Chalk | 0.505 | 99 | 14.3 |
| Core-5-Codell Sandstone | 1.005 | 107 | 25.5 |
| Core-6-Codell Sandstone | 0.505 | 99 | 22.9 |
Table 5: Absolute water permeability of Niobrara Formation (μw: 1.13 cP).

Figure 3: Schematic for porosity and permeability measurement (Wang et al. 2011).
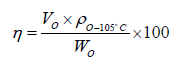
In the above procedure, oil volumes produced were recorded in each 30 minutes in the first 24 hours, then each 4 hours in the remained imbibition time. Eq. 1 provides the method to determine oil recovery factors. Since the core samples were preserved before imbibition, those cores were post- treated with chemicals, dried, and re-saturated with oil.
 (1)
(1)
Where, Wdry=mass of the core sample after cleaning, g; Wo=mass of the core sample after post oil- soaked, g; Vo=produced oil volume, mL; ρo-105°C=oil density at 105°C (reservoir temperature), g/cm3; η=oil recovery factor, %
Results
Porosity behavior
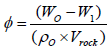
The porosity of the shale cores was determined by weight differences before and after saturation with oil. Weight measurements were made using a Mettler Toledo Model XP504™ analytical balance reading to 0.0001 g. Eq. 2 is used to calculate porosity:
 (2)
(2)
Where, φ is the effective porosity, dimensionless; W1 is the dry weight of the rocks, g; Wo is the weight after oil saturation, g; ρo is the oil density, g/cm3; and Vrock is the volume of the tested rock, cm3. As shown in Tables 2 and 3, the average porosity of Bakken cores is 2.89%, and average porosity of Niobrara cores is 5.7%. Porosities from well logs range from 2-6% in the Bakken formation and from 5-10% for Niobrara chalk (Yang). Examination of our data shows a greater variation than reported in the well logs, but the average values are consistent with the well logs.
Permeability to surfactants
For both the Bakken and Niobrara Formations, exposure to surfactant formulations showed mixed results for increasing permeability compared to values of effective permeability to oil (Tables 6-8). For example, in Niobrara core slice Core-1-(Niobrara Chalk), the effective permeability to surfactant was 3.2 microdarcies (Table 8), similar to the permeability to oil (3.9 microdarcies, (Table 6). Also, for Core 15C from the Bakken, the permeability to surfactant was 0.4 microdarcies (Table 9), similar to the permeability to oil (0.29 microdarcies in Table 7. In contrast, surfactant exposure for Cores 3 (Niobrara Chalk) and 4 (Niobrara Marl) significantly increased permeability (compare Tables 6 and 8). Exposure to surfactant could increase the effective permeability to water by reducing the oil saturation or by wettability alteration [12]. Consistent with earlier results [13-15]. The surfactant solutions did not block oil flow within matrix (i.e., cause formation damage), but instead sometimes promoted oil displacement, even when permeability was not increased (for example, substantial oil was driven out from slice Core-1-Chalk after 6 hours of surfactant flooding). Table 10 shows effective permeability for different aqueous liquids tested on longer Bakken cores at room temperature (39-52 mm length versus 7-13 mm for the cores in Tables 5-9. After cleaning (with toluene and methanol) and saturating with Bakken oil, the cores were imbibed with the various aqueous fluids for an average imbibition time of 100 hours before permeability testing. Based on our previous study of wettability [1,16], the surfactant formulations altered Bakken cores from oil wet to water wet and reduced the resident oil in Bakken cores.
| Sample | Flow rate, cm3/hr | Pressure drop, psi | Permeability to oil, µD |
|---|---|---|---|
| Core-1-Chalk | 1.005 | 1733 | 3.7 |
| 0.105 | 164 | 4.1 | |
| Core-3-Chalk | 0.105 | 706 | 1.0 |
| Core-4-marl | 0.005 | 315 | 0.11 |
| Core-3-Codell Sandstone | 0.105 | 88 | 8.5 |
Table 6: Effective oil permeability of Niobrara Formation (μo: 3.34 cP).
| Sample | Flow rate, cm3/hr | Pressure drop, psi | Permeability to oil, µD |
|---|---|---|---|
| Bakken core | 0.015 | 78 | 0.29 |
Table 7: Effective oil permeability of Bakken Formation (μs: 1.8 cP).
| Sample | Flow rate, cm3/hr | Pressure drop, psi | Permeability to surfactant, µD |
|---|---|---|---|
| Core-1-Chalk, surfactant SNA | 0.105 | 323 | 3.2 |
| Core-3-Chalk, surfactant SNA | 0.105 | 114 | 2.0 |
| Core-4-Marl, surfactant SNA | 0.105 | 39 | 4.1 |
| Core-7-Codell Sandstone, surfactant SA | 0.355 | 86 | 9.5 |
Table 8: Effective surfactant permeability of Niobrara Formation (μs: 1.13 cP).
| Sample, # 16433 | Flow rate, cm3/hr | Pressure drop, psi | Permeability to surfactant, µD |
|---|---|---|---|
| 15C | 0.055 | 134 | 0.4 |
Table 9: Effective surfactant permeability of Bakken Formation (μs: 1.13 cP).
| Core sample # 17451 | Diameter mm | Thickness mm | Saturation fluid | Permeability testing fluid | Permeability µD |
|---|---|---|---|---|---|
| 1-52A | 38.27 | 51.27 | Fresh water | ST | 4.712 |
| 1-74 | 38.06 | 39.88 | Fresh water | Fresh water | 1.609 |
| 1-41A | 38.06 | 49.83 | Brine water | Brine water | 5.189 |
| 1-47A | 38.07 | 50.99 | ST | ST | 4.525 |
| 1-53A | 38.17 | 51.46 | SNA | SNA | 1.949 |
| 1-58A | 38.26 | 50.70 | SNB | SNB | 1.782 |
| 1-76 | 38.03 | 39.75 | SA | SA | 3.056 |
| 1-56A | 38.04 | 50.21 | SA | SA | 5.100 |
Table 10: Effective aqueous liquid (water and surfactant) permeability of Bakken formation.
Spontaneous imbibition
During spontaneous imbibition studies, core plugs were first soaked in crude oil for 4 weeks at room temperature to achieve equilibration [17-20]. This timing was an arbitrary number based on our previous experience. Subsequently, the cores were placed into glass imbibition cells with precision graduations of 0.1 ml. The cells were filled with surfactant solution and then immersed into temperature baths at 107°C to 120°C for up to 500 hours (i.e., the time at which no more oil appeared to come out). The volume of oil expelled was used to calculate the oil rate and %OOIP recovery [21,22]. For preserved cores, treatment with toluene and methanol was performed after imbibition, and then the cores were soaked with crude oil again. During the spontaneous imbibition process, the top and bottom core faces were open. Core dimensions and test conditions for spontaneous imbibition are shown in Table 11. Figure 4 shows oil recovery curves for surfactant imbibition at reservoir temperatures and various salinities using nonionic surfactant SNA for the Bakken and Niobrara Formations [23-25]. Based on laboratory results, we found:
| Core sample | Diameter mm | Thickness mm | Surfactant concentration % | Alkaline content % | Temperature °C | Salinity %TDS |
|---|---|---|---|---|---|---|
| 1-79/Bakken, Middle member | 38.02 | 38.22 | 0.1 | 120 | 4.4 | |
| 1-82/Bakken, Middle member | 38.04 | 38.09 | 0.1 | 0.1 | 120 | 4.4 |
| Core-A/Niobrara/Chalk | 25.46 | 29.41 | 0.2 | 0.1 | 107 | 15 |
| Core-B/Niobrara/Chalk | 25.47 | 30.21 | 0.2 | 0.1 | 107 | 2.5 |
| Core-C/Niobrara/Marl | 25.43 | 26.88 | 0.2 | 0.1 | 107 | 15 |
| Core-D/Niobrara/Marl | 25.49 | 25.06 | 0.2 | 0.1 | 107 | 2.5 |
Table 11: Core sample characteristics for spontaneous imbibition.

Figure 4: Hydrocarbon recovery by spontaneous imbibition.
(1) At higher salinities (15% TDS), higher oil recoveries were obtained in Niobrara Chalk and Marl rocks, compared to lower salinity surfactant formulations (at 107°C and 0.2% surfactant concentrations). The optimum salinity of surfactant SNA was 4% TDS for the Bakken Formation and 15% TDS for the Niobrara Formation (Wang et al.). At optimum salinity with surfactant formulation SNA, high oil recoveries were noted from surfactant imbibition in both Bakken and Niobrara cores. Note that oil recovery values (at optimum salinity) were greater in the Niobrara cores than in the Bakken cores. This result probably occurred because the surfactant concentration was higher for the Niobrara tests (0.2%) than for the Bakken tests (0.1%). Future work will examine this point. For the selected surfactants and Niobrara cores, the oil recovery factors ranged from 13% to 80% OOIP, depending on the salinity and condition of the core. For cores from the Middle Member of Bakken, the average oil recovery by spontaneous imbibition of the selected surfactants was 57% OOIP at optimal salinity. Clay swelling observed from two Niobrara cores (Core-B and Core-4) when the surfactant salinity was low (2.5% TDS) led low oil recovered (13- 16%), (Figure 4) compared to the effectiveness through 15% TDS of surfactant.
Salinity imbibition [26,27]. Figure 5 re-plots data from Figure 4 and shows surfactant intake rate (expressed in cm3 volume imbibed per cm3 of rock area per day) versus time. As expected, the surfactant imbibition rate decreased with time for both Bakken and Niobrara cores, and the behavior was reasonably similar for the two types of cores tested: preserved Niobrara cores, and unpreserved Bakken cores. We note the anomalies in the early parts of the two blue curves (Core- 1/Chalk and Core-3/Marl). More future work will be investigated whether these anomalies are significant [28].

Figure 5: Surfactant imbibition rate (in cm3/cm2/d or cm/d) versus time.
Conclusions
As part of our effort to assess the potential for imbibition to recovery oil from shale/chalk/marl/siltstone, we studied the porosity, permeability to oil, permeability to waters (brine and surfactants), and spontaneous surfactant intake for Bakken and Niobrara rocks. Our findings include:
1. Porosities for Niobrara cores were generally higher (5 to 10%) than those from Bakken cores (2 to 6%). One Cordell sandstone core from the Niobrara formation had a porosity of 13.4%.
2. Consistent with the Darcy equation, rate-independent water and oil permeability was noted.
3. Cores from the Niobrara and Bakken formations exhibited a broad range of permeability, ranging from 0.11 to 26 μD. In the Niobrara formation, permeability was least in marl (0.1-4 μD), larger in chalk (1-15 μD), and greatest in sandstone (8-26 μD).
4. Although variations occurred, the absolute permeability to water, effective permeability to oil, and effective permeability to aqueous surfactant formulations were all comparable.
5. The surfactant formulations tested exhibited a favorable potential for improving recovery in both the Bakken and Niobrara formations by spontaneous imbibition. In Niobrara cores, the oil recovery factors ranged from 13% to 80% OOIP, depending on the salinity and condition of the core. For cores from the Middle Member of Bakken, the average oil recovery by spontaneous imbibition of the selected surfactants was 57% OOIP at optimal salinity.
Acknowledgement
We appreciate the oil industries and surfactant suppliers for providing core samples and surfactant samples.
References
- Wang DM, Butler R, Ahmed S (2012) Wettability Survey in Bakken Shale Using Surfactant Imbibition SPE Reservoir Evaluation & Engineering 15: 695-705.
- Reisz MR (1992) Reservoir Evaluation of Horizontal Bakken Well Performance on the Southwest Flank of the Williston Basin. Paper SPE 22389 presented at the SPE International Meeting on Petroleum Engineering Beijing, China.
- Breit VS, Stright DH, Dozzo JA (1992) Reservoir Characterization of the Bakken Shale from Modeling of Horizontal Well Production Interference. Data Presented at the SPE Rocky Mountain Regional Meeting Casper Wyoming, Vol-18-21.
- Stuart AC, David MC, Ken D (2008) Unconventional Resource Play Evaluation: A Look at the Bakken Shale Play of North Dakota. Paper SPE 114171 presented at the SPE Unconventional Reservoirs, Conference held in Keystone Colorado.
- LeFever J, Helms L (2010) Bakken Formation Reserves Estimates, Report prepared by the North Dakota. Department of Mineral Resources Bismarck North Dakota.
- Gosnold WD (1990) Heat Flow in the Great Plains of the United States” Journal of Geophysical Research 95: 353-374.
- Pitman JK, Price LC, Lefever JA (2001) Diagenesis and Fracture Development in the Bakken Formation Williston Basin: Implications for Reservoir Quality in the Middle Member US Geological Survey.
- LeFever JA, Martiniuk CD, Dancsok EFR (1991) Petroleum Potential of the Middle Member of Bakken Formation” Sixth International Williston Basin Symposium, pp: 74-95.
- Patrick D, James B, Mark R (1980) Oil Base Foam Fracturing applied to the Niobrara Shale Formation. SPE 9335 presented at the 55th SPE Annual Technical Conference and Exhibition Dallas, Texas.
- Eason CR (1985) Single-Stage Multiple-Zone Stimulation: An Effective Method of Stimulating the Niobrara Formation. Paper SPE 13889 presented at the SPE/DOE Low Permeability. Gas Reservoirs Symposium Denver Colorado.
- Yang YH (2008) Using the Formation Breakdown Pressure Measured in Pre-frac Test to Predict Natural Fractural Swarms in Low Permeability Carbonate at the Wattenberg Field in the Denver-Julesburg Basin, Presented at the SPE Annual Technical Conference and Exhibition Denver Colorado.
- Zhang J, Wang DM, Butler R (2013) Optimal Salinity Study to Support Surfactant Imbibition into the Bakken, Shale Presented at the SPE Unconventional Resource Conference – Canada Calgary Alberta.
- Wang DM, Butler R, Ahmed S (2011) Surfactant Formulation Study for Bakken Shale Imbibition Presented, SPE Annual Technical Conference and Exhibition (ATCE) Denver Colorado.
- Cheatham CA, Nahm JJ (1990) Bit Balling in Water-Reactive Shale during Full-Scale Drilling Rate Test Presented at the IDAC/SPE. Drilling Conference Houston Texas.
- Chen YQ, Li Y (2001) Modern Petroleum Reservoir Engineering first edition Chap 2 38-51 Bejing China. University of Petroleum Press.
- Cramer DD (1986) Reservoir Characteristics and Stimulation Techniques in the Bakken Formation and Adjacent Beds Billings. Nose Area Williston Basin Presented at the SPE Rocky Regional Meeting Billings.
- Luffel DL, Hopkins CW, Holditch SA (1993) Matrix Permeability Measurement of Gas Productive Shales. Presented at the SPE Annual Technical Conference and Exhibition Houston.
- Luo YT, Davidson B, Dusseault M (1996) Measurements In Ultra-low Permeability Media With Time-varying Properties. ISRM International Symposium – EUROCK 96 Turin Italy.
- Matthews CS, Russell DG (1967) Pressure Build-up and Flow Tests in Wells Monograph 1 Society of Petroleum Engineers.
- Murphy EC, Nordeng SH, Bruce J (2009) North Dakota Stratigraphic Column North Dakota Geological Survey.
- Neuzil CE (1993) Low Fluid Pressure within the Pierre Shale: A Transient Response to Erosion Water Resources Res 29: 2007-2020.
- Phillips ZD, Halverson RJ, Stranss SR (2007) A Case Study in the Bakken Formation: Changes to Hydraulic Fracture Stimulation Treatment Result in Improved Oil Production and Reduced treatment Costs. Paper SPE 108045 presented at the SPE Rocky Mountain Oil & Gas Tech Symposium Denver Colorado.
- Pollastro RM (1992) Relation of natural fractures to composition and cyclicity in chalk of the Niobrara Formation Berthoud Field Colordao:USGS Circular Report, pp: 59-60.
- Reyes L, Osisanya SO (2002) Empirical Correlation of Effective Stress Dependent Shale Rock Properties JCPT 41: 47-53.
- Sanyal SK, Pirnie III RM, Chen GO, Marsden SS (1972) A Novel Liquid Permeameter for Measuring Very Low Permeability. SPE Journal 12: 206-210.
- Sonnenberg SA (2012) The Niobrara Petroleum System Rocky Mountain Region Adapted from presentation at Tulsa, Geological Society dinner meeting Tulsa Oklahoma.
- Tang GQ, Firoozabadi A (2002) Relative Permeability Modification in Gas/Liquid Systems through Wettability Alteration to Intermediate Gas Wetting. SPE Reservoir Evaluation & Engineering 5: 427-426.
- Wang DM, Butler R, Liu H, Ahmed S (2011a) Flow Rate Behaviour and Imbibition in Shale SPE Reservoir. Engineering & Evaluation 14: 505-512.
Relevant Topics
Recommended Journals
- Oil & Gas Research Journal
- Renewable Energy and Applications Journal
- Oceanography Journal
- Industrial Pollution Control Journal
- Coastal Zone Management Journal
- Climatology & Weather Forecasting Journal
- Geoinformatics & Geostatistics Journal
- Engineering and Technology Journal
- Petroleum & Environmental Biotechnology Journal
- Polymer Sciences Journal
Article Tools
Article Usage
- Total views: 3923
- [From(publication date):
August-2017 - Mar 31, 2025] - Breakdown by view type
- HTML page views : 3024
- PDF downloads : 899