Research Article Open Access
Fluctuations of the Global Atmospheric Circulation in the XX-XXI Centuries
Nina K Kononova*
Institute of Geography, Russian Academy of Sciences, Moscow
- *Corresponding Author:
- Kononova NK
Research Engineer, Institute of Geography
Russian Academy of Sciences, Moscow
Tel no: (499)746-3605
E-mail: NinaKononova@yandex.ru
Received May 02, 2016; Accepted May 19, 2016; Published May 22, 2016
Citation: Kononova NK (2016) Fluctuations of the Global Atmospheric Circulation in the XX-XXI Centuries. J Earth Sci Clim Change. 7:350. doi:10.4172/2157-7617.1000350
Copyright: © 2016 Kononova NKl. This is an open-access article distributed under the terms of the Creative Commons Attribution License, which permits unrestricted use, distribution, and reproduction in any medium, provided the original author and source are credited.
Visit for more related articles at Journal of Earth Science & Climatic Change
Abstract
Fluctuations in the global atmospheric circulation in 1899-2014, in the classification by BL Dzerdzeevskii considered. Three circulation epochs are identified. Frequency elementary circulation mechanisms (ECM) in each period analyzed. ECM, the total duration of which an average of more than six months era, marked. The start date of circulation seasons in the northern and southern hemispheres and their duration for each year are determined. Long-term fluctuations in mean annual air temperature in the Northern and Southern hemispheres and the global and the annual amplitude of air temperature due to changes in the nature of atmospheric circulation are analyzed. Particular attention is paid to the modern period (1998-2014). During this period, in the lower troposphere maximum meridional transport of air masses is observed (on average 335 days per year). In 93 days on average per year macro processes cyclones at the poles, without blocking processes, with three or four cyclones outputs of low to high latitudes in each hemisphere observed (type 13). On other days macro processes with anticyclones at the poles, the outputs of the cyclone low to high latitudes in two-four quadrants of each hemisphere and the Arctic-Antarctic invasions in their rear, forming a blocking process (types 8 to 12) are marked. As a result, the average annual air temperature in the Northern Hemisphere has ceased to rise, and in the Southern Hemisphere air temperature dropped slightly. Due to the growth of the length of the high pressure in winter and summer annual amplitude of air temperature was the highest for the entire observation period. Simultaneous outputs cyclones from low to high latitudes in different sectors hemispheres ‘odnovpemennoe’ cause the occurrence of natural hazards associated with heavy rainfall in different regions of the Earth.
Keywords
Atmosphere; Hemispheres; Global atmospheric circulation
Introduction
For the analysis of global atmospheric processes currently used by various indices, BL Dzerdzeevsky showed that classification atmospheric circulation extra tropical latitudes of the Northern Hemisphere [1,2] can be extended to the extra tropical latitudes of the Southern Hemisphere. The development of this thesis, in this paper we present the global atmospheric circulation fluctuations for the 1899-2014 biennium’s and the response to these fluctuations in global temperature. It is also shown that the modern nature of the atmospheric circulation is most conducive to the development of dangerous natural processes.
Data and Analysis
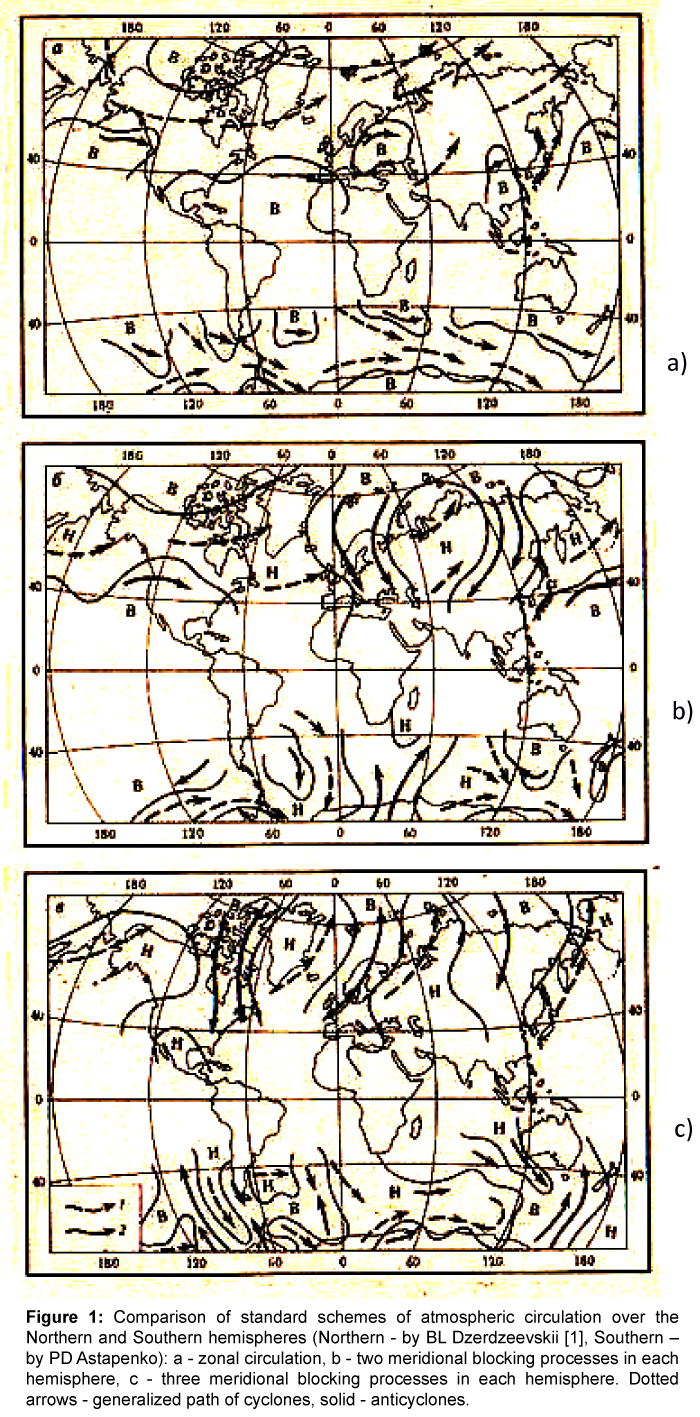
In 1967 BL Dzerdzeevskii [2] revealed the conjugation of atmospheric circulation extra tropical latitudes of the Northern and Southern hemispheres. At the zonal circulation, without blocking processes in the Northern Hemisphere, the circulation of a similar nature is marked in the Southern Hemisphere. With the development of the meridional circulation with the blocking processes the same number of them in the Northern and Southern Hemispheres are marked, and the axis of Arctic/Antarctic intrusions are on the same longitude (Figure 1).
Figure 1: Comparison of standard schemes of atmospheric circulation over the Northern and Southern hemispheres (Northern - by BL Dzerdzeevskii [1], Southern – by PD Astapenko): a - zonal circulation, b - two meridional blocking processes in each hemisphere, c - three meridional blocking processes in each hemisphere. Dotted arrows - generalized path of cyclones, solid - anticyclones.
Later to build dynamic schemes ECM Southern Hemisphere Southern Hemisphere synoptic maps were used. On this basis, it was built prefabricated kinematic maps paths of cyclones and anticyclones. These cards provide the basis for dynamic schemes ECM Southern Hemisphere. Dynamic schemes ECM Northern Hemisphere were taken from BL Dzerdzeevskii [3]. Comparison of dynamic schemes ECM Northern and Southern Hemispheres in the number of blocking processes and output cyclones from low to high latitudes was carried out. Further, according to the site of the University of East Anglia [4] analysis of the relationship of surface air temperature fluctuations with the fluctuations of atmospheric circulation [5] was held.
Results
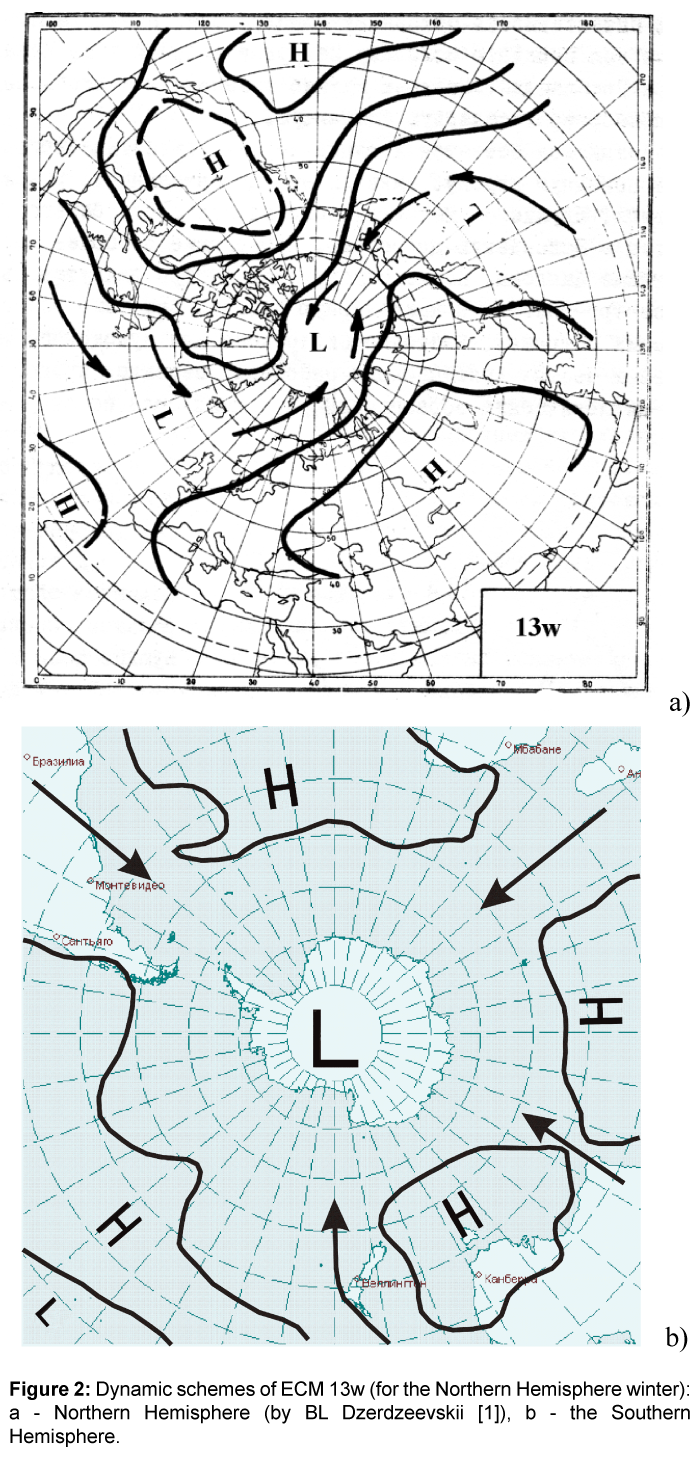
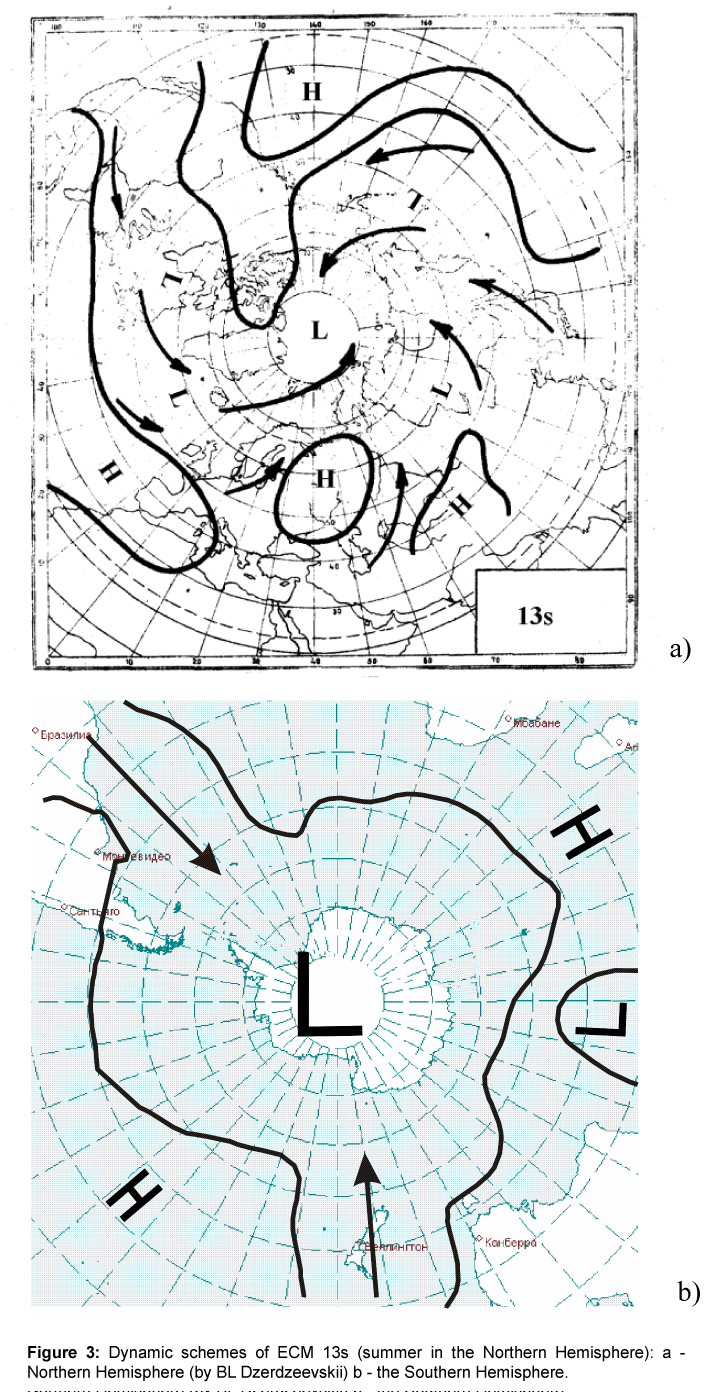
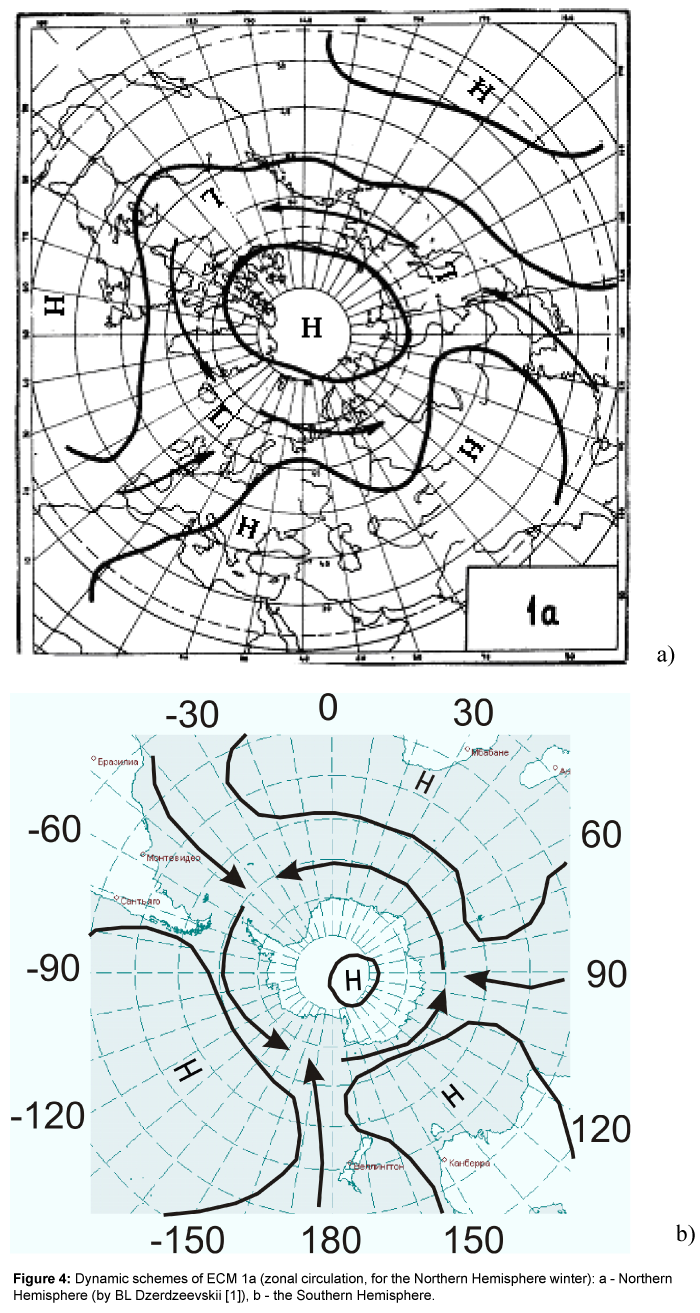
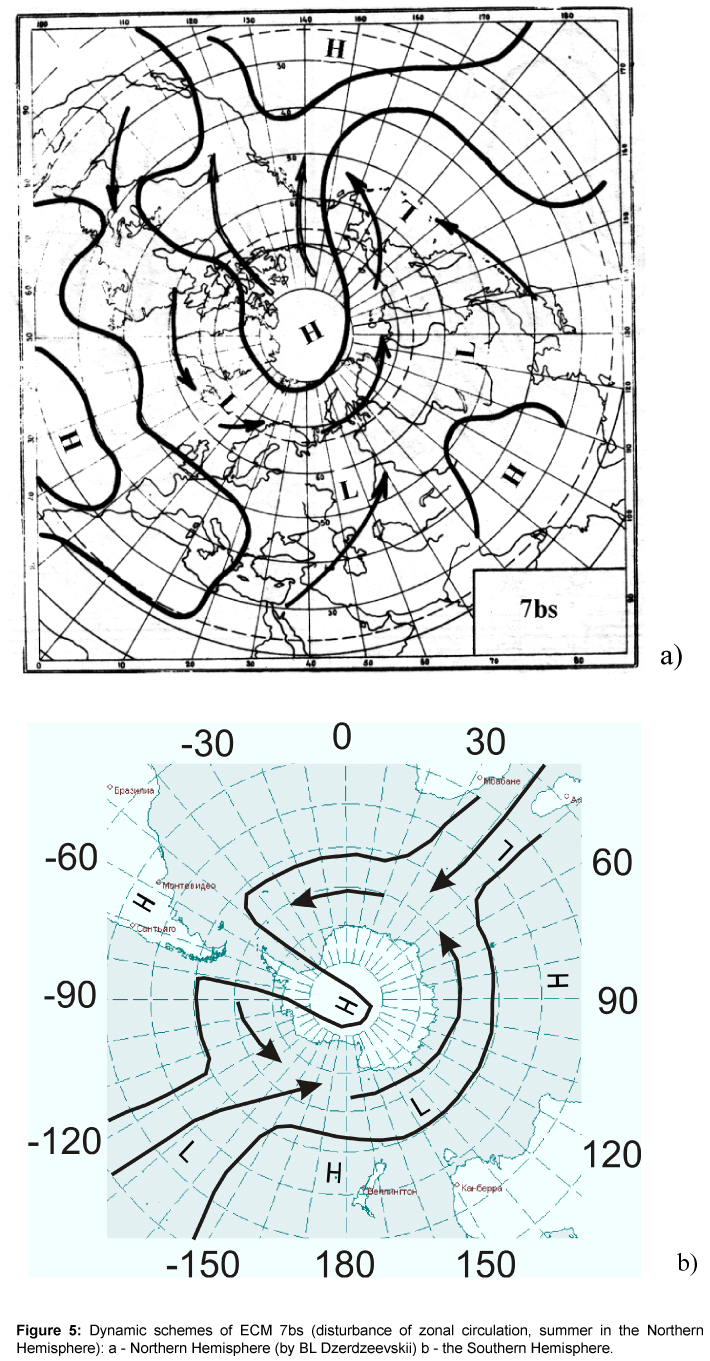
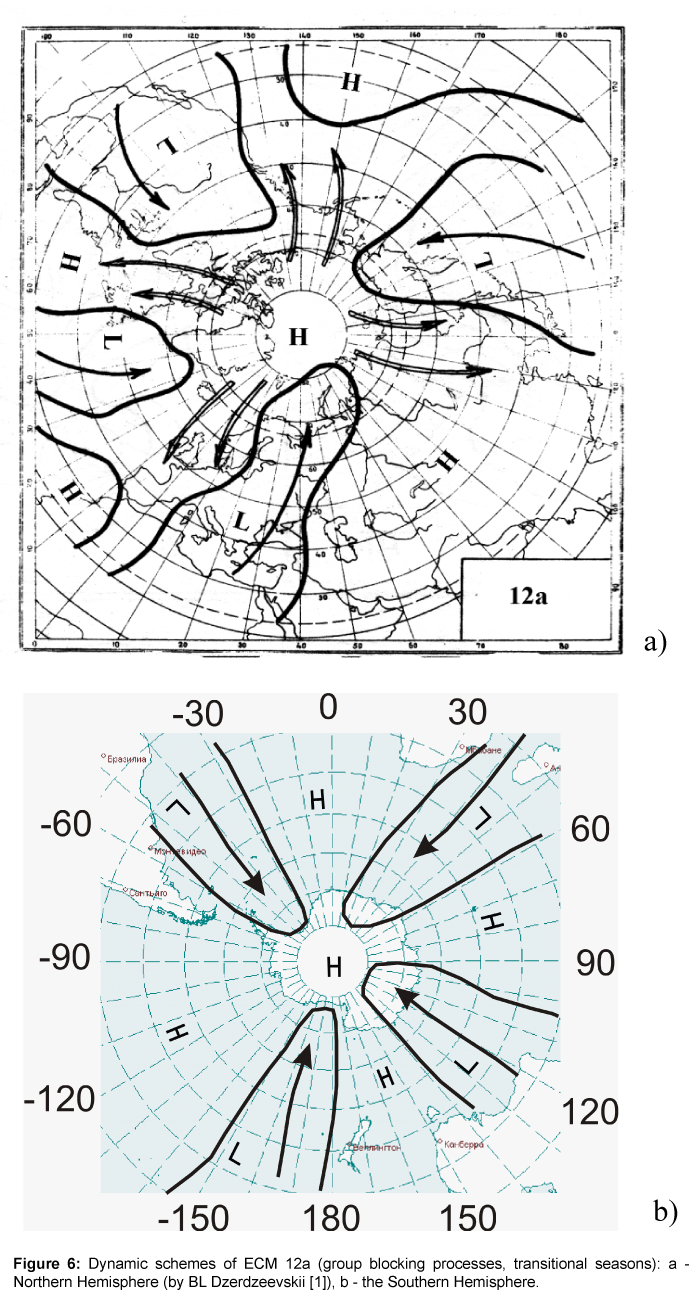
On ready-kinematic maps constructed for the 1998-2005 biennium. [6,7] identified differences in the manifestation of elementary circulation mechanisms (ECM) of the circulation of the poles with cyclones and cyclone exit from low to high latitudes in different hemispheres, and also presented their dynamic schemes (Figures 2 and 3). It was also revealed that for all macroprocesses in the summer hemisphere more outlets of cyclones from low to high latitudes than in winter (Figures 4 and 5). When ECM transitional season, the situation is the same in different hemispheres (Figure 6).
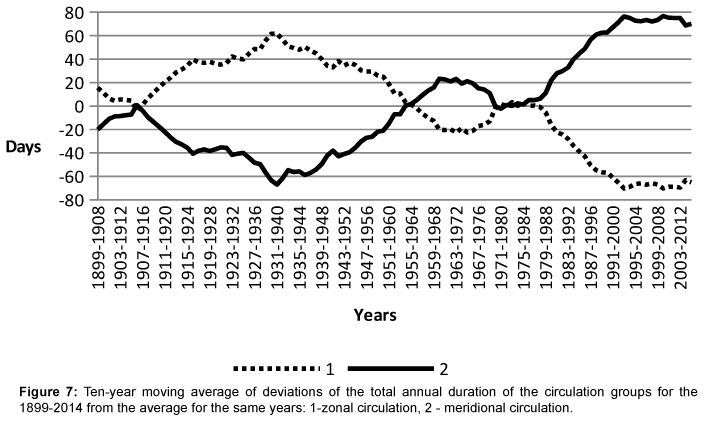
Changing the ECM takes place simultaneously in the two hemispheres, so the total annual duration of each ECM is also the same in the two hemispheres. Consequently, fluctuations in the atmospheric circulation in the extra tropical latitudes of the whole Earth were identical. We consider the fluctuations of the global atmospheric circulation in 1899-2014, in the classification by BL Dzerdzeevskii. Variance analysis of the total annual duration zonal (zonal + disturbance of zonal) and meridional (Arctic/Antarctic invasion + output cyclones from low to high latitudes) macro processes from their average values (Figure 7) showed an increase from the 30-ies of XX century duration interlatitudinal exchange air masses, and for the XXI century, it is maximum for the entire observation period.
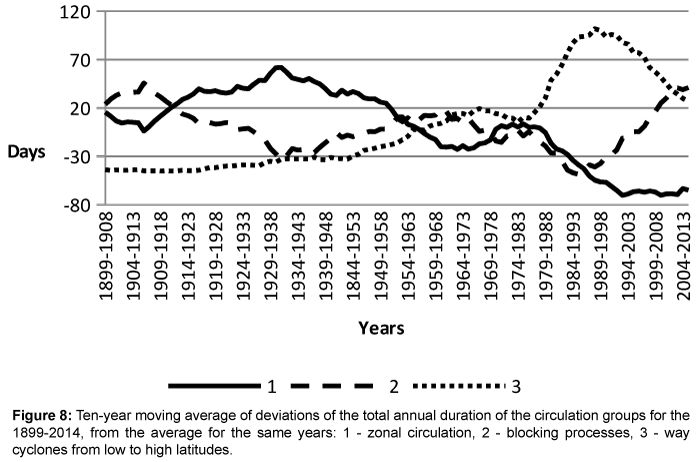
Separate analysis of deviations from the average total annual duration of the formation of blocking processes, connecting the Arctic/ Antarctic High with the subtropical and output cyclones from low to high latitudes revealed three circulation period (Figure 8), which differ in the prevalence of positive deviations of the total annual duration of any single group of the average circulation for the entire observation period.
In the first epoch (1899-1915) duration of blocking processes was higher than the average; in the second epoch (1916-1956) zonal circulation was higher; in the third epoch (1957 - present) - outputs of cyclones from low to high latitudes. The third epoch is divided into periods. With the overall predominance of positive deviations of duration of the cyclones output from low to high latitudes in 1957-1969 the duration of the blocking process is increased (Figure 8). In 1970- 1980 the duration of the zonal circulation rises to the level of average. In 1981-1997 there is a rapid increase in the total annual duration of the cyclones output from low to high latitudes. From 1998 to the present time there is a new duration surge of blocking processes. It is significant that at this period there are the most significant meteorologically due natural hazards for the entire period of meteorological observation (floods, ice disasters and so on) [7-11].
Total annual duration of the ECM in each epoch was analyzed. Allocated ECM which total duration in average for the epoch exceeds 183 days (Figure 9).
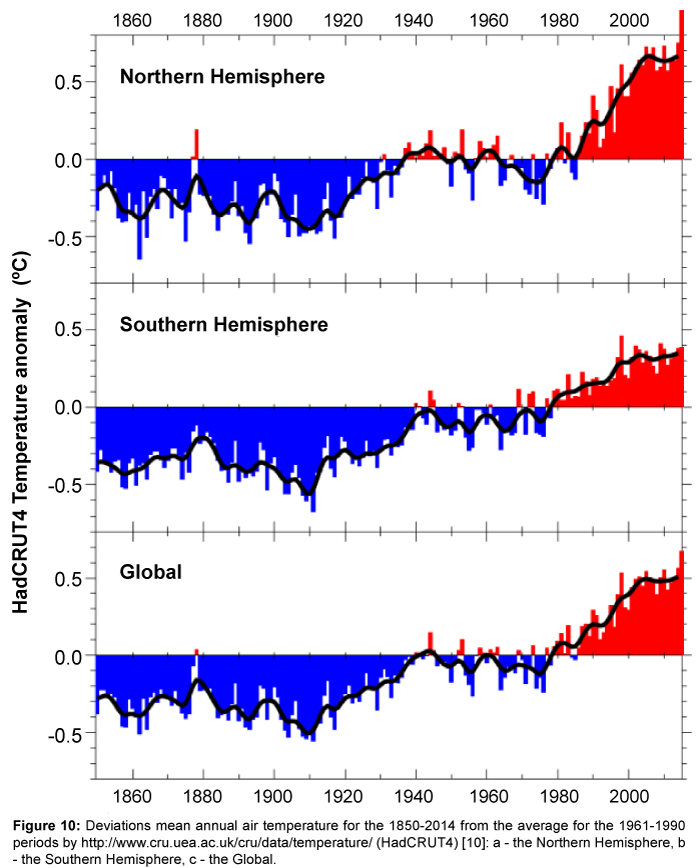
Changing of the circulation processes duration affected the global annual mean air temperature (Figure 10). It decreases with increasing duration of the blocking process (at the end of XIXth - early XXth centuries, and in 1960) and increased during the periods of duration growth of zonal circulation (1920-1930) and cyclones output from low to high latitudes (last quarter of the XXth century).
Figure 10: Deviations mean annual air temperature for the 1850-2014 from the average for the 1961-1990 periods by http://www.cru.uea.ac.uk/cru/data/temperature/ (HadCRUT4) [10]: a - the Northern Hemi sphere, c - the Global.
Last period (1998-2014) deserves special attention. During this period in the lower troposphere meridional transport of air masses reached its maximum level (on average 335 days per year). Macro process with four outputs of cyclones from low to high latitudes in each hemisphere and four Arctic/Antarctic invasions into their rear, which form blocking processes (ECM 12a, Figure 6) lasts on average 54 days per year (Fig.9g). Macro processes with cyclones at the poles without blocking processes, with three cyclones outputs from low to high latitudes in the winter hemisphere and four outputs in the summer hemisphere (ECM 13w and 13s, Figures 2 and 3) lasts on average 93 days per year. A distinctive feature of the last period is the formation of stable anticyclones over the continents in winter and in summer. This in turn leads to a positive temperature extremes in summer time and negative temperature extremes in winter time. The rapid growth of the average annual air temperature is terminated (Figure 10); although 2014 proved to be the warmest for the entire observation period (global temperature anomaly is 0.564°C).
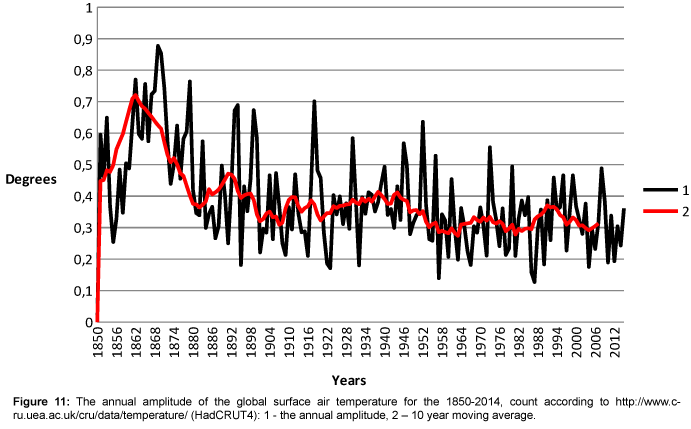
Fluctuations in atmospheric circulation affected the annual amplitude of air temperature, which is calculated as the difference between the daily maximum and minimum in a given year. In the absence of daily data, I calculated the annual amplitude of the difference between the average monthly temperature anomalies of the warmest and the coldest month of the year (Figure 11).
Figure 11: The annual amplitude of the global surface air temperature for the1850-2014, count according to http://www.cru.uea.ac.uk/cru/data/temperature/ (HadCRUT4): 1 - the annual amplitude, 2 – 10 year moving average.
The highest annual temperature amplitude observed in the second half of the XIX century, the maximum (0.877°C) - in 1868. Since then, there has been downward trend amplitude. For the 1899-2014 the maximum amplitude (0.701°C) was observed in 1917 on the border ages blocking and zonal processes. In the first epoch amplitude ranged from 0.21°C to 0.584°C at average 0.34°C; in the second epoch - from 0.139°C to 0.701°C with an average 0.377°C; In the third epoch - from 0.127°C to 0.555°C with an average 0.312°C. In the period of 1957-1969 Global annual amplitude of air temperature ranged from 0.181°C to 0.454°C with an average 0.277°C; during the 1970-1980 from 0.21°C to 0.555°C with an average 0.321°C; during the 1981-1997 from 0.127°C to 0.466°C at an average 0.32°C; during the 1998-2014 - from 0.175°C to 0.488°C with an average 0.311°C.
Thus, during the years 1899-2014, annual amplitude of global air temperature was highest in the zonal epoch when interlatitudinal exchange of air masses was the smallest, and anticyclones stand for long periods over the continents, providing excessive heating of the air in the summer and cooling of the winter. The least it was at the beginning of the Third epoch (1957-1969) when grown duration and output cyclones from low to high latitudes and the Arctic/Antarctic invasions. In the last period after the minimum in 1986, when there was a maximum output cyclones from low to high latitudes, the annual air temperature amplitude increases again. This is unfavorable for all sectors of the economy.
Conclusion
Create dynamic diagrams ECM Southern Hemisphere allows us to analyze the global circulation of the atmosphere. In the development of the global atmospheric circulation in the 1899-2014 marked three circulation epochs: blocking processes, zonal and outputs cyclones from low to high latitudes differing prevalence of certain macroprocesses. Fluctuations in global average surface air temperature correspond to fluctuations of the global atmospheric circulation. Annual amplitude of the global surface air temperature was the highest in the zonal epoch between the smallest interlatitudinal exchange of air masses and the greatest duration of the development anticyclones over the continents. The last decades have seen its growth.
The modern character of the atmospheric circulation caused the increases frequency meteorologically due by natural hazards in different regions of the Earth, including the occurrence of simultaneous disasters ice in the Arctic and Antarctic.
References
- Dzerdzeevsky BL (1962) Fluctuations of climate and general circulation of the atmosphere in extra-tropical latitudes of the Northern Hemisphere and some problems of dynamic climatology. Tellus 14: 328-336.
- Dzerdzeevsky BL (1967) Comparison of the most important laws of atmospheric circulation over the Northern and Southern Hemispheres. Soviet Antarctic Expedition. 65: 58-68.
- Dzerdzeevskii BL (1968) Circulation mechanisms in the atmosphere of the Northern Hemisphere in the twentieth century. Institute of Geography, Moscow, 240 p.
- Climatic Research Unit: Data http://www.cru.uea.ac.uk/cru/data/temperature/
- Fluctuation of the atmospheric circulation www.atmospheric-circulation.ru
- Kononova NK (2014) Influence of atmospheric circulation of the Northern Hemisphere in the formation of natural disasters in the territory of Russia in XXIth century. GeoRisk 3:22-27.
- Kononova NK, Lutsenko OV, Makarova ME, Orlov IA (2007) Circulation of the atmosphere in the Antarctic at the end of the XXth - beginning XXIthcenturies. Materials of glaciological studies 103: 142-147.
- Kononova NK, Makarova ME (2006) The planetary atmospheric circulation and its effect in Antarctica. Scientific conference Russia in the Antarctic, April 12-14, 2006 St. Petersburg, AARI. Program and abstracts. Saint Petersburg, p. 126-127.
- Kotlyakov VM, Asoyan DS, Kononova NK, Osokin NI, Rototaeva OV (2008) Features catastrophic natural processes in the North Caucasus at the turn of the XXth–XXIthcenturies. Change of the environment and climate: natural and related to its technological disasters (8thedn) Chairman of the Ed. Board -Laverov NP, Russian Academy of Sciences p. 190-209.
- Mavlyudov BR, Kononova NK, Zakharov VG (2015) Synchronicity of the dynamics of ice processes in the Arctic and Antarctic in April 2012. International Conference Arctic marine wildlife management in the XXI century - a modern balance of scientific traditions and innovations. Collection of conference materials. Apatity 142-144.
- Malneva IV, Kononova NK, Krestin BM (2014) Mudslides activity in the Kuril Islands in the period of modern climate changes. GeoRisk 28-33.
Relevant Topics
- Atmosphere
- Atmospheric Chemistry
- Atmospheric inversions
- Biosphere
- Chemical Oceanography
- Climate Modeling
- Crystallography
- Disaster Science
- Earth Science
- Ecology
- Environmental Degradation
- Gemology
- Geochemistry
- Geochronology
- Geomicrobiology
- Geomorphology
- Geosciences
- Geostatistics
- Glaciology
- Microplastic Pollution
- Mineralogy
- Soil Erosion and Land Degradation
Recommended Journals
Article Tools
Article Usage
- Total views: 11327
- [From(publication date):
May-2016 - Jul 19, 2025] - Breakdown by view type
- HTML page views : 10375
- PDF downloads : 952

