Research Article Open Access
Fish Stock Estimation by Using the Hydroacoustic Survey Method in Sikka Regency Waters, Indonesia
Pujiyati S1, Hestirianoto T1, Wulandari PD1 and Lubis MZ2*1Department of Marine Science and Technology, Faculty of Fisheries and Marine Sciences Bogor Agricultural University Jln, Indonesia.
2Department of Marine Science and Technology, Bogor Agricultural UniversityJln, Indonesia.
- *Corresponding Author:
- Lubis MZ
Marine Acoustic Laboratory Assistant
Department of Marine Science and Technology
Bogor Agricultural UniversityJln. Agatis
Kampus IPB Dramaga Bogor 16680, Indonesia
Tel: +62 251 8622642
E-mail: lubiszainuddin@gmail.com
Received Date: April 27, 2016; Accepted Date: June 22, 2016; Published Date: July 10, 2016
Citation: Pujiyati S, Hestirianoto T, Wulandari PD, Lubis MZ (2016) Fish Stock Estimation by Using the Hydroacoustic Survey Method in Sikka Regency Waters, Indonesia. J Fisheries Livest Prod 4:193. doi: 10.4172/2332-2608.1000193
Copyright: © 2016 Pujiyati S, et al. This is an open-access article distributed under the terms of the Creative Commons Attribution License, which permits unrestricted use, distribution, and reproduction in any medium, provided the original author and source are credited.
Visit for more related articles at Journal of Fisheries & Livestock Production
Abstract
Sikka regency waters including fishery management with a high utilization status so that the necessary stages of an intensive monitoring and research potential of fish resources. This study aimed to obtain the estimated value of stock biomass and density of fish resources with the acoustic method. Quantitative data obtained will be a source of current information on the state of fish resources in the Sikka regency waters, Indonesia. The research was conducted in May 2015. Acoustic data retrieval, using instruments CruzPro fish finder PcFF-80 with sound velocity of 1516 m/s, power 2560 Watt, and method in survey acoustic use hydroacoustic long transect. Horizontal distribution shows fluctuations striking at research location has the highest salinity levels in the range of 29.3-29.8 psu. Total biomass of fish in this study showed more the number is at a depth of 11-20 m that is 2,008 tons/Km and at a depth of 1-10 m have the total fish biomass is 12.33 tons/Km, single detection is done using a single target hidroacoustic show more dominance at a depth of 11-20 m in Sikka regency waters, MTB, Indonesia in May 2015. Number of data from results obtained by looking at the relationship between the number of the data with the total biomass in keadalam 1-10 m has equation Y=0.0967 x+0.0486 with R2 is 0.0464 (4%), while at a depth of 11-20 m has a regression equation is Y=0.0003 x+0041 with the R2 is 0.0091 (0.9%). Variations in the data or the detection of single targets have variations over the data that is at a depth of 11-20 m with regression low percentage is 0.9%.
Keywords
Hydroacoustic; Salinity; Biomass; Estimation stock; Sikka regency waters
Introduction
Quantitative estimation on the size of fish populations is needed in the development and management of fish resources. Utilization of resources fish resources can be optimally when stocks and distribution of fish resources known for certain that the policy measures of exploitation can be done properly without endangering its sustainability. Sikka regency waters has significance for the business activities of fisheries which exploit small pelagic fish resources. Ala talat fishing is the widely used gill nets and longlines. Sikka regency waters, good information about the fishery such as the availability of resources, distribution and types of fish and oseanografinya parameter has not been widely studied.
In science of acoustic there is passive and active acoustic method. In passive acoustic method usually with namely is bioacoustic, and this mehod described in researching [1,2]. In active acoustic with hydroacoustic method are increasingly being used in all kinds of aquatic ecosystems in order to acquire detailed information about aquatic life, and stock estimation about fish [3]. Quantifying sea bottom surface backscattering strength with echosounder and identifying bottom fish by using the hydroacoustic method most recently in the years 2003- 2015 is [4,5], while research about acoustic backscatter quantification of seabed in refs. [6-8]. The hydroacoustic method too use in estimation of zooplankton [9].
The aim of this study hydroacoustic survey was estimation for the total biomass of fish in sikka regency waters, and using sampling patterns: long transects (Figure 1), and using calculation methods of biomass [10,11]. the results of the analysis in this study are presented in map form density distribution for each stratum depth.

Figure 1: Sampling points and ��?long� transect in hydroacousticsuvey method.
Materials and Method
The research was conducted May 2015 in Sikka regency waters, MTB, Indonesia. Collecting data in this research using the local fishing boats. Acoustic data retrieval is done using instruments CruzPro fish finder PcFF-80 with sound velocity of 1516 m/s and power 2560 Watt (Figure 2). Acoustic data acquisition done in the afternoon until the evening in six days during a period fishing boad at speeds ranging between 6-7 knots. Trails include a data acquisition area of an area that allows the analysis of spatially created with the form of long transect according to [3] with the length of each transect approximately 12 km from the boundary islands outwards. Overview of the research sites in Sikka regerncy waters and acoustic tracking can be seen in (Figure 3).

Figure 2: Hydroacoustic Instruments CruzPro fish finder PcFF-80 with a) Pc/Computer, b) Interface, c) Hand GPS, d) Transducer (Single beam echosuonder) personal documentation.
Figure 3: Research location and acoustic tracking.
Data processing and analysis
Acoustic data were processed using Sonar software ver.4 and Matlab R2008b. Analysis to estimate fish is done starting from a depth of 1-10 m, with units of fish biomass yield is (tail/1000m3). In this study using a formula acuostic namely Target strength (TS) bore the ability of the target to reflect a sound about it. Based domain is used, the target strength is defined into two, namely in the form of Intensity Target Strength (TSi) and Energy Target Strength (TSE). Targeth logaritmic strength can be defined as the quotient between the value of the intensity of the noise coming about the target and multiplied by the number of ten (10) [12].
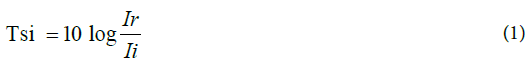
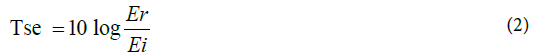
Description:
Tsi: Intensity of target strength
Ii: Intensity of sound on targets
Ir: intensity of the reflected sound energy targets
Tse: Target Strength
Ei: Energy sound on targets
Er: Energy reflection sound at a distance of 1 meter from the target
In addition [11] has a long and weighs equation to convert length into weight alleged allegations are as follows:
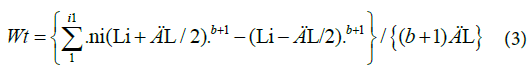
Description:
Wt=total weight (g)
Al=class interval length (cm)
Li=the midpoint of the long-th grade (cm)
Ni=number of individuals in the i-th grade
a, b=constants for certain species
Result and Discussion
Values obtained estimation of fish stocks is the amount of biomass of the fishery resources to the extent of the observed area. The estimation of the stock acquisition value has not reflected the condition of the actual fish resources, because according to the nature of life there are fish in groups (schoals) and alone (solitary). Single target echogram in depth 1-10 m, can be seen in Figure 4.
Analysis of the spatial distribution is useful to know the pattern of aggregation of fish resources in the waters observed so that can know the condition of the existence of fish resources actually closer in nature. Vertical distribution of salinity in Sikka regency waters can be seen in Figure 5, and the spatial distribution of resources fish. Acoustic detection results at the time of the survey showed that in Figures 6 and 7.

Figure 4: Single target echogram in depth 1-10 m.

Figure 5: Vertical distribution of salinity in Sikka regency waters.

Figure 6: 3D Spatial distribution of fish at depth of 1-10 meters.

Figure 7: 3D Spatial distribution of fish at depth of 11-20 m.
At a depth of 1-10 have the results of the spatial distribution of fish distribution (6) Very little it is expected due to dilution by the relatively higher rainfall in May. In Figure 5, it shows the vertical distribution of salinity, horizontal distribution shows fluctuations striking at research location has the highest salinity levels in the range of 29.3-29.8 psu. In 3 D Spatial distribution of fish at depth of 1-10 meters (Figure 6) show more fish biomass values were in the range of 0 to 50 (tail/1000 m3), whereas the biomass was highest, namely 3101 to 7177 (tail/1000 m3). This clearly provides that the distribution of information or estimate the fish at depths of 1-10 m in sicca has very little biomass (Tables 1 and 2).
| A | Latitude | Biomass (Tons/Km) |
|---|---|---|
| 122.21957 | -8.51704 | 3.82266 |
| 122.22368 | -8.51561 | 0.02488 |
| 122.29318 | -8.53414 | 0.02487 |
| 122.40081 | -8.59689 | 0.03478 |
| 122.39901 | -8.5009 | 0.00146 |
| 122.39796 | -8.50294 | 0.10224 |
| 122.39796 | -8.50295 | 0.18051 |
| 122.3966 | -8.50494 | 0.16814 |
| 122.3928 | -8.51017 | 0.04713 |
| 122.39069 | -8.53182 | 0.00373 |
| 122.39319 | -8.54317 | 0.00501 |
| 122.39593 | -8.55063 | 0.00936 |
| 122.49183 | -8.36976 | 0.09491 |
| 122.50689 | -8.35369 | 0.63692 |
| 122.39939 | -8.49581 | 7.17615 |
| Total biomass of fish | 12,33,275 | |
Table 1: Biomass estimation of fish (Ton) in depth 1-10 m.
| Longitude | Latitude | Biomass (Ton) | Longitude | Latitude | Biomass (Tons/ Km) |
|---|---|---|---|---|---|
| -8.68669 | 122.5065 | 0.004703047 | -8.58455 | 122.47989 | 0.0089812 |
| -8.67783 | 122.5356 | 0.007950297 | -8.58325 | 122.47823 | 0.0021885 |
| -8.66572 | 122.5104 | 0.003881807 | -8.58001 | 122.2853 | 0.0048741 |
| -8.66478 | 122.5154 | 0.044239808 | -8.5785 | 122.4839 | 0.0686429 |
| -8.66274 | 122.5125 | 0.29413167 | -8.56349 | 122.40122 | 0.0006445 |
| -8.65238 | 122.5554 | 0.007264844 | -8.49462 | 122.50921 | 0.0980554 |
| -8.651974 | 122.5687 | 0.015669971 | -8.5544 | 122.28167 | 0.0010076 |
| -8.651424 | 122.5786 | 0.005101958 | -8.57246 | 122.39305 | 0.0043289 |
| -8.49566 | 122.5177 | 0.028750929 | -8.58132 | 122.50869 | 0.3085433 |
| -8.63428 | 122.2926 | 0.056522535 | -8.57009 | 122.25294 | 0.0277057 |
| -8.63414 | 122.2925 | 0.010249706 | -8.58783 | 122.25292 | 0.0012409 |
| -8.63414 | 122.2925 | 0.01356654 | -8.57563 | 122.3911 | 0.0037266 |
| -8.63414 | 122.2932 | 0.239153825 | -8.5745 | 122.31706 | 0.0089333 |
| -8.63325 | 122.2956 | 0.004363717 | -8.57973 | 122.31514 | 0.0036359 |
| -8.62993 | 122.2918 | 0.002127022 | -8.57309 | 122.3122 | 0.00076 |
| -8.62698 | 122.5402 | 0.030258324 | -8.5708 | 122.39244 | 3.49E-05 |
| -8.62337 | 122.2909 | 0.000642236 | -8.58775 | 122.39419 | 0.0018203 |
| -8.61207 | 122.2902 | 0.000568804 | -8.55711 | 122.39471 | 0.0003978 |
| -8.6089 | 122.2898 | 0.006831018 | -8.55652 | 122.3953 | 0.0012533 |
| -8.60864 | 122.3468 | 0.016908005 | -8.55598 | 122.39588 | 0.0024093 |
| -8.60859 | 122.3466 | 0.000236513 | -8.55408 | 122.39655 | 0.0006952 |
| -8.60442 | 122.4678 | 0.082532458 | -8.55237 | 122.37278 | 0.0101071 |
| -8.60313 | 122.4662 | 0.022970984 | -8.3018 | 122.37074 | 0.0276023 |
| -8.60254 | 122.4658 | 0.038551478 | -8.320001 | 122.26257 | 0.0006898 |
| -8.60086 | 122.4316 | 0.006540752 | -8.55975 | 122.41352 | 0.0174307 |
| -8.60047 | 122.4711 | 0.000141708 | -8.55967 | 122.41536 | 0.0762437 |
| -8.59993 | 122.4275 | 0.001094629 | -8.55786 | 122.4279 | 0.0190004 |
| -8.59987 | 122.4279 | 0.027525912 | -8.5527 | 122.47206 | 0.0137233 |
| -8.59902 | 122.288 | 0.003843321 | -8.55771 | 122.30225 | 0.004437 |
| -8.59667 | 122.2878 | 0.013636692 | -8.552286 | 122.48718 | 0.0496706 |
| -8.59608 | 122.4578 | 0.005058431 | -8.551544 | 122.49152 | 0.0788079 |
| -8.59378 | 122.4526 | 0.099454253 | -8.551298 | 122.49312 | 0.0494329 |
| -8.550493 | 122.4998 | 0.016970998 | Total Biomass of fish : 2,008 | ||
Table 2: Biomass estimation of fish (Ton) in depth 1-10 m.
Fish stock estimation of biomass results obtained at a depth of 11- 20 meters has a spatial distribution that is more than the depth of 1-10 meters (Figure 6), these results can be seen in (Figure 7) in the 3 D spatial distribution of fish at the depth of 1-10 meters, dengan sebaran terbanyak yaitu 0 to 50 (tail/1000 m3), sebaran spasial yang paling merata yaitu 51-100, dan sebaran paling sedikit yaitu pada biomassa 201-310 (tail/1000 m3).
The total biomass of fish in this study showed more the number is at a depth of 11-20 m that is 2,008 tons/Km and at a depth of 1-10 m have the total fish biomass is 12.33 tons/Km with a total different single target detection, the results obtained are the actual results of the tool hydroacoustic a single beam and do not use the fishing gear for example aids gillnet is not the same with other research [13,14], Single detection is done using a single target hydroacoustic show more dominance at a depth of 11-20 m in Sikka regency waters, MTB, Indonesia in May 2015.
Number of data from results obtained by looking at the relationship between the number of the data with the total biomass in keadalam 1-10 m has equation Y=0.0967 x+0.0486 with R2 is 0.0464 (4%) (Figure 8), while at a depth of 11-20 m has a regression equation is Y=0.0003 x+0041 with the R2 is 0.0091 (0.9%). Variations in the data or the detection of single targets have variations over the data that is at a depth of 11-20 m with regression low percentage is 0.9% (Figure 9).

Figure 8: Relationships between number of data with total biomass (Ton) in depth 1-10 m.

Figure 9: Relationships between number of data with total biomass (Ton) in depth 11-20 m.
Conclusion
Fish stock estimation by using the hydroacoustic method have horizontal distribution shows fluctuations striking at research location has the highest salinity levels in the range of 29.3-29.8 psu. Total biomass of fish in this study showed more the number is at a depth of 11-20 m that is 2,008 tons/Km and at a depth of 1-10 m have the total fish biomass is 12.33 tons/Km, single detection is done using a single target hidroacoustic show more dominance at a depth of 11-20 m in Sikka regency waters, MTB, Indonesia in May 2015.
References
- Wulandari PD, Pujiyati S, Hestirianoto T, Lubis MZ (2016) Bioacoustic Characteristic Click Sound and Behaviour of Male Dolphins Bottle Nose (Tursiops aduncus).J Fisheries Livest Prod 4: 1
- Lubis MZ (2014) Bioakustik Stridulatory Gerak Ikan Guppy (Poecilia reticulata) Saat Proses Aklimatisasi Kadar Garam.
- Simmonds EJ, Maclennan DN (2005) Fisheries Acoustics: Theory and Practice. (2ndenn) Oxford: Blackwell Science Ltd 1-456.
- Manik HM, Furusawa M, Amakasu K (2006) Quantifying sea bottom surface backscattering strength and identifying bottom fish habitat by quantitative echo sounder. Japanese journal of applied physics 45: 4865.
- Manik HM (2010) Measurement of acoustic reflection of tuna fish using echosounder instrument. ILMU KELAUTAN, Indonesian Journal of Marine Sciences 14: 84-88.
- Pujiyati S, Manik HM, Harahap ZA (2011) Acoustic Backscatter Quantification of Seabed Using Multibeam Echosounder Instrument.
- Pujiyati S, Hartati S, Priyono W (2010) Effects of grain size, roughness, and hardness of sea floor on back scattering value based on hydroacoustic detection. E-Jurnal Ilmu dan Teknologi Kelautan Tropis 2: 59-67
- Pujiyati S (2008) Pendekatan metode hidroakustik untuk analisis keterkaitan antara tipe substrat dasar perairan dengan komunitas ikan demersal.
- Moniharapon D, Jaya I, Manik H, Pujiyati S, Hestirianoto T, et al. (2014) Migrasi Vertikal Zooplankton Di Laut Banda.
- Lennan MDN, Simmonds EJ (1992) Fisheries Acoustic. Chapman and Hall. London: 1-325.
- Natsir M, Sadhotomo B, Wudianto (2005) Biomass Estimation Pelagic Waterway Tomini With Bim Acoustic Method Divided. Jurnal Penelitian Perikanan Indonesia. 11: 101-107.
- Johanesson KA, Mitson RB (1983) Fisheries Acoustic. A Practical Manual for Acoustic Biomass Estimation. FAO Fisheries Tech.
- Mehner T, Schulz M (2002) Monthly variability of hydroacoustic fish stock estimates in a deep lake and its correlation to gillnet catches. Journal of Fish Biology 61: 1109-1121.
- Patterson K, Cook R, Darby C, Gavaris S, Kell L, et al. (2001) Estimating uncertainty in fish stock assessment and forecasting. Fish and Fisheries 2: 125-157.
Relevant Topics
- Acoustic Survey
- Animal Husbandry
- Aquaculture Developement
- Bioacoustics
- Biological Diversity
- Dropline
- Fisheries
- Fisheries Management
- Fishing Vessel
- Gillnet
- Jigging
- Livestock Nutrition
- Livestock Production
- Marine
- Marine Fish
- Maritime Policy
- Pelagic Fish
- Poultry
- Sustainable fishery
- Sustainable Fishing
- Trawling
Recommended Journals
Article Tools
Article Usage
- Total views: 11732
- [From(publication date):
December-2016 - Mar 29, 2025] - Breakdown by view type
- HTML page views : 10807
- PDF downloads : 925