Research Article Open Access
Fish Assemblage Patterns: Temporal Distribution Structure and Influence of Environmental Variables in the Karnafully River Estuary, Bangladesh
Md. Rashed-Un-Nabi1, Shamsuzzaman M2, Hasan A2 and Barman PP2*1Institute of Marine Sciences and Fisheries, University of Chittagong, Chittagong-4331, Bangladesh
2Department of Coastal and Marine Fisheries Faculty of Fisheries Sylhet Agricultural University, Bangladesh
- *Corresponding Author:
- Barman PP
Department of Coastal and Marine Fisheries
Faculty of Fisheries, Sylhet Agricultural University
Sylhet-3100, Bangladesh
Tel: +8801722967408
E-mail: ppbarman.sau29@gmail.com
Received Date: November 12, 2015; Accepted Date: March 11, 2016; Published Date: March 27, 2016
Citation: Rashed-Un-Nabi M, Shamsuzzaman M, Hasan A, Barman PP (2016) Fish Assemblage Patterns: Temporal Distribution Structure and Influence of Environmental Variables in the Karnafully River Estuary, Bangladesh. J Fisheries Livest Prod 4:174. doi: 10.4172/2332-2608.1000174
Copyright: © 2016 Rashed-Un-Nabi M, et al. This is an open-access article distributed under the terms of the Creative Commons Attribution License, which permits unrestricted use, distribution, and reproduction in any medium, provided the original author and source are credited.
Visit for more related articles at Journal of Fisheries & Livestock Production
Abstract
This research aims at studying the temporal distribution of fish assemblage in the Karnafully river estuary, Bangladesh. To study the fish assemblage catch from Estuarine Set Bag Net (Behundijal) as well water samples were collected in four seasons (winter, pre-monsoon, monsoon and post-monsoon) from March 2013 to February 2014. Multivariate analyses were performed using the software PRIMER V6 and Canonical Correspondence Analysis (CCA) was done using the PAST software. In the present study, 41 species of fish were identified where, Harpodon nehereus (20.54%) was found to be most dominant species. The Shannon-Wiener diversity index (2.67 ± 0.05), Margalef richness index (5.14 ± 0.64), Pielou’s evenness index (0.96 ± 0.007) was high, while Simpson dominance index (0.95 ± 0.002) was low in the monsoon season, which indicates monsoon had high fish diversity than the other seasons. At the similarity of 50.5%, three groups were attained while, monsoon-2 showed separate clustering from other groups. The Non-metric Multidimensional Scaling (nMDS) showed 20% similarity in all seasons based on Bray-Curtis similarity matrix. The CCA ordination indicated that salinity and DO were the two most important environmental parameters shaping the fish assemblage structure in the Karnafully river estuary.
Keywords
Karnafully river estuary, Fish assemblage, ANOSIM, SIMPER, CCA
Introduction
Estuaries are the meeting place of freshwater and saltwater and a dynamic environment [1]. It is not only providing important economic functions in transportation, industry and tourism but also helps to drainage of domestic and industrial waste [2]. It is dominated by marine species but offer resident for both freshwater and marine species [3]. High levels of productivity in estuary are often related to environmental variables like salinity, water depth, temperature, turbidity and DO [4,5]. Estuary provides nursing, feeding and spawning grounds for numerous fish species [6,7]. These fish assemblages change continually in time and space [8]. The Karnafully estuary plays an important role in term of both economic and ecological function for Bangladesh. It is one of the most important estuary provides spawning, nursing, feeding ground for numerous fish species and active fishing done here. However, some sprinkled researches on different biological aspects of the Karnafully estuarine system. The current study was designed to fulfill the gap of those previous studies. Hence, the present study was undertaken to investigate the effect of physico-chemical parameters of water on seasonal variation of fish assemblage in the Karnafully river estuary.
Materials and Methods
The Karnafully River is the principal river originated from the Lushai Hills of Mizoram (India), flows through Chittagong city and finally discharges into the Bay of Bengal. The geographical location of the study area is latitude "2116′32′′ N to longitude 91°50′48′′ E" known as 11 no. ghat (Figure 1). Fish samples were collected by using set bag net (Figure 2), locally called Behundi jal from March 2013 to February 2014 in four season proposed by Mahmood, et al. [9] were winter (December- February), Pre-monsoon (March-May), Monsoon (June- September) and Post-monsoon (October-November). Sampling was done during the full moon and new moon, because in this time fish abundance is higher mentioned by the local fishermen. Around 1 kg of unsorted fish was directly collected from ESBN catch and identified up to species level proposed by Howlader [10] and Fish base (2013) [11]. Environmental parameters were recorded by using centigrade thermometer for water temperature, Refractometer (NewS-100, TANAKA, Japan) for salinity, DO meter (HI 9142, HANNA Instruments) for DO and pen pH meter (s327535, HANNA Instruments) for alkalinity. Water transparency measured by using a 20 cm diameter secchi disc.
Diversity of the species assemblage was analyzed by the Shannon- Wiener index (H′), species richness by Margalef index (d), evenness by Pielou’s index (J′), and dominance was measured by Simpson index (c). A one- way analysis of variance (ANOVA) was used to test for significant difference in environmental variables, different diversity index and fish abundance among seasons. Prior to ANOVA test, all variables were tested for normality and homogeneity using “Kolmogrouv Smirnov test” and “Levene’s test” [12]. One-way analysis of Similarity (ANOSIM) was used to conclude the significance of temporal variation in the structure of fish assemblage. The test based on a Bray-Curtis similarity matrix and were calculated using log(X+1) transformed data. Similarity percentages analyses (SIMPER) were used to observe the percentage contribution of each taxon to the average dissimilarity between the various season combinations. Non-metric multidimensional scaling (nMDS) was performed to investigate similarities among fish abundance. For descriptive statistics and ANOVA test SPSS software V11.5 was used. All the multivariate analysis were performed using the software PRIMER V6 (Plymouth Routines Multivariate Ecological Research). Canonical correspondence analysis (CCA) was used to investigate the relationship between species assemblage composition and environmental variables using PAST2.16 software.
Results and Discussion
Environmental variables of the area
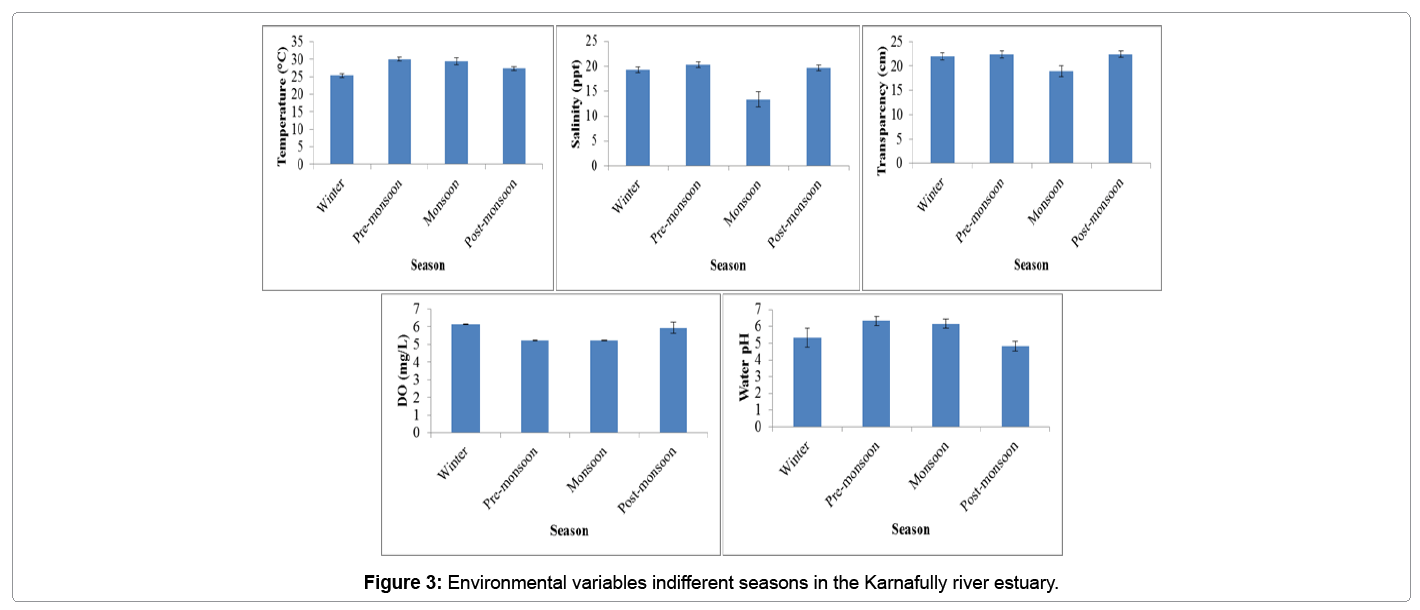
Environmental variables observed and recorded during this study are summarized in Table 1 and illustrated in Figure 3. Water temperature varied from 25.33 ± 0.57°C (winter) to 30.00 ± 0.58°C (pre-monsoon), salinity from 13.33 ± 1.52 ppt (Monsoon) to 20.33 ± 0.57 ppt (pre-monsoon), water transparency was 18.93 ± 1.11 cm (Monsoon) to 22.44 ± 0.72 cm (Post-monsoon), DO was 5.21 ± 0.01 mg/L (monsoon) to 6.13 ± 0.02 mg/L (winter) and water pH was 5.33 ± 0.57 (winter) to 6.33 ± 0.28 (pre-monsoon). During pre-monsoon air temperature remain higher than other season which may leads high water temperature and high evaporation rate, that’s why water salinity was high in pre-monsoon. On the other hand, due to heavy rainfall and mixing of runoff water, transparency was very low in monsoon compared with other season and caused lowers the DO level. Similar trends were also recorded for Kaptai lake [13] and Maheshara Lake in Gorakhpur [14] which are more or less similar with present study.
| Season | Temp (°C) | Salinity (ppt) | Transparency (cm) | DO (mg/L) | pH |
|---|---|---|---|---|---|
| Winter | 25.33 ± 0.57 | 19.33 ± 0.54 | 22.01 ± 0.73 | 6.13 ± 0.02 | 5.33 ± 0.57 |
| Pre-monsoon | 30.00 ± 0.58 | 20.33 ± 0.57 | 22.41 ± 0.73 | 5.22 ± 0.01 | 6.33 ± 0.28 |
| Monsoon | 29.33 ± 1.01 | 13.33 ± 1.52 | 18.93 ± 1.11 | 5.21 ± 0.01 | 6.16 ± 0.28 |
| Post-monsoon | 27.33 ± 0.57 | 19.67 ± 0.57 | 22.44 ± 0.72 | 5.93 ± 0.32 | 4.83 ± 0.29 |
Table 1: Mean value of environmental variables in different seasons in the Karnafully river estuary.
Species abundance
From the Karnafully River estuary a total of 1193 individual of fin fishes were collected during the study (Table 2) which represent 41 species. The most dominant taxa were found H. nehereus (20.54%). The total abundance of species in each season ranged between 17 (postmonsoon) to 31 (monsoon). A total of 46 and 45 finfish species recorded in Karnafully [15] and Bakkhali river estuary [16] respectively, which coincide the present result.
| Serial no. | Species Name | Total | % Contribution | % Contribution in different season | |||
|---|---|---|---|---|---|---|---|
| Winter | Pre Monsoon | Mon soon | Post Monsoon | ||||
| 1 | Harpodonnehereus (Hamilton-Buchannan, 1822) | 245 | 20.54 | 16.32 | 1.667 | 30.031 | 10.8 |
| 2 | Pannamicrodon (Bleeker, 1849) | 208 | 17.44 | 8.163 | 18.333 | 18.711 | 17.6 |
| 3 | Coiliaramcarati (Hamilton-Buchanan, 1822) | 172 | 14.42 | 8.163 | 22.222 | 14.937 | 10 |
| 4 | Johnius macropterus (Bleeker, 1853) | 130 | 10.9 | 27.891 | 9.444 | 3.774 | 19.2 |
| 5 | Eleutheronema tetradactylum (Shaw, 1804) | 77 | 6.45 | 0.68 | 1.111 | 11.478 | 0.4 |
| 6 | Coilia dussumieri (Valenciennes, 1848) | 52 | 4.36 | 10.204 | 1.111 | 2.358 | 8 |
| 7 | Cynoglossus lingua (Hamilton-Buchanan, 1822) | 52 | 4.36 | 9.524 | 5 | 0.943 | 9.2 |
| 8 | Odontamblyopus rubicundus (Hamilton, 1822) | 51 | 4.28 | 2.041 | 3.889 | 6.447 | 0 |
| 9 | Mystusgulio (Hamilton and Buchanna, 1822) | 41 | 3.44 | 0.68 | 15 | 0.157 | 4.8 |
| 10 | Setipinnataty (Valenciennes, 1848) | 24 | 2.01 | 0.68 | 7.778 | 0.629 | 2 |
| 11 | Trypauchen vagina (Bloch & Schneider) | 19 | 1.593 | 2.721 | 0.556 | 0.943 | 3.2 |
| 12 | Gudusia chapra (Hamilton, 1822) | 18 | 1.509 | 0 | 0.556 | 0.629 | 5.2 |
| 13 | Polynemus indicus (Shaw, 1804) | 15 | 1.257 | 2.041 | 0 | 0.629 | 3.2 |
| 14 | Alentrogobius sp. | 9 | 0.754 | 0 | 2.222 | 0 | 2 |
| 15 | Cynoglossus macrolepidotus (Bleeker, 1851) | 9 | 0.754 | 4.762 | 1.111 | 3.145 | 0 |
| 16 | Paraplagusia bilineata (Bloch, 1784) | 8 | 0.671 | 1.361 | 0.556 | 0 | 2 |
| 17 | Stolephorus tri (Bleeker, 1852) | 7 | 0.587 | 0.68 | 0 | 0.943 | 0 |
| 18 | Tennualosatoli (Valenciennes, 1847) | 7 | 0.587 | 0 | 0.556 | 0.629 | 0.8 |
| 19 | Gymnothoraxpunctatus (Bloch &Schnieder, 1801) | 5 | 0.419 | 0 | 1.111 | 0.157 | 0.8 |
| 20 | Phisodonophis boro (Hamilton, 1822) | 5 | 0.419 | 0 | 1.667 | 0.314 | 0 |
| 21 | Arius arius (Hamilton, 1822) | 4 | 0.335 | 0.68 | 0 | 0.157 | 0.8 |
| 22 | Polynemus indicus (Shaw, 1804) | 4 | 0.335 | 0.68 | 1.667 | 0 | 0 |
| 23 | Apocryptes lanceolatus (Day, 1875-78) | 3 | 0.251 | 0 | 0 | 0.472 | 0 |
| 24 | Congresox talabonoides (Bleeker, 1853) | 3 | 0.251 | 1.361 | 0 | 0.157 | 0 |
| 25 | Corvina dussumieri (Sasaki, 1999) | 3 | 0.251 | 0 | 0 | 0.472 | 0 |
| 26 | Rita rita (Hamilton, 1822) | 3 | 0.251 | 0 | 0 | 0.472 | 0 |
| 27 | Johnius belangerii (Cuvier, 1830) | 2 | 0.168 | 0.68 | 0 | 0.157 | 0 |
| 28 | Lutjanus russelli (Bleeker, 1849) | 2 | 0.168 | 0.68 | 0.556 | 0 | 0 |
| 29 | Sillagodomina (Cuvier: Day, 1876) | 2 | 0.168 | 0 | 0 | 0.314 | 0 |
| 30 | Terapon jarbua (Forsskal, 1775) | 2 | 0.168 | 0 | 1.111 | 0 | 0 |
| 31 | Boleopthalmus viridis (Cuvier & Valenciennes, 1851) | 1 | 0.084 | 0 | 0 | 0.157 | 0 |
| 32 | Dussumieria acuta (Valenciennes, 1847) | 1 | 0.084 | 0 | 0 | 0.157 | 0 |
| 33 | Lepturacanthus savala (Cuvier, 1829) | 1 | 0.084 | 0 | 0 | 0.157 | 0 |
| 34 | Monopterus cuchia (Hamilton, 1822) | 1 | 0.084 | 0 | 0 | 0.157 | 0 |
| 35 | Pampus chinensis (Euphrasn, 1788) | 1 | 0.084 | 0 | 0 | 0.157 | 0 |
| 36 | Platycephalus indicus (Linnaeus, 1758) | 1 | 0.084 | 0 | 0 | 0.157 | 0 |
| 37 | Pseudapocryptes lanceolatus (Bloch-Schneider, 1801) | 1 | 0.084 | 0 | 0.556 | 0 | 0 |
| 38 | Cynoglossus deltae (Jenkins, 1910) | 1 | 0.084 | 0 | 0.556 | 0 | 0 |
| 39 | Gobiodesrudicundus (Hamilton-Buchanan, 1822) | 1 | 0.084 | 0 | 0.556 | 0 | 0 |
| 40 | Glossogobius giuris (Hamilton-Buchanan, 1822) | 1 | 0.084 | 0 | 0.556 | 0 | 0 |
| 41 | Acentrogobius cyanomos (Bleeker, 1849) | 1 | 0.084 | 0 | 0.556 | 0 | 0 |
| Total number of taxa | 41 | 20 | 26 | 31 | 17 | ||
| Total number of individual | 1193 | 147 | 180 | 636 | 250 | ||
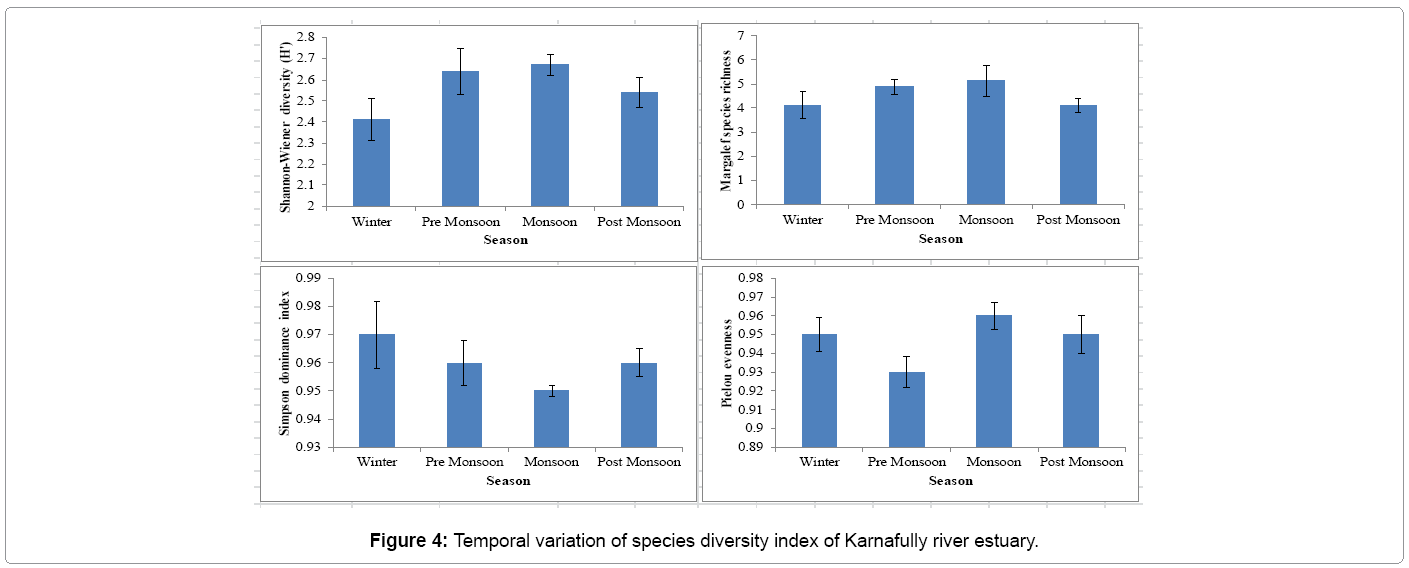
| Shannon ± SD | 2.41 ± 0.10 | 2.64 ± 0.11 | 2.67 ± 0.05 | 2.54 ± 0.07 | |||
| Margalefindex ± SD | 4.14 ± 0.56 | 4.88 ± 0.33 | 5.14 ± 0.64 | 4.12 ± 0.30 | |||
| Pielou ± SD | 0.95 ± 0.009 | 0.93 ± 0.008 | 0.96 ± 0.007 | 0.95 ± 0.010 | |||
| Simpson ± SD | 0.97 ± 0.012 | 0.96 ± 0.008 | 0.95 ± 0.002 | 0.96 ± 0.005 | |||
Table 2: Fish species recorded in the Karnafully river estuary in different seasons showing relative abundance.
Species diversity
Different species diversity index was calculated to observe the fish diversity in the Karnafully river estuary (Figure 4). The Shannon- Wiener diversity index (H') ranged from 2.41 ± 0.10 (winter) to 2.67 ± 0.05 (monsoon), Margalef richness index was 5.14 ± 0.64 (monsoon) to 4.12 ± 0.30 (post-monsoon), Pielou’s evenness was 0.96 ± 0.007 (monsoon) to 0.93 ± 0.008 (pre-monsoon), Simpson dominance was 0.97 ± 0.012 (winter) to 0.95 ± 0.002 (monsoon). Significant difference observed for Shannon-Wiener diversity (p = 0.02) and Pielou’s evenness index (p = 0.009) whereas no significant difference observed for Margalef richness (p = 0.07) and Simpson dominance index (p = 0.12) among the seasons. Monsoon season shows high diversity value, richness and evenness value, but low richness value compared with other seasons which indicates monsoon season had high species diversity than others. However, monsoon is the breeding season for many fish species, so that in this time greater assemblage of fish species observed in estuary, that’s why monsoon season was more diversify [16].
Species assemblage
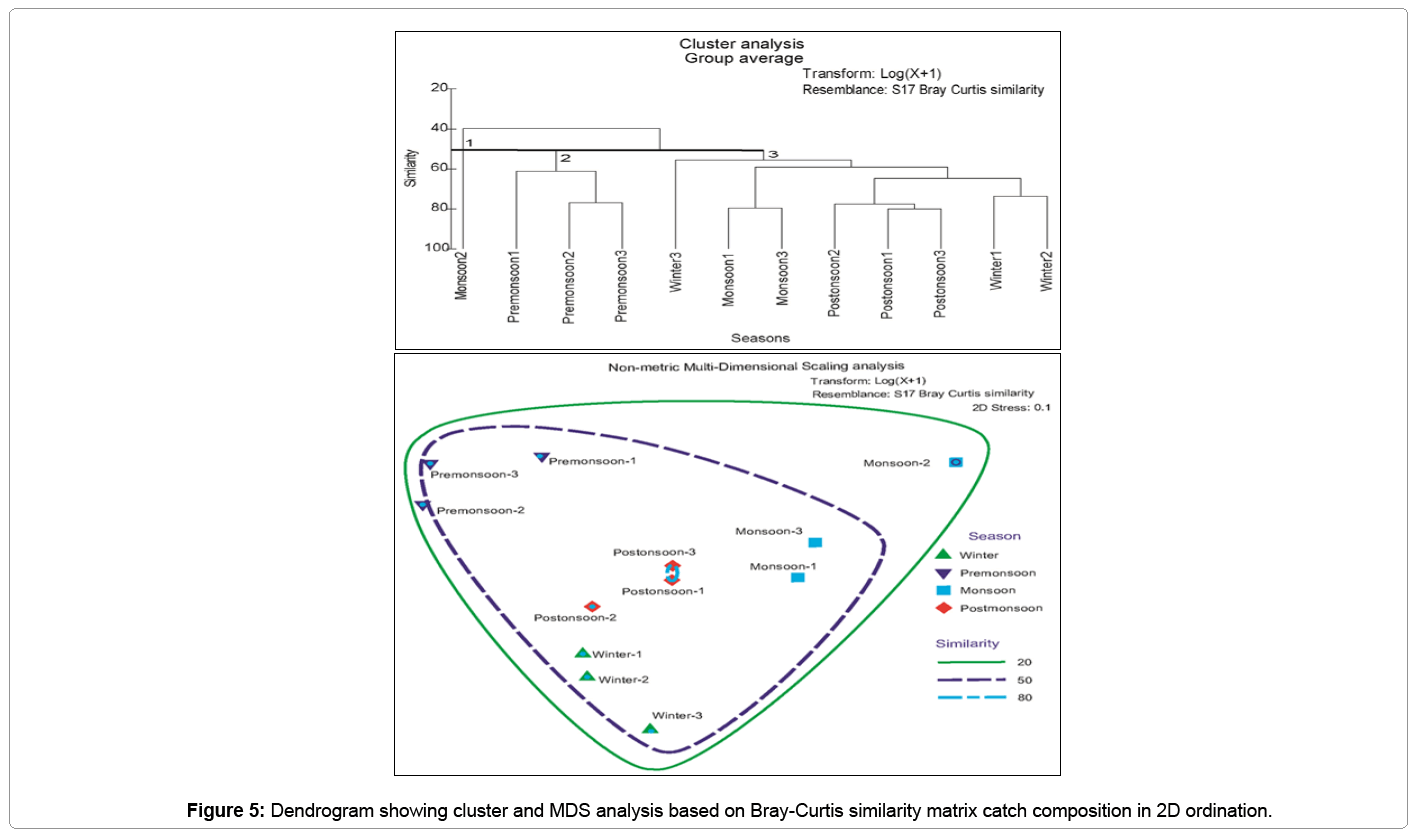
Significant difference were found among seasons (Table 3) represent by analysis of similarity (ANOSIM) where global R was observed 0.796 and p = 0.01. SIMPER analysis showed the average similarity of species in winter was 66.70%, pre-monsoon was 66.47%,monsoon was 64.16%, post monsoon was 78.36% and most contributing species was J. macropterus (22.73%), P. microdon (17.04%), P. microdon (18.97%) and J. macropterus (14.44%) respectively (Table 4). Nonmetric Multidimensional Scaling (nMDS) analysis was performed to investigate similarities among fish abundance. Three marked separation observed in the abundance of fish in different seasons (Figure 5). Through cluster analysis, at 50.5% similarity three groups were attained while, monsoon-2 showed separate clustering from other groups. nMDS shows 20% similarity for all seasons. Only postmonsoon-1 and postmonsoon-3 season shows 80% similarity together shown in Figure 5.
| ANOSIM | Average dissimilarity (%) | SIMPER | |||
|---|---|---|---|---|---|
| R=0.796, p=0.1% Groups | R | p | Most contributing species | %Contribution | |
| Winter, Pre-monsoon | 1 | 0.1 | 52.1 | Eleutheronema tetradactylum | 11.57 |
| Winter, Monsoon | 0.815 | 0.1 | 53.94 | Mystes gulio | 10.48 |
| zWinter, Post-monsoon | 0.704 | 0.1 | 38.53 | Guducia chapra | 10.31 |
| Pre-monsoon, Monsoon | 0.926 | 0.1 | 56.45 | Harpodon nehereus | 11.75 |
| Pre-monsoon, Post-monsoon | 1 | 0.1 | 45.65 | Eleutheronema tetradactylum | 11.56 |
| Monsoon, Post-monsoon | 0.704 | 0.1 | 43.99 | Harpodon nehereus | 8.8 |
Table 3: Result of ANOSIM & SIMPER analysis of fish abundances between diferent seasons.
| Average similarity | |||
|---|---|---|---|
| Winter (66.70%) | Pre-monsoon (66.47%) | ||
| Contributing Species | % | Contributing Species | % |
| Johnius macropterus | 22.73 | Panna microdon | 17.04 |
| Harpodon nehereus | 17.57 | Harpodon nehereus | 16.87 |
| Cyanoglossus lingua | 14.42 | Coiliaram korati | 14.63 |
| Coiliadus sumieri | 11.92 | Eleutheronema | 13.17 |
| Coiliaram korati | 8.93 | Odontamblypous rubicanduy | 12.05 |
| Cyanoglossus cyanoglossus | 6.21 | Johnius macropterus | 9.58 |
| Polynemus paradiseus | 6.21 | Trypauchen vagina | 4.08 |
| Panna microdon | 5.76 | Coilia lingua/ dussumieri | 3.18 |
| Monsoon (64.16%) | Post-monsoon (78.36%) | ||
| Contributing Species | % | Contributing Species | % |
| Pannamicrodon | 18.97 | Johnius macropterus | 14.44 |
| Mystesgulio | 17.45 | Pannamicrodon | 13.9 |
| Coiliaramkorati | 12.9 | Harpodonnehereus | 11.01 |
| Setipinnaphasa | 10.37 | Coiliaramkorati | 10.63 |
| Odontamblypous rubicanduy | 8.59 | Coiliadussumieri | 9.57 |
| Cyanoglossus lingua | 7.14 | Cyanoglossus lingua | 9.18 |
| Phisodonophisboro | 5.42 | Mystesgulio | 7.92 |
| Johnius macropterus | 5.16 | Guducia chapra | 6.89 |
| Alentrogobiussp | 1.78 | Trypauchen vagina | 4.48 |
| Coiliadussumieri | 1.78 | Alentrogobiussp | 3.76 |
Table 4: Average similarity of contributing species in each season using SIMPER analysis.
Canonical correspondence analysis (CCA)
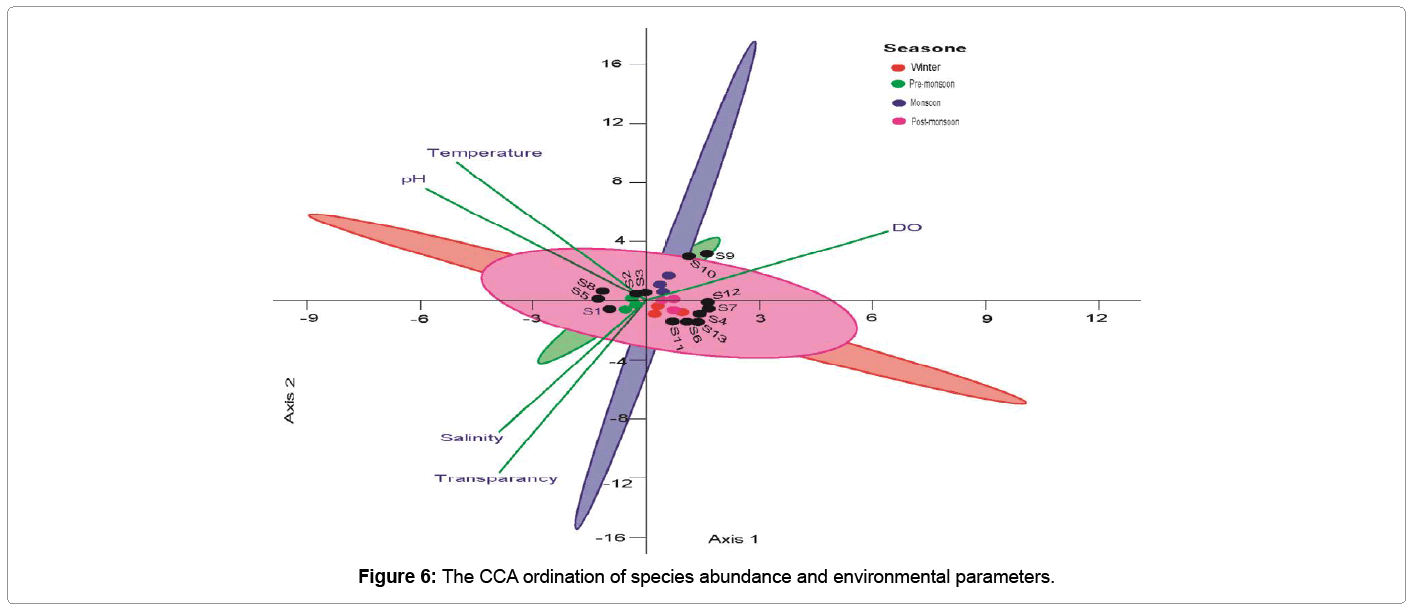
CCA provided insight into the relationship between the fish assemblage and environmental variables. Results obtained from CCA were plotted in Figure 6. Species plotted closer to the vector had stronger relationship with them. The CCA ordination indicates salinity and DO are two most important environmental parameters shaping species assemblage structure in the Karnafully River estuary than the other variables. Salinity is strongly allied with distribution of estuarine fish communities as reported in Bakkhali river estuary which are homologues with the present findings [16]. As shown in CCA ordination S1= H.nehereus, S2= P.microdon, S3 = C.ramkorati, S4= J. macropterus, S5 = E.tetradactylum, S6 = C.dussumieri, S7 = C. lingua, S8 = O.rubicanduy, S9 = M.gulio, S10 = S.phasa, S11 = T. vagina, S12 = G.chapra, S13 = P.paradiseus.
Conclusion
The seasonality of the environmental conditions co-occurred with the major variations of the fish assemblage. Seasonal variations occurred not only in total abundance and diversity, but also on the structure of the species assemblage of the Karnafully river estuary. H. nehereus was found as most dominant fish in the Karnafully River contributing 20.540% in total species composition, while other species showed equal distribution throughout the seasons. Salinity and DO were two most important variables shaping the species assemblage in the Karnafully river estuary. Species diversity was low, that may probably because of the Karnafully river estuary is highly polluted by industrial pollution and high discharge of polluted material from oil tanker, fertilizer factory, Chittagong City Corporation which is degrading the ecological condition of the Karnafully river estuary water.
References
- Eick D, Thiel R (2014) Fish assemblage patterns in the Elbe estuary: guild composition, spatial and temporal structure, and influence of environmental factors. Mar Biodiv 44: 559-580.
- Hossain MS, Das NG, Sarker S, Rahman MZ (2012) Fish diversity and habitat relation-ship with environmental variables at Meghna river estuary, Bangladesh. Egyptian Journal of Aquatic Research 38: 213-226.
- Thiel R (2012) The fish fauna of European estuaries. Structural analysis focusing Tideelbe. Essays Society of Natural Scientists in Hamburg 43.
- Menezes RF, Borchsenius F, Svenning JC (2013) Variation in fish community structure, richness, and diversity in 56 Danish lakes with contrasting depth, size, and trophic state: does the method matter? Hydrobiologia 710: 47-59.
- Potter IC, Tweedley JR, Elliott M, Whitfield AK (2013) The ways in which fish use estuaries: a refinement and expansion of the guild approach. Fish and Fisheries 16: 230-239.
- Alam MS, Hossain MS, Monwar MM, Hoque ME (2013) Assessment of fish distribution and biodiversity status in Upper Halda River, Chittagong, Bangladesh. Int J Biodivers Conserv 5: 349-357.
- Sukumaran M, Muthukumaravel K, Kothandapani S (2014) Studies on the diversity of ichthyo -fauna in Muthupet estuary South east coast of India. International Research in Arts and Sciences 3: 37-40.
- Tang S, Zhang T, Lu J, Li D, Pan J, Duan C (2015) Temporal and spatial variation in fish assemblages in Lake Taihu, China. Journal of Freshwater Ecology 30: 181-196.
- Mahmood N, Chowdhury MJU, Haider SMB, Chowdhury SR (1992) A review of the state or environment relating to marine fisheries of Bangladesh, MS thesis, Institute of Marine Science, Chittagong University, Bangladesh.
- Howlader MS (1976) A taxonomic account of penaeid shrimps of Bangladesh waters. Bangladesh Journal of Science and Industrial Researches 11: 122-138.
- Fish Base (2013) List of freshwater fishes for Bangladesh.
- Akin S, Buhan E, Winemiller KO, Yilmaz H (2005) Fish assemblage structure of Koycegiz lagoon-estuary, Turkey: spatial and temporal distribution patterns in relation to environmental variation. Estuarine, Coastal & Shelf Science 64: 671-684.
- Rahman MM, Bashar MA, Farhana Z, Hossain MY (2014) Temporal Variation of Physicochemical Parameters in Kaptai Lake, Bangladesh. World Journal of Fish and Marine Sciences 6: 475-478.
- Shukla PP, Singh A (2013) A seasonal variations of plankton population of Maheshara Lakein Gorakhpur, India. World Journal of Zoology 8: 9-16.
- Kamal MM (2000) Temporal and spatial variation in species diversity of fishes in the Karnafully River Estuary. M.S Thesis, Institute of Marine Sciences, University of Chittagong, Bangladesh.
- Nabi MRU, Mamun MAA, Ullah MH, Mustafa MG (2011) Temporal and spatial distribution of fish and shrimp assemblage in the Bakkhali river estuary of Bangladesh in relation to some water quality parameters. Marine Biology Research 7: 436-452.
Relevant Topics
- Acoustic Survey
- Animal Husbandry
- Aquaculture Developement
- Bioacoustics
- Biological Diversity
- Dropline
- Fisheries
- Fisheries Management
- Fishing Vessel
- Gillnet
- Jigging
- Livestock Nutrition
- Livestock Production
- Marine
- Marine Fish
- Maritime Policy
- Pelagic Fish
- Poultry
- Sustainable fishery
- Sustainable Fishing
- Trawling
Recommended Journals
Article Tools
Article Usage
- Total views: 13593
- [From(publication date):
June-2016 - Mar 29, 2025] - Breakdown by view type
- HTML page views : 12537
- PDF downloads : 1056
