Research Article Open Access
Feature Extraction of the Alzheimer's Disease Images Using Different Optimization Algorithms
Mohamed M. Dessouky* and Mohamed A. Elrashidy
Department of Computer Science and Engineering, Faculty of Electronic Engineering, University of Menoufiya, Egypt
- Corresponding Author:
- Mohamed M. Dessouky
Department of Computer Science and Engineering
Faculty of Electronic Engineering
University of Menoufiya, Egypt
Tel: +2 0100-0580-440
E-mail: mohamed.moawad@el-eng.menofia.edu.eg
Received date: February 29, 2016; Accepted date: April 04, 2016; Published date: April 11, 2016
Citation: Dessouky MM, Elrashidy MA (2016) Feature Extraction of the Alzheimer’s Disease Images Using Different Optimization Algorithms. J Alzheimers Dis Parkinsonism 6:230. doi:10.4172/2161-0460.1000230
Copyright: © 2016 Dessouky MM, et al. This is an open-access article distributed under the terms of the Creative Commons Attribution License, which permits unrestricted use, distribution, and reproduction in any medium, provided the original author and source are credited.
Visit for more related articles at Journal of Alzheimers Disease & Parkinsonism
Abstract
Alzheimer’s disease (AD) is a type of dementia that causes problems with memory, thinking and behavior. The symptoms of the AD are usually developed slowly and got worse over time, till reach to severe enough stage which can’t interfere with daily tasks. This paper extract the most significant features from 3D MRI AD images using different optimization algorithms. Optimization algorithms are stochastic search methods that simulate the social behavior of species or the natural biological evolution. These algorithms had been used to get near-optimum solutions for large-scale optimization problems. This paper compares the formulation and results of five recent evolutionary optimization algorithms: Particle Swarm Optimization, Bat Algorithm, Genetic Algorithm, Pattern Search, and Simulated Annealing. A brief description of each of these five algorithms had been presented. These five optimization algorithm had been applied to two proposed AD feature extraction algorithms to get near-optimum number of features that gives higher accuracy. The comparisons among the algorithms are presented in terms of number of iteration, number of features and metric parameters. The results show that the Pattern Search optimization algorithm gives higher metric parameters values with lower number of iteration and lower number of features as compared to the other optimization algorithms.
Keywords
Alzheimer’s disease (AD); Magnetic resonance imaging (MRI); Optimization algorithms; Feature extraction; Particle swarm optimization; Bat algorithm; Genetic algorithm; Pattern search; Simulated annealing
Introduction
Alzheimer’s disease is a degenerative brain disease and the most common cause of dementia. The most common initial symptom is a gradually worsening ability to remember. Alzheimer’s disease is a progressive disease, which means that it gets worse over time [1,2]. There is no cure, specific blood or imaging test for Alzheimer’s disease. However, some drugs are available which may help slow the progression of Alzheimer’s symptoms for a limited time. Diagnosis of the Alzheimer’s disease (AD) still a challenge and difficult, especially in the early stages. The early detection will be key to prevent, slow and stop Alzheimer’s disease. There are different previous algorithms had been proposed for early diagnosis of the AD. In [3], the Fisher discriminant ratio (FDR) and nonnegative matrix factorization (NMF) for feature selection and extraction of the most relevant features then support vector machines (SVM) classifier had been used. Both SPECT and PET database images containing data for both Alzheimer’s disease (AD) patients and healthy. In [4] presents a CAD system for early diagnosis of AD which consists of three stages: voxel selection using Mann–Whitney–Wilcoxon U-Test, feature extraction using Factor Analysis, and Linear Support Vector Machine (SVM) classifier had been used. Two different databases are used SPECT images and PET database had been used.
This paper compares among five important optimization algorithm to identify near-optimum number of features could be extracted from the 3D MRI AD images to early diagnose the AD. The optimization algorithms gained fame and attention because of the difficulties of the large-scale engineering problems. So, optimization algorithms had been proposed to search for near-optimum solutions of the problems.
Optimization algorithms are stochastic search methods that simulate the social behavior of species or the natural biological evolution. There are different natural examples like how fish and bird make schooling and find their destination during migration, the aggressive reproduction strategy of the Cuckoos birds, how ants and bees find the shortest route to a source of food, and how bats use echolocation to sense distance, and know the difference between food/prey and background barriers. Different algorithms had been developed to simulate the behavior of these species. These algorithms give fast, robust and near-optimum solutions of the complex optimization problems [5,6].
The first optimization algorithm is the genetic algorithm (GA) which had been introduced in 1975 [7]. This model based on Darwin’s theory of the ‘survival of the fittest’ of natural crossover and recombination, mutation, and selection. There are different applications in science and engineering used GA techniques [8,9]. There are many advantages of GA like its ability to deal with complex problems and parallelism. However, GAs may require long processing time for a near-optimum solution to evolve [5,6].
To reduce the processing time and improve the performance of the solutions, several improvements had been applied on the GA. Also, other optimization algorithms had been introduced which depends on different natural processes. This paper compare the results of GA with other four optimization algorithms. The first algorithm is the Pattern Search (PS) which is a one of direct search family which developed at 1960 [10]. PS is an evolutionary technique that is suitable to solve a variety of optimization problems that lie outside the scope of the standard optimization methods. Generally, PS has the advantage of being very simple in concept, easy to implement and computationally efficient [11,12]. The second algorithm is the Simulated Annealing (SA) which had been proposed at 1983 [13]. The idea of SA came from the annealing characteristics in metal processing. The physical process of annealing is the cooling of a metal sufficiently slowly so that it adopts a low-energy, crystalline state. Different applications used SA optimization technique [14,15]. The third algorithm is the Particle swarm optimization (PSO) which was developed at 1995 [16] and it is based on swarm behavior in nature, such as fish and bird schooling. PSO has been applied to almost every area in optimization, computational intelligence, and design applications. Different applications used PSO optimization technique [17,18]. The last optimization algorithm is the bat algorithm (BA) which is a bio-inspired algorithm developed at 2010 [19]. BA simulates the behavior of the bats which have advanced capability of echolocation. Different applications used BA optimization technique [20,21].
The rest of this paper is organized as follows: section 2 introduces the used database. Section 3 discusses the five optimization algorithms. Section 4 introduces the first and second proposed algorithms. Section 5 presents the performance evaluation metric parameters. Section 6 presents the optimization algorithms results, discussion and analysis. Result discussion given in section 7 and finally, the conclusion and references.
Materials and Database
The dataset that has been used for this study is the Open Access Series of Imaging Studies (OASIS) database [22,23]. OASIS database used to determine the sequence of events that happened in the progression of AD. The database consists of a cross-sectional collection of 416 subjects aged between 33 to 96 years. The subjects include normal subjects that has no disease (no dementia) with Clinical Dementia Rating (CDR) of 0, subjects have been diagnosed with very mild AD (CDR=0.5), subjects are diagnosed with mild AD (CDR=1) and subjects with moderate AD (CDR=2).
The subjects include both men and women. More women than men have Alzheimer’s disease and other dementias. Almost two-thirds of Alzheimer’s are women. Based on estimates from ADAMS, among people age 71 and older, 16% of women have Alzheimer’s disease and other dementias compared with 11% of men. The reason why more women than men have Alzheimer’s disease is the fact that women live longer than men on average, and older age is the greatest risk factor for Alzheimer’s. It is also found that there is no significant difference between men and women in the proportion who develop Alzheimer’s or other dementias at any given age [1].
In this study, T1-weighted MR volumes of 49 AD patients diagnosed with “very mild AD to mild AD” and 71 normal subjects are used. The subjects were randomly chosen to cover a wide and different ranges of Age, and MMSE. The female subjects is more than the male because of that the female is more susceptible to AD than males because the females are older age as denoted before. Table 1 summarizes important clinical and demographic information for each group. All subjects are 3D and MRI scans as shown in Figure 1 which illustrates two subjects, the first one is normal subject and is represented in Figure 1 (a). The second subject is for AD patients diagnosed with “mild AD” is depicted in Figure 1 (b). Each subject is represented by 3 planes or views.
| Group | AD (Very Mild – Mild) | Normal |
|---|---|---|
| No of subjects | 49 | 71 |
| Age | 62-90 | 33-94 |
| Clinical Dementia Rating (CDR) | 0.5 – 1 | 0 |
| Mini-Mental State Examination (MMSE) | 15-30 | 25-30 |
| Female/Male ratio | 30/19 | 52/19 |
Table 1: Summary of subject demographics and dementia status.

Figure 1: The two 3D images of non-demented and demented subjects.
The optimization Algorithms
All optimization algorithms require first representing the problem to a suitable form for each algorithm. Then, the evolutionary search algorithm is applied iteratively to arrive at a near-optimum solution. This paper compares among five algorithms which are Genetic Algorithm (GA), Simulated Annealing (SA), Pattern Search (PS), Particle Swarm Optimization (PSO), and Bat Algorithm (BA). A brief description of these five algorithms is presented in the following subsections.
Genetic algorithm
GA encodes the optimization function as arrays of bits to represent chromosomes, the manipulation operations of strings by genetic operators to find near-optimal solution to the problem concerned. This is done by the following procedure [6,24]:
1. Encoding the objectives or cost functions.
2. Defining a fitness function.
3. Creating a population of individuals (solutions) is called a generation.
4. Evaluating the fitness function of all the individuals in the population.
5. Creating a new population by performing crossover and mutation, fitness-proportionate reproduction, etc., and replacing the old population and iterating again using the new population.
6. Decoding the results to obtain the solution to the problem.
These steps can be represented as the block diagram of genetic algorithms shown in Figure 2 [24]. The pseudo-code is represented at appendix [6]. Genetic algorithms have three main genetic operators: crossover, mutation, and selection [6,24,25]:

Figure 2: The block diagram of genetic algorithms [24].
• Crossover: Swapping parts of the solution with another in chromosomes or solution representations. The main role is to provide mixing of the solutions and convergence in a subspace.
• Mutation: The change of parts of one solution randomly, which increases the diversity of the population and provides a mechanism for escaping from a local optimum.
• Selection of the fittest, or elitism: The use of the solutions with high fitness to pass on to next generations, which is often carried out in terms of some form of selection of the best solutions.
Simulated annealing (SA)
SA is one of the most popular and earliest optimization algorithms which is a random search technique for global optimization. It mimics the annealing process in materials processing when a metal cools and freezes into a crystalline state with the minimum energy and larger crystal sizes so as to reduce the defects in metallic structures. The annealing process involves the careful control of temperature and its cooling rate, often called the annealing schedule. The basic idea of the SA algorithm is to use random search in terms of a Markov chain, which not only accepts changes that improve the objective function but also keeps some changes that are not ideal. In a minimization problem, for example, any better moves or changes that decrease the value of the objective function f will be accepted [6].
In SA method, a temperature variable is kept to simulate the heating process and it is initialized to a high value. Then there are four basic phases: (1) Generation of a new candidate point, (2) Acceptance criterion, (3) Reduction of the Temperature and (4) Stopping criterion [14,15]:
(1) The generation of a new candidate point is one of its crucial phases and it should provide a good exploration of the search region as well as a feasible point.
(2) The acceptance criterion allows the SA algorithm to avoid getting stuck in local solutions when searching for a global one. For that matter, the process accepts points whenever an increase of the objective function is verified.
(3) During the iterative process, the temperature decreases slowly to zero. The control parameter, also known as temperature or cooling schedule, must be updated in order to define a positive decreasing sequence. As the algorithm develops, control parameter is slowly reduced and the algorithm computes better precision approximations to the optimum. For a good performance of the algorithm, the initial control parameter must be sufficiently high (to search for promising regions) but not extremely high because the algorithm becomes too slow.
(4) The stopping criteria for the SA are based on the idea that the algorithm should terminate when no further changes occur. The usual stopping criterion limits the number of function evaluations, or defines a lower limit for the value of the control parameter.
Figure 3 presents the block diagram of the SA algorithm and pseudo-code is shown in the appendix [15].

Figure 3: The block diagram of SA algorithm [15].
Pattern search (PS)
The PS optimization technique is suitable to solve a variety of optimization problems specially the problems outside the standard optimization methods’ scope. PS is flexible and very simple in concept, implement and very efficient at computation. PS algorithm depends on computing a sequence of points that may or may not be the optimal point. The algorithm begins by establishing a mesh points around the given point. This given point may be supplied by the user or computed from the previous step of the algorithm. If a point in the mesh improves the objective function, this new point will be the current point at the next iteration. The algorithm is presented the following [12,26]:
(1) PS starts at the initial point X0 which is given by the user. At the first iteration, with a scalar of magnitude 1 called mesh size, the direction vectors are constructed as [0 1], [1 0], [−1 0], and [0 −1]. Then the PS adds the direction vectors to the initial point X0 to compute the mesh points: X0 + [1 0], X0 + [0 1], X0 + [−1 0], and X0 + [0 −1] as shown in Figure 4. Then, the PS calculates the objective function at the each point in the mesh. Next, PS computes the objective function values until it finds one whose value is smaller than the objective function value of X0. At this point, the poll is successful and the algorithm sets this point equal to X1. Then, the PS go to iteration 2 and multiplies the current mesh size by 2. The mesh at iteration 2 contains the following points: X1+ 2*[1 0], X1+ 2*[0 1], X1+2*[-1 0] and X1+ 2*[0 -1]. The algorithm polls the mesh points until it finds one whose value is smaller than the objective function value of X1. This point is called X2, and the poll is successful. Next, the algorithm multiplies the current mesh size by 2 to get a mesh size of 4 at the third iteration, and so on.

Figure 4: PS Mesh points and Pattern.
(2) If in iteration 3 and none of the mesh points has a smaller objective function value than the value at X2, the poll is called an unsuccessful poll. The algorithm does not change the current point at the next iteration, and X3= X2. At the next iteration, the algorithm multiplies the current mesh size by 0.5, a contraction factor, so that the mesh size at the next iteration is smaller. The algorithm then polls with a smaller mesh size. The PS optimization algorithm will repeat the illustrated steps until it finds the optimal solution for the minimization of the objective function.
(3) The PS algorithm stops when any of the following conditions occurs:
o The mesh size is less than the mesh tolerance.
o The number of iterations performed by the algorithm reaches the value of maximum iteration number.
o The total number of objective function evaluations performed by the algorithm reaches the value of maximum function evaluations.
o The distance between the point found at one successful poll and the point found at the next successful poll is less than the specified tolerance.
o The change in the objective function from one successful poll to the next successful poll is less than the objective function tolerance.
The steps of the PS algorithm is presented as a block diagram in Figure 5. The pseudo-code of the PS is illustrated at the appendix [12,26].

Figure 5: The block diagram of PS algorithm [12,26].
Particle swarm optimization (PSO)
In PSO, each solution is a ‘bird’ in the flock and is referred to as a ‘particle’. A particle is analogous to a chromosome in GAs. The process in the PSO does not create new birds from parent ones. The birds in the population only evolve their social behavior and accordingly their movement towards a destination. PSO mimics a flock of birds that communicate together as they fly. Each bird looks in a specific direction, and then when communicating together, they identify the bird that is in the best location. Accordingly, each bird speeds towards the best bird using a velocity that depends on its current position. Each bird, then, investigates the search space from its new local position, and the process repeats until the flock reaches a desired destination. It is important to note that the process involves both social interaction and intelligence so that birds learn from their own experience (local search) and also from the experience of others around them (global search) [5,27].
The process is initialized with a group of random particles (solutions), N. The ith particle is represented by its position as a point in a S-dimensional space, where S is the number of variables. Throughout the process, each particle i monitors three values: its current position (Xi); the best position it reached in previous cycles (Pi); its flying velocity (Vi). These three values are: Current position ( Xi =(xi1; xi2;…; xis)), Best previous position (Pi =(pi1; pi2;…; piS)), and Flying velocity (Vi =(vi1; vi2;…; viS)). The velocity update equation is shown [5,27]:
Vi=W×Vi+C1×Rand×(Pbest−Xi)+C2×Rand×(Gbest−Xi) (1)
Where: Vi: Velocity of each particle, i: Number of particle, W: Inertia Weight, C1, C2: Learning constant, Rand: Random number between 0 and 1, Pbest: The optimum position of each particle up to now, Gbest: The optimum position of all particles up to now, and Xi: The present position of each particle. The position update equation of each particle point in particle swarm [5,27]:
New position Xi= current position Xi+ Vi (2)
Figure 6 presents the block diagram of the PSO and the pseudocode for the PSO is shown in Appendix [6,27].

Figure 6: The block diagram of PSO algorithm [27].
Bat algorithm (BA)
Most bats use echolocation to a certain degree; among all the species, microbats are a famous example because they use echolocation extensively, whereas megabats do not. Most microbats are insectivores. Microbats use a type of sonar, called echolocation, to detect prey, avoid obstacles, and locate their roosting crevices in the dark. These bats emit a very loud sound pulse and listen for the echo that bounces back from the surrounding objects. Their pulses vary in properties and can be correlated with their hunting strategies, depending on the species. Most bats use short, frequency-modulated signals to sweep through about an octave; others more often use constant-frequency signals for echolocation. Their signal bandwidth varies with species and often increases by using more harmonics. Studies show that microbats use the time delay from the emission and detection of the echo, the time difference between their two ears, and the loudness variations of the echoes to build up a three-dimensional scenario of the surrounding. They can detect the distance and orientation of the target, the type of prey, and even the moving speed of the prey, such as small insects [6,19,29].
If we idealize some of the echolocation characteristics of microbats, we can develop various bat-inspired or bat algorithms. For simplicity, we now use the following approximate or idealized rules [6,19,29]:
(1) All bats use echolocation to sense distance, and they also “know” the difference between food/prey and background barriers.
(2) Bats fly randomly with velocity vi at position xi. They can automatically adjust the frequency (or wavelength) of their emitted pulses and adjust the rate of pulse emission r ∈ [0, 1], depending on the proximity of their target.
(3) Although the loudness can vary in many ways, we assume that the loudness varies from a large (positive) A0 to a minimum value Amin.
Figure 7 presents the block diagram of the BA and the pseudo-code for the BA is shown in Appendix [6,28].

Figure 7: The block diagram of BA algorithm [28].
The proposed Algorithms
This paper discusses two proposed feature extraction algorithms for 3D MRI Alzheimer’s disease images [30,31]. These two proposed algorithms are discussed in next sub-sections.
The first proposed algorithm
The first proposed Algorithm steps illustrated in Figure 8, consists of six stages. These stages are summarized as following [30]:

Figure 8: The first proposed Alzheimer’s disease algorithm [30].
1. Preprocessing and Normalization for the input images.
2. 3D or 2D image to 1D vector conversion.
3. Proposed feature Reduction and Extraction method.
4. Applying different optimization techniques.
5. Cross-validation
6. Feature matching or Classification process using SVM.
Preprocessing and normalization: The MRI images must be first preprocessed and normalized by using Statistical Parametric Maps (SPM) [32] and Voxel based morphometric (VBM) [33]. VBM is preferable for large-scale MRI images which are normalized to the same space, then the gray matter are extracted from the normalized images. The dimensionality of the images before preprocessing was (176 × 208 × 176) pixels and after preprocessing and normalization steps, the dimensions of the images reduced to (121 × 145 × 121) pixels size.
Image to signal conversion: The 3D or 2D images converted to 1D vector using the mathematical reshape function [34] before applying the proposed feature selection, reduction and extraction steps.
Proposed feature extraction: After the previous step, number of features are equal to 2122945 pixels for each image of the 120 selected images when the images had been converted from 3D to 1D and the intensity level of each pixel had been used to differentiate among the pixels. This is very large dimensionality for each image for 3D images (2122945 pixels) which need very large memory size and high processing time. The proposed feature reduction method had been used to minimize this large dimensionality. This method based on removing the pixels have the same value in all images and keeping the other pixels. After this step, number of pixels at each 3D image reduced to 690432 pixels per image but this still very large dimensionality. Feature extraction step tries to reduce this dimensionality by extracting the most significant features and neglecting unnecessary features to increase the classifier performance. The proposed feature extraction algorithm is summarized in the following steps:
Step 1: Divide the subjects into two classes, the first class includes the images of demented (patient or positive) subjects and the other contains the images of nondemented (Normal or negative) subjects.
Step 2: Maximize class seperability, by calculating the mean of each class that μ1 is the mean of first class and μ2 is the mean of the second class.
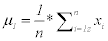 (3)
(3)
Where (n) is number of images in first class and xi represents each image in the first class. μ1 is repeated for each feature in the first class.
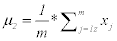 (4)
(4)
Where (m) is number of images in second class and xj represents each image in the second class. μ2 is repeated for each feature in the first class.
Step 3: Calculate standard deviation for each class
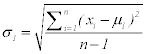 Where σ1, xi n and μ1 for the first class (5)
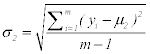 Where σ2, xj n and μ2 for the first class (6)
Step 4: Maximize the difference between the means of the two classes by making absolute difference between the means of each feature of the two classes and divide the result by the multiplication of the standard deviation of the each feature of the two classes.
 (7)
(7)
So, w is the maximum difference between the two classes, μ1 and μ2 are the means and σ1 and σ2 are the standard deviation of first and second class respectively.
Step 5: w is calculated in percent for each feature to understand how much information each feature has.
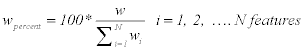 (8)
(8)
Where wpercent is calculated for each feature in all images, and wi is the summation of all features. Then, w is sorted in descending to sort the features that have high information in the first. Selecting the higher ordered features with higher information will give higher classifier performance with smaller number of features.
Cross Validation
The cross validation step is very important to validate the performance of a learning algorithm. Cross validation is used to rate the performance of the classifier by splitting the full dataset into a training set and a testing set. The classifier is trained using the training set, and then trained model is tested by the test set. K-fold cross-validation is one of the most common method which works by dividing the dataset into K equal size subsets. For each validation, K-1 folds are trained and the remaining fold is used for testing. The procedure will loop K times. At each iteration, a different subset will be chosen as the new testing set. This ensures all the samples will be including in the testing set one time at least. If K equal to the size of the training set, so at each validation run, just one sample will be left out, hence it is called the leave-one-out cross-validation (loocv) [35,36].
In the proposed algorithm, the database is about 120 samples and a cross-validation is done using 10-fold by randomly choosing, then training with 9 folds and test with the last one. This loop will be repeated 10 times. The results is shown in result section.
Support Vector Machine (SVM) Classification
Support Vector Machine is used as a classifier and it has gained in popularity in recent years because of its superior performance in practical applications, mostly in the field of bioinformatics. A two-class support vector machine (SVM) classifier aims to do a hyperplane which maximizes the distance between the closest points on either side of the boundary, this distance called the margin. These points are known as the support vectors, and their role in the construction of a maximummargin hyperplane [37].
The second proposed algorithm
The Third proposed algorithm indicated in Figure 9, consists of seven stages. These stages are summarized as following [31,38]:

Figure 9: The second proposed Alzheimer’s disease algorithm.
1. Preprocessing and Normalization for the input images.
2. 3D or 2D image to 1D signal conversion.
3. Proposed feature Reduction and Extraction method.
4. Apply MFCC feature extraction technique.
5. Applying different optimization techniques.
6. Cross-validation
7. Feature matching or Classification process using SVM.
The steps 1, 2, 3, 5, and 6 are discussed previously in the first proposed. Step 4 will be discussed.
Mel-frequency cepstral coefficients (MFCC)
MFCC’s are derived through cepstral analysis which used for extracting the significant features from the signal. MFCC features are also based on the human perception of frequency content, which emphasizes low frequency components more than high frequency components. The MFCC feature extraction steps can be summarized as follows [39-41]:
• Perform the Fourier transform of the signal with sampling rate equal to 11025 Hz.
• Map the powers of the spectrum using triangular overlapping windows.
• Apply the log of power at each of the Mel frequency.
• Perform DCT of the Mel log power just as a signal.
• The MFCC’s are amplitudes of resulting spectrum.
• Select the effective number of cepstral coefficients.
• Calculate the number of filters in filter bank.
Figure 10 depicts the block diagram steps of the MFCC process. Calculating the MFCC based on 1-D signal, so the input images must be first converted from 3-D to 1-D signal.

Figure 10: MFCC process of 1-D AD signal [38-41].
Performance Evaluation Metric Parameters
This section presents the metric parameters which will be used for measuring the performance of the classifier. To test the results the true positive, true negative, false positive and false negative which they are defined as [42,43]:
• True Positive (TP): positive (patient) samples correctly classified as positive (patient).
• False Positive (FP): negative (normal) samples incorrectly classified as positive (patient).
• True Negative (TN): negative (normal) samples correctly classified as negative (normal).
• False Negative (FN): positive (patient) samples incorrectly classified as negative (normal).
The metric parameters that will be used to measure the performance of the proposed algorithm are:
1- The Sensitivity (SEN): which is also named as (Recall) or True Positive Rate (TPR) defined as:
 (9)
(9)
2- The Specificity (SPE): which is also known as (True Negative Rate (TNR)) is defined as:
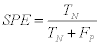 (10)
(10)
3- The Accuracy (ACC): which is defined as:
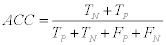 (11)
(11)
4- Matthews correlation coefficient (MCC): Which is calculate by:
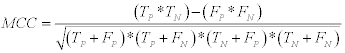 (12)
(12)
Experimental Results
This section presents the obtained results of the metric parameters used for measuring the performance of the first proposed algorithm given in [30] and the second proposed algorithm based on MFCC technique given in [31]. The obtained results depicts the variation of SEN, SPE. ACC, and MCC as a function of the number of extracted features.
Table 2 and Figure 11 present the obtained results for the metric parameters: Sensitivity (SEN), Specificity (SPE), Accuracy (ACC), and Matthews’s correlation coefficient (MCC) of the classifier for the first proposed algorithm given in [30]. The results indicate that the metric parameters reach to 100% at number of features equal to 2000 features. Table 3 and Figure 12 show the same metric parameters but for the second proposed algorithm based on MFCC technique. The obtained results show that the metric parameters give 100% with small number of features equal to 25 features.
| Metric Parameter | No. of Features | Metrics in Percentage | |||||||||
| 500 | 1000 | 1500 | 2000 | 2500 | 3000 | 3500 | 4000 | 4500 | 5000 | ||
| SEN | 78.4 % | 82.7 % | 91.3 % | 100 % | 100 % | 100 % | 100 % | 98.3 % | 92.6 % | 95.5 % | |
| SPE | 100 % | 100 % | 100 % | 100 % | 99.8 % | 100 % | 98.8 % | 100 % | 100 % | 100 % | |
| ACC | 87.3 % | 90.8 % | 95.8 % | 100 % | 99.2 % | 100 % | 99.2 % | 99.2 % | 95.8 % | 97.5 % | |
| MCC | 78.6 % | 83.6 % | 92.2 % | 100 % | 98.4 % | 100 % | 98.4 % | 98.5 % | 92.7 % | 95.6 % | |
Table 2: Sensitivity, Specificity, Accuracy, and MCC of the classifier for the first proposed algorithm given in [30].

Figure 11: Sensitivity, Specificity, Accuracy, and MCC of the classifier for the first proposed algorithm given in [30].
| Metric Parameter | No. of Features | Metrics in Percentage | |||||||||
| 5 | 10 | 15 | 20 | 25 | 30 | 35 | 40 | 45 | 50 | ||
| SEN | 97.1 % | 96.7 % | 98.3 % | 96.7 % | 100 % | 100 % | 100 % | 100 % | 100 % | 100 % | |
| SPE | 100 % | 97.5 % | 97.5 % | 100 % | 100 % | 98.8 % | 98.8 % | 98.8 % | 100 % | 97.5 % | |
| ACC | 98.3 % | 96.7 % | 97.6 % | 98.3 % | 100 % | 99.2 % | 99.2 % | 99.2 % | 100 % | 98.3 % | |
| MCC | 97.1 % | 93.6 % | 95.3 % | 96.9 % | 100 % | 98.4 % | 98.4 % | 98.4 % | 100 % | 96.7 % | |
Table 3: Sensitivity, Specificity, Accuracy, and MCC of the classifier for the second proposed algorithm given in [31,38].

Figure 12: Sensitivity, Specificity, Accuracy, and MCC of the classifier for the second proposed algorithm given in [31].
The problem here is number of trials for different number of features to reach to small number of features which give high metric parameters. So, the need of using different optimization techniques to get near-optimal number of features with small time without need to several trials.
A comparison study had been done among the five optimization techniques to get near-optimal number of features with small number of iterations. This comparison study had been done for both the first and the second proposed algorithms as presented in Tables 4 and 5.
| Algorithm | metrics | ACC | SEN | SPE | MCC | ||||||||
|---|---|---|---|---|---|---|---|---|---|---|---|---|---|
| The % | No .of features | No.ofItra. | The % | No. of features | No.ofItra. | The % | No. of features | No.ofItra. | The % | No. of features | No.ofItra. | ||
| Particle Swarm Optimization | 92.6 % | 10000 | 20 | 94.3 % | 1000 | 20 | 96.2 % | 10000 | 20 | 85.5 % | 10000 | 20 | |
| Bat Algorithm | 93.3 % | 3271 | 20 | 96.2 % | 7212 | 20 | 95.2 % | 5300 | 20 | 85.5 % | 10854 | 20 | |
| Genetic Algorithm | 100 % | 1976 | 51 | 100 % | 6699 | 51 | 100 % | 7084 | 51 | 100 % | 7270 | 51 | |
| Pattern Search | 100 % | 3785 | 28 | 100 % | 3785 | 28 | 100 % | 7369 | 28 | 100 % | 2249 | 24 | |
| Simulated Annealing | 85.7 % | 267 | 1046 | 89.8 % | 873 | 1599 | 88.7 % | 738 | 786 | 88.6 % | 658 | 992 | |
Table 4: Comparison study among the five optimization techniques with the first proposed algorithm.
| Algorithm | metrics | ACC | SEN | SPE | MCC | ||||||||
|---|---|---|---|---|---|---|---|---|---|---|---|---|---|
| The % | No .of features | No.ofItra. | The % | No. of features | No.ofItra. | The % | No. of features | No.ofItra. | The % | No. of features | No.ofItra. | ||
| Particle Swarm Optimization | 99.2 % | 1145 | 20 | 100 % | 1182 | 20 | 100 % | 731 | 20 | 100 % | 1183 | 20 | |
| Bat Algorithm | 99 % | 414 | 20 | 100 % | 345 | 20 | 100 % | 169 | 20 | 98 % | 281 | 20 | |
| Genetic Algorithm | 99.2 % | 985 | 51 | 100 % | 672 | 51 | 100% | 1 | 51 | 100 % | 23 | 51 | |
| Pattern Search | 100 % | 42 | 28 | 100 % | 66 | 24 | 100 % | 1 | 20 | 100 % | 26 | 28 | |
| Simulated Annealing | 100% | 24 | 504 | 100 % | 91 | 502 | 100 % | 1 | 500 | 100 % | 32 | 515 | |
Table 5: Comparison study among the five optimization techniques with the second proposed algorithm.
Tables 4 and 5 present a comparison study among the five optimization techniques for both the first and the second proposed algorithms respectively. For the first proposed algorithm and Table 4, the accuracy (ACC) reached to 100% at two techniques:
1. Genetic Algorithm with number of features equal to 1976 features and number of iterations equal to 51 iterations.
2. Pattern Search Algorithm with number of features equal to 3785 features and number of iterations equal to 28 iterations.
The sensitivity (SEN) reached to 100% at two techniques:
1. Genetic Algorithm with number of features equal to 6699 features and number of iterations equal to 51 iterations.
2. Pattern Search Algorithm with number of features equal to 3785 features and number of iterations equal to 28 iterations.
The specificity (SPE) reached to 100% at two techniques:
1. Genetic Algorithm with number of features equal to 7084 features and number of iterations equal to 51 iterations.
2. Pattern Search Algorithm with number of features equal to 7369 features and number of iterations equal to 28 iterations.
The Matthews’s correlation coefficient (MCC) reached to 100% at two techniques:
1. Genetic Algorithm with number of features equal to 7270 features and number of iterations equal to 51 iterations.
2. Pattern Search Algorithm with number of features equal to 2249 features and number of iterations equal to 24 iterations.
For the second proposed algorithm and Table 5, the accuracy (ACC) reached to 100% at two techniques:
1. Pattern Search Algorithm with number of features equal to 42 features and number of iterations equal to 28 iterations.
2. Genetic Algorithm with number of features equal to 24 features and number of iterations equal to 504 iterations.
The sensitivity (SEN) reached to 100% at all five optimization techniques and the best technique is the Pattern Search Algorithm which has small number of features equal to 66 features and small number of iterations equal to 24 iterations.
The specificity (SPE) reached to 100% at all five optimization techniques and the best technique is the Pattern Search Algorithm which has small number of features equal to 1 feature and small number of iterations equal to 20 iterations.
The Matthews’s correlation coefficient (MCC) reached to 100% at all five optimization techniques and the best technique is the Pattern Search Algorithm which has small number of features equal to 26 feature and small number of iterations equal to 28 iterations.
Result and Discussion
The obtained results given in Tables 2 and 3 and presented in Figures 11 and 12. It is noted that after several trials on different number of features for both the first and the second proposed algorithms, the metric parameters reached to 100% for the first proposed algorithm with number of extracted features equal to 2000 features. Also, the metric parameters reached to 100% for the second proposed algorithm with number of extracted features equal to 25 features. These results are reached after several trials with different number of features to reach to high metric parameters with small number of features. Five optimization techniques had been applied on both the first and the second proposed algorithm to reach to near-optimal number of features without the need to several trials. Tables 4 and 5 present the comparison study among the five optimization techniques for the first and the second proposed algorithms respectively. it is noted that, Pattern Search optimization technique gives small number of features and small number of iterations with high metric parameters values (100%) as compared to the other four optimization techniques for both the first and the second proposed algorithms.
Conclusion
This paper compares among five important optimization techniques: Genetic Algorithm, Simulated Annealing, Pattern Search, Particle Swarm Optimization, and Bat Algorithm. These five algorithms had been applied for two proposed Alzheimer’s disease feature extraction algorithms to get near-optimal number of features and small number of iterations with high metric parameters values. Pattern search optimization technique gives high metric parameters values (100%) with small number of features and small number of iterations as compared with the other four optimization techniques. Thus, the pattern search has more merits than the other optimization algorithms.
References
- Alzheimer’s Association (2015) 2015 Alzheimer's disease facts and figures. Alzheimers Dement 11: 332-384.
- Wimo A, Prince M (2010) World Alzheimer Report 2010: The global economic impact of dementia.
- Padilla P, Lopez M, Gorriz J, Ramirez J, Salas-Gonzalez D, et al. (2012)NMF-SVM Based CAD Tool Applied to Functional Brain Images for the Diagnosis of Alzheimer’s Disease.IEEE Trans Med Imaging 31: 207-216.
- Martinez-Murcia FJ, Gorriz JM, Ramirez J, Puntonet CG, Salas-Gonzalez (2012) Computer Aided Diagnosis tool for Alzheimer’s Disease based on Mann–Whitney–Wilcoxon U-Test. Expert Systems with Applications 39: 9676-9685.
- Elbeltagi E, Hegazy T, Grierson D (2005) Comparison among five evolutionary-based optimization algorithms. Advanced Engineering Informatics 19: 43-53.
- Xin-She Yang (2014) Nature-Inspired Optimization Algorithms. Elsevier.
- Holland J (1975) Adaptation in natural and artificial systems. University of Michigan Press, Ann Arbor, MI, USA.
- Tabassum M, Mathew K (2014) A Genetic Algorithm Analysis towards Optimization solutions. International Journal of Digital Information and Wireless Communications (IJDIWC) 4: 124-142.
- Snyers D, Petillot Y (1995) Image processing optimization by genetic algorithm with a new coding scheme. Pattern Recognition letters16: 843-848.
- Hooke R, Jeeves TA (1961) Direct search solution of numerical and statistical problems. Journal of the Association of Computing Machinery 8: 212-229.
- Lewis RM, Torczon V, Trosset MW (2000) Direct search methods: then and now. Journal of Computational and Applied Mathematics 124: 191-207.
- Al-Sumait JS, AL-Othman AK, Sykulski JK (2007) Application of pattern search method to power system valve-point economic load dispatch. Electrical Power and Energy Systems 29: 720-730.
- Kirkpatrick S, Gelatt CD Jr, Vecchi MP (1983) Optimization by simulated annealing. Science 220: 671-680.
- Pereira A, Fernandes E (2005) A new algorithm to identify all global maximizers based on simulated annealing. 6th World Congresses of Structural and Multidisciplinary Optimization. Rio de Janeiro, 30 May - 03 June 2005, Brazil, pp: 1-10.
- Dhingra A, Paul S (2015) Green Cloud: Smart Resource Allocation and Optimization using Simulated Annealing Technique. Indian Journal of Computer Science and Engineering (IJCSE) 5: 41-49.
- Eberhart RC, Kennedy J (1995) A new optimizer using particle swarm theory. In Proceedings of the Sixth International Symposium on Micro Machine and Human Science. Nagoya, Japan.
- Al-Tai Z, Al-Hameed O (2013) Comparison between PSO and Firefly Algorithms in Fingerprint Authentication. International Journal of Engineering and Innovative Technology (IJEIT) 3:412-425.
- Abido MA (2002) optimal power flow using particle swarm optimization. Electrical power and Energy Systems 24: 563-571.
- Xin-She Yang (2010) A New Metaheuristic Bat-Inspired Algorithm. Nature Inspired Cooperative Strategies for Optimization (NICSO) 284: 65-74.
- UlKabir W, Sakib N, Mustafizur S, Chowdhury R, Alam M (2014) A Novel Adaptive Bat Algorithm to Control Explorations and Exploitations for Continuous Optimization Problems. International Journal of Computer Applications 94: 15-20.
- Baziar A, Kavoosi-Fard A, Zare J (2013) A Novel Self Adaptive Modification Approach Based on Bat Algorithm for Optimal Management of Renewable MG. Journal of Intelligent Learning Systems and Applications 5: 11-18.
- OASIS Database.
- Marcus D, Wang T, Parker J, Csernansky J, Morris J, et al. (2007) Open access series of imaging studies (OASIS): cross-sectional MRI data in young, middle aged, nondemented, and demented older adults.J CognNeurosci 19: 1498-1507.
- Al-Asasfeh A, Hamdan N, Abo-Hammour Z (2013) Flight Control Laws Verification Using Continuous Genetic Algorithms. ISRN Robotics 496457.
- Merino A, Bonilla J, Miranda R (2005) Optimization Method based on Genetic Algorithms. Apeiron 12: 393-408.
- Narayanan M, Siva S, Velmurugan D (2014) A Direct Search Method to solve Economic Dispatch Problem with Valve-Point Effect. IOSR Journal of Electrical and Electronics Engineering (IOSR-JEEE) 9: 36-42.
- Yau HT1, Hung TH, Hsieh CC (2012) Bluetooth based chaos synchronization using particle swarm optimization and its applications to image encryption. See comment in PubMed Commons below Sensors (Basel) 12: 7468-7484.
- Latif A, Palensky P (2014) Economic Dispatch Using Modified Bat Algorithm. Algorithms 7: 328-338.
- Yang SX, Gandomi A (2012) Bat algorithm: a novel approach for global engineering optimization. International Journal for Computer-Aided Engineering and Software 29: 464-483.
- Dessouky MM, Elrashidy MA, Taha TE, Abdelkader HM (2013) Selecting and Extracting Effective Features for Automated Diagnosis of Alzheimer’s Disease. International Journal of Computer Applications 81: 17-28.
- Dessouky MM, Elrashidy MA, Taha TE, Abdelkader HM (2014) Computer Aided Diagnosis System Feature Extraction of Alzheimer Disease using MFCC. International Journal of Intelligent Computing in Medical Sciences and Image Processing 6: 65-78.
- http://www.fil.ion.ucl.ac.uk/spm/
- http://dbm.neuro.uni-jena.de/vbm/
- MATLAB Reshape Function.
- Chia-Yueh C (2009) CHU, Pattern recognition and machine learning for magnetic resonance images with kernel methods. Thesis submitted for the degree of Doctor of Philosophy, University College London.
- PayamRefaeilzadeh, Lei Tang and Huan Liu (2009) Cross Validation. In Encyclopedia of Database Systems. Springer.
- Burges (1998) A Tutorial on Support Vector Machines for Pattern Recognition. Data Mining and Knowledge Discovery 2: 121-167.
- Dessouky MM, Elrashidy MA, Taha TE, Abdelkader HM (2015) Computer Aided Diagnosis System for Alzheimer’s disease Using Different Discrete Transform Techniques.Am J Alzheimers Dis Other Demen.
- Tawfik N, Eldin M, Dessouky M, AbdEl-samie F (2013) processing of Corneal Images with a Cepstral Approach. The 23rd international conference on Computer Theory and Applications (ICCTA 2013), Alex, Egypt.
- Ittichaichareon C, Suksri S, Yingthawornsuk T (2012) Speech Recognition using MFCC. International Conference on Computer Graphics, Simulation and Modeling (ICGSM'2012) Pattaya.
- Zhao H, Zhao K, Liu H (2012) Improved MFCC Feature Extraction Combining Symmetric ICA Algorithm for Robust Speech Recognition.Journal of multimedia 7: 74-81.
- Okeh U, Okoro C (2012) Evaluating Measures of Indicators of Diagnostic Test Performance: Fundamental Meanings and Formulars. Journal of Biometrics Biostatistics 3: 1-10.
- Bekkar M, Djemaa H, Alitouche T (2013) Evaluation Measures for Models Assessment over Imbalanced Data Sets. Journal of Information Engineering and Applications 3: 27-38.
Relevant Topics
- Advanced Parkinson Treatment
- Advances in Alzheimers Therapy
- Alzheimers Medicine
- Alzheimers Products & Market Analysis
- Alzheimers Symptoms
- Degenerative Disorders
- Diagnostic Alzheimer
- Parkinson
- Parkinsonism Diagnosis
- Parkinsonism Gene Therapy
- Parkinsonism Stages and Treatment
- Stem cell Treatment Parkinson
Recommended Journals
Article Tools
Article Usage
- Total views: 13992
- [From(publication date):
April-2016 - Apr 02, 2025] - Breakdown by view type
- HTML page views : 12833
- PDF downloads : 1159