Exploding Stars Produce Polynyas
Received: 03-May-2019 / Accepted Date: 07-Jun-2019 / Published Date: 15-Jun-2019
Abstract
Polynyas are caused by shallow ocean areas and extra energy from exploding stars. There is a correlation between exploding star debris stream year of impact and the beginning of a polynya and the longitude location will agree with a maximum energy longitude of an exploding star. The CAM date will specify the month and day of the year the polynya receives the most energy. Current researchers are troubled by the amount of energy per square meter necessary to produce open water for polynyas. The SNIT theory has focused positive ions penetrating layers of low density material to input large amounts of energy in the bedrock of ocean floors under the polynyas solving the energy requirement.
Keywords: Global warming; Supernova; Maud rise; Antarctica; Polynya; Arctica
Introduction
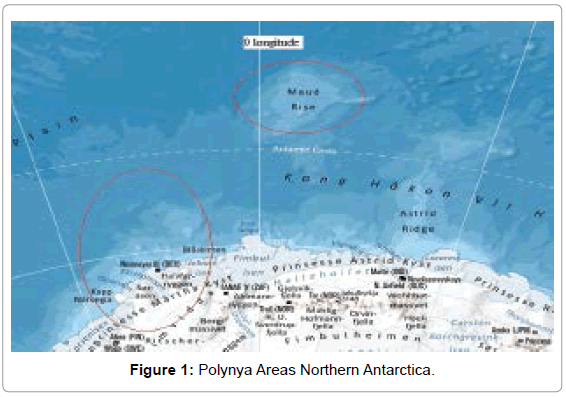
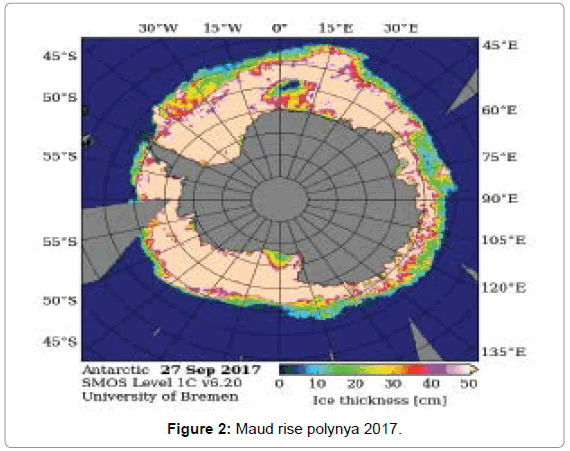
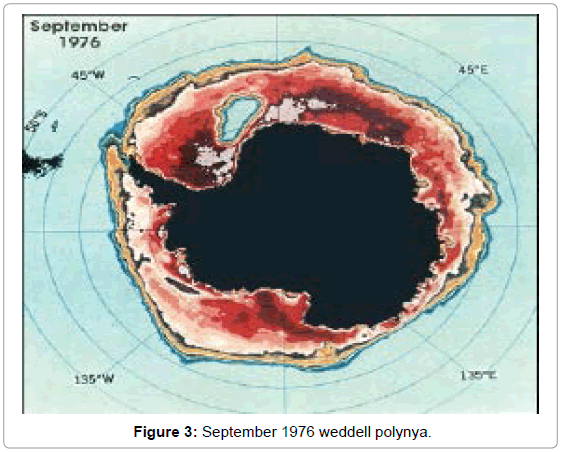
The controversy concerning polynyas and their causes is definitely connected to shallow areas of an ocean. Figure 1 shows two shallow areas circled in red and Figures 2 and 3 show polynyas that was visible near 27 September 2017 at the Maud Rise and September 1976 near Neumayer, Antarctica called the Weddell Polynya in this work, respectively. Both polynyas are surrounded by sea ice.
Methods of Analysis
There are two types of polynyas. One is produced by stormy winds whose breakup and displacement of ice does not require thermal energy to melt the ice as described by today’s polynya experts, called wind polynyas. The other type polynya is described in this work by matching the longitudinal location and day of the year of formation to values in Table 1. The main feature that describes a polynya formed by an exploding star debris stream is its large size and round dimensions as seen in the figures. The exploding star polynya requires a large amount of heat energy from the debris stream and is described as a thermal polynya.
| Remnant | Impact Year | WT/ET | CAM dates | Longitude |
|---|---|---|---|---|
| SN 1006 | 2012 | WT | May-02 | 13W Yellow |
| SN 1054 | 2005 | DA | Jan 16, Aug 15 | 92E |
| ET | Nov-02 | 167E | ||
| WT | Dec-12 | 155W Blue | ||
| DA | Mar 25, Aug 26 | 50W | ||
| ET | Jun-12 | 25E | ||
| WZ Sagittae | 1933, 1978, 1998, 2018 | WT | Jul-20 | 65E Red |
| DA | April 5, Nov 2 | 170E | ||
| ET | Jan-20 | 115W | ||
| V606 Aquilae | 1989 | WT | Jul-09 | 52E White |
| DA | Mar 24, Oct 22 | 53W | ||
| ET | Jan-08 | 128W | ||
| V603 Aquilae | 2015 | WT | Jul-02 | 44E Green |
| DA | Mar 17, Oct 14 | 149E | ||
| ET | Dec-31 | 136W | ||
| SS Cygni | WT | Aug-13 | 88E Orange | |
| DA | April 29, Nov 26 | 17W | ||
| ET | Feb-13 | 92W | ||
| SN Veil Nebula | WT | Jul-30 | 73E Pink | |
| DA | May 15, Oct 12 | 2W | ||
| ET | Jan-30 | 107W | ||
| SU Draconis | WT | Mar-14 | 64W Black & Brown | |
| DA | June 27, November 27 | 41E Black Ring & Brown Line | ||
| ET | Sep-13 | 116E Black & Brown | ||
| CK Vulpeculae | WT | Jul-16 | 60E Grey | |
| DA | Mar 31, Oct 29 | 45W | ||
| ET | Jan-15 | 120W | ||
| Variation | Tolerance ± 5% | Deflection (q/M) | ||
| Bulge | Circular area |
Table 1. Exploding stars earth data.
Table 1 was algebraically derived by knowing the right ascension of the exploding star and realizing it takes years for the debris of the explosion to reach Earth. The reviewer must read the modeling part of the problem in reference 3 to understand the values in Table 1. The North Waters polynya is a thermal wonder of the World as is the Nares Strait polynya and both are discussed in another work.
When the polynya is large, requires a large amount of heat for initially melting and to keep from refreezing, and matches the longitude location and month of the year for a maximum energy zone from an exploding star, the polynya is called a thermal polynya. Incoming debris streams of exploding stars are strongest at impact, but they reoccur at the same longitude and month annually, but due to variation in strength do not always produce the same results. The repeat of longitude and month for the thermal polynya occur because the earth is in the same relative position in its orbit with respect to the remnant of the exploding star each year. The incoming debris stream is divided into three different tines, northern, central and southern. The northern and southern tines cause thermal polynyas in the northern and southern hemisphere, respectively. The division of the incoming energy stream into tines happens because of the reaction of the positive particles of the stream with the Earth’s magnetic field.
Results and Discussion
The fact of shallow water provides the energy deposited in the bedrock of the ocean floor a shorter path to the surface to melt the ice and more energy to the surface to keep the polynya open. An excellent paper titled Maud Rise revisited by R. D. Muench, et alle explains why warn water bottom current is displaced upward in a column or chimney over shallow ocean areas. Since the current around Antarctica is circumpolar, the upward columns are always present over shallow areas; but in their normal state they do not cause polynyas because not enough upward energy is transported from the warm currents of the deep water to melt the ice. A huge amount of energy is required to form polynyas of the size shown in Figures 2 and 3. The largest surface power quoted was 600 Giga Watts (300 W/m2) necessary to support the open area measured by satellite for the Maud Rise Polynya [1]. That is a large amount of energy, but the source proposed is able to provide this amount of power and more.
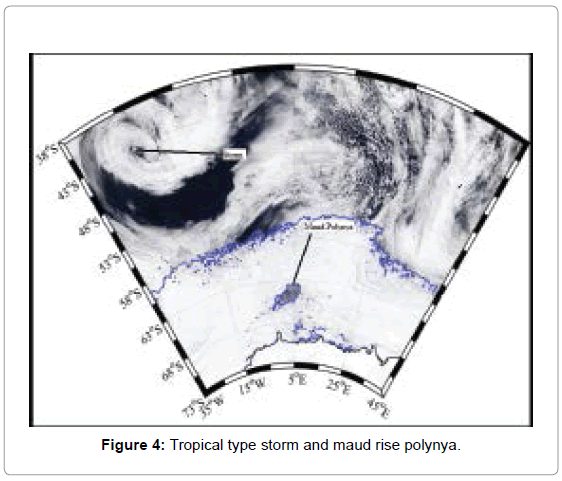
The SNIT theory states our planet is being impacted by exploding star debris streams that are focused at particular areas. The debris streams are composed of particles that move at near light velocity and are positively charged, so when they enter earth’s magnetic field they revolve in a spiral and cause strong hurricane like storms. When the particles hit the material composing our planet, they penetrate material of lesser density like air, ice, and water to deposit a significant portion of their energy in the bedrock of the ocean floor or the rock of a seamount in the case of the Maud Rise Polynya. This is the major reason glaciers that increase in velocity melt from the bottom [2]. In our example of the Maud Polynya, the energy is added to the warm deep water and comes to the surface from the shallow areas in a preexisting column to melt the ice and form a polynya. The area of ice to melt first should be directly over the seamount whose peak is 1700 m beneath the surface. The Maud Polynya shown in Figure 2 was formed by the deflection area, DA, of SN1054 that produced a storm over the polynya area near August 26 shown in Figure 4.
The polynya producing storms recognized by other researchers always bring warm air, but the warm air cannot produce the power necessary to form and sustain a polynya whose energy is rising from the bottom of the ocean.
All the data in Table 1 comes through simple calculations from distance, age, and right ascension of the exploding star [3]. The right ascension is the only input necessary to calculate the CAM date and longitudinal locations of the eastern terminus, ET; western terminus, WT; and deflection area, DA, for a particular stellar remnant.
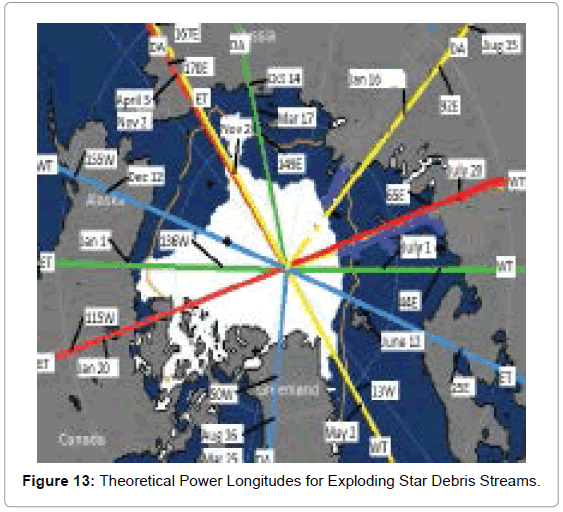
Table 1 gives theoretical values for longitude locations for maximum input energy for the exploding star debris stream. The incoming particles have a positive charge producing motion affected by Earth’s magnetic field and the theoretical value must be shifted 50 degrees to the east at the South Pole region and 30 degrees to the west at the North Pole region to find the real surface location.
Acting heat fluxes
There are two dominate thermal fluxes acting on the ice surface when a polynya is formed. The flux provided by the incoming stream of exploding star debris, SQ, and the heat flux from or to outer space and the atmosphere, RQ. RQ can be positive as heat flux into the ice surface from the sun or atmosphere or negative as radiation to outer space or heat flux lost to the atmosphere. When the polar region is producing more ice RQ is negative and inhibits the forming of a polynya. The SQ can be larger than RQ and ice may be thinning due to loss of latent heat by melting from the bottom, but open water may not appear until a later date. Ice thinning from the bottom normally occurs during the freezing season.
Maud rise poylnya example problem
An example: the real location of the Maud Rise Polynya in Figure 2 is near 0W longitude shifting it 50 degrees West to the theoretical value gives the location of 50W longitude. The DA line of SN1054 has a longitudinal value of 50 W and a CAM date of August 26 specifying this debris stream as the agent providing the energy. The storm in Figure 4 also appears at the correct time as a bonus.
Now consider the pulsating variable star SU Draconis with a right ascension of 11.63 hours. This value of right ascension gives an ET CAM date of September 13 (Table 1). The WT CAM date is on the opposite side of Earth’s orbit at March 14. When the theoretical value of 64W longitude for the WT of SU Draconis is shifted 50 degrees east, 14W longitude is the real location for the Weddell Polynya of September 1976 shown in Figure 3. The exact time of the poylnya’s appearance is not known but this is the case where the debris stream causes ice thinning and deposits energy under the ice February thru April of 1976 and open water is not seen until some where before August 27. The understanding comes by realizing the energy input went through the ice at the beginning of Antarctica’s freezing season and the negative RQ is increasing, but the melt occurs near the Antarctica melting season changing the value of RQ to positive causing the open water to appear sooner than the surrounding ice at the location where ice thinning occurred (a month before and a month after the March CAM date) as shown in Figure 3.
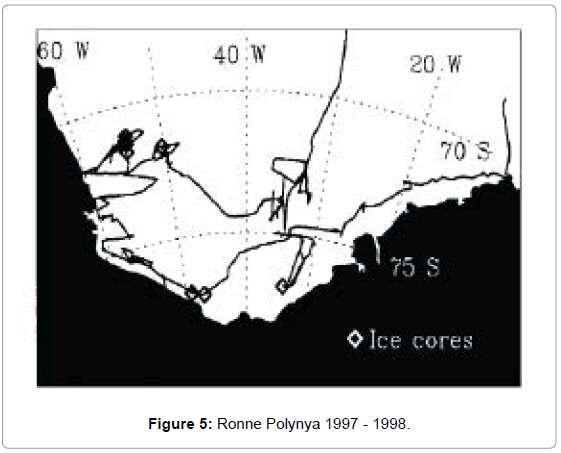
Two ronne polynyas: The Ronne Polynya is another excellent example of a polynya formed by an exploding star debris stream. Figure 5 shows the ship tract of HMS Endurance January to February 1998. This region had never been charted before because this was the first time a ship encountered open water in the region.
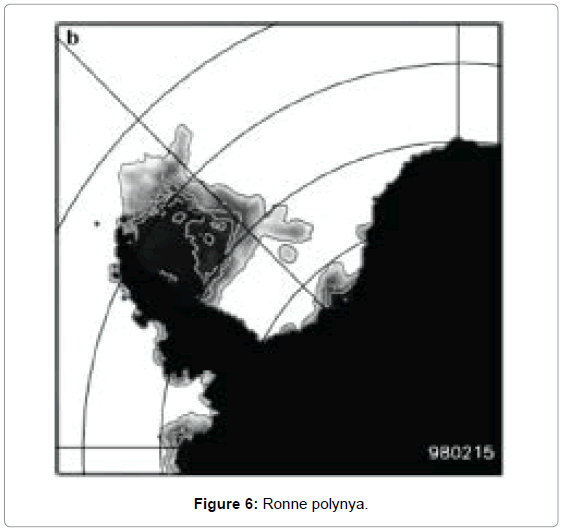
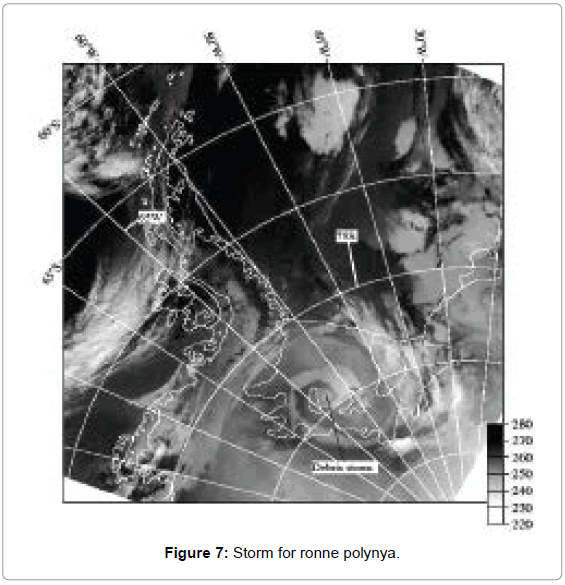
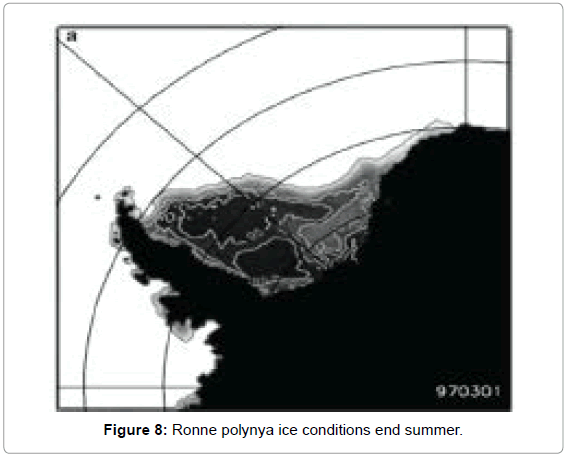
Figure 6 shows the polynya of clear water February 15, 1998 and Figure 7 shows the location of the storm bringing the energy at the real longitude location near 65W longitude. Shifting the real location 50 degrees west gives 115W longitude. The ET 115W longitude line of Table 1 gives WZ Sagittae as the exploding star and the CAM date is January 20. This is the melting season for Antarctica and there is no delay for the production of open water. For comparison Figure 8 shows the normal ice area of the Ronne ice sheet at the end of summer.
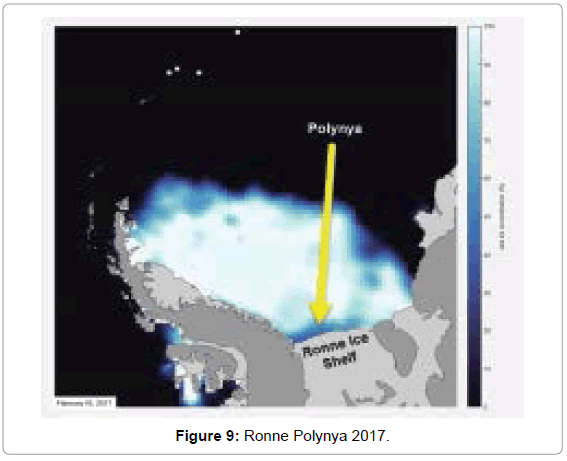
Since the hotspot of WZ Sagittae is an ET and covers a large area, melts may begin before January 20 which theoretically is the center of the hotspot area that moves a longitude degree per day shown in Figure 9.
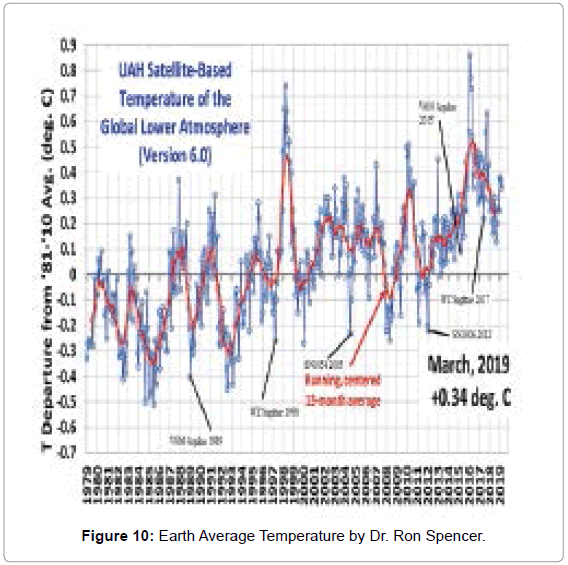
The Ronne Polynya reopened in 2017 to an area of 27,000 km2 . The location and the time of year is the same ergo the source is the same, WZ Sagittae. WZ Sagittae, a recurrent nova, produced a new impact on our planet in 2017 as shown in Figure 10. This debris stream came from the visible outburst of year 2001. Since the area of the 2017 polynya is much smaller than the 1979 polynya, it should be expected the change of the Earth’s average temperature will be smaller in 2017 than it was in 1979. This is seen to be very true in Figure 10.
Figure 10 shows Earth’s average temperature calculated by Dr. Spencer. By simple science, larger polynyas should form during rising average temperature because debris stream incoming energy is maximized at that time. 1976, 1997 and 2017 are the years for the Weddell, Ronne, and Maud Rise Polynyas, respectively. The Weddell and Ronne Polynyas occurred near the time of the initial impact of the energy source and produce a large open water area due to the maximum strength of the debris stream occurring near initial impact. The Maud Rise Polynya appears 12 years after SN1054 impacts our planet and the energy source is not as strong therefore the polynya area is smaller.
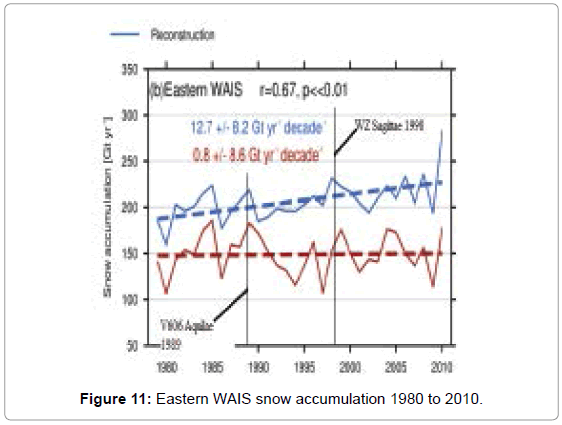
Snow accumulation Antarctica: An article accepted for publication by the American Geophysical Union in 2019 written by Elizabeth R. Thomas, et alle titled, A new 200‐year spatial reconstruction of West Antarctic surface mass balance, shows the snow accumulation for a region near the Ronne Polynya shown in Figure 11.
Two decreases in snow accumulation occur due to the impacts of novae V606 Aquilae and WZ Sagittae in the years of 1989 and 1998, respectively. Following the reconstruction presents the idea WZ Sagittae 1998 delivers more energy than V606 Aquilae 1989 because the years of reduction of snow accumulation is one for V606 Aquilae 1989 and four for WZ Sagittae 1998. These observations agree with the average temperature curve of Figure 10.
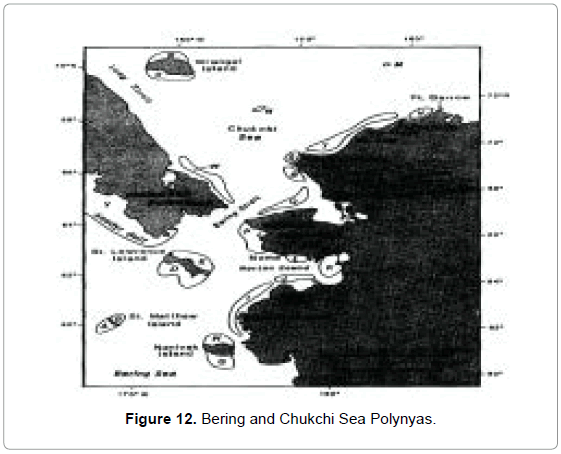
Arctic polynyas: The paper Winter Water Properties and the Chukchi Polynya shows a study area of the northern portion of the polynya and two specific events, 3 and 5 [4]. The location of the Chukchi Polynya is shown in Figure 12 as the area designated as T on the north shore of Alaska [5]. Event 3 starts on January 2, 2011 and event 5 begins January 19, 2014. Two exploding stars with CAM dates and maximum energy theoretical locations that fit the data are WZ Sagittae January 20 115W and SN1054 Dec 12 155W, Figure 13. The real locations for the hotspots require a shift of the theoretical locations 30 degrees west to WZ Sagittae 145W Jan 20 and SN1054 185W Dec 12. The actual longitude location of the polynyas for events 3 and 5 is 156W longitude. Using the one longitude degree per day rule for the motion of the SN1054 hotspot must travels east, Figure 13, 29 days to Jan 10 to reach 156W. If the bulge of the hotspot was 8 degrees, the hotspot would reach the polynya area 8 days sooner or Jan 2 as required for event 3. The WZ Sagittae case must have the hotspot spanning 11 degrees west, Figure 13, to match the target longitude value and use 1 day before touching the terminus and allow a 5 degree bulge matches the target area on January 19 which is the required date for event 5.
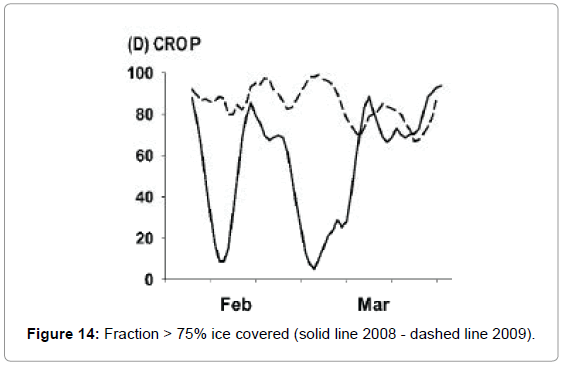
Cape romanzof polynya: The Cape Romanzof Polynya responds to the incoming heat of the debris streams in the same way the Bering Sea ice responses shown in Figure 14 [6].
CROP stands for Cape Romanzof Polynya. The sea ice of 2008 decreases beginning January 1 and recovers February 1. February 10 sees another large decrease and CROP’s longitude location is 166W. Rotating the ET and WT of the red and blue lines of Figure 13 gives the locations of 145W and 185W for WZ Sagittae and SN1054, respectively. Twenty days before the CAM date of January 20 gives the location of 166W on January 1 for the WZ Sagittae hotspot. Twenty days after the185W location for the SN1054 gives the location of the SN1054 hotspot as 165W ON January 1, a double hotspot occurrence and the sea ice fraction will decrease. On January 20, the hotspot for WZ Sagittae will reverse direction at location 145W and in 20 days will be at 165W on February 9 and again the sea ice fraction in the CROP will decrease [7, 8].
Conclusion
The incoming energy flux of 600 W/m2 is the first time a value has been assigned to a debris stream’s incoming power. Other researchers have difficulty trying to justify this rate of energy coming from deep water or storms. The energy may warm the atmosphere but it does little to warm the Earth because it was taken from the atmosphere before it was in the deep waters of the ocean. SNIT theory uses new incoming energy from exploding star debris streams to form the polynyas and as a result warms the planet. The new incoming energy from the stars when accounted for in the thermal balance equations may replace to concept of retained heat by greenhouse gases.
There are many polynyas that have not been discussed and many more exploding stars than are in Table 1. The SNIT theory is a new idea and reams of papers will be written from the future research of this area.
If the incoming energy flux from an exploding star was extremely large, it may be possible to destroy the society of the USA in 2083. The incoming energy flux of 600 W/m2 could be very destructive to the human body and cause heat stroke in an Indian heat wave or destroy Siaga antelope in Asia. The problems of India and Asia are caused by the central tine of an incoming debris stream and the delivered energy is produced by larger particles than those of the polar tines. Hopefully we will learn to defend against this phenomenon before 2083 arrives.
References
- Sokeland WP (2019) Weeping Antarctic Glaciers. J Geogr Nat Disast 9: 1-4.
- Sokeland WP (2017) Supernova and Nova Explosion’s Space Weather: Correlated Megafauna Extinctions, Antarctica Ice Melts and Biosphere Mega-disturbances - Global Warming. J Earth Sci Engg 7 (2017) 136-153.
- Ladd C, Mordy CW, Salo SA, Stabeno PJ (2016) Winter Water Properties and the Chukchi Polynya. J Geophys Res Oceans 121: 5516-5534.
- Stringer WJ, Groves JE (1991) Location and Areal Extent of Polynyas in the Bering and Chukchi Seas. JSTOR 44: 164-171.
- Petersen MR, Douglas DC, Wilson HM, McCloskey SE (2012) Effects of Sea Ice on Winter Site Fidelity of Pacific Common Eiders (Somateria mollissima v-nigrum). The Auk 129: 399-408.
- Kumar MRR, Sadhuram Y (1989) Surface heat budget of a polynya in the coastal waters off Queen Maud Land, Antarctica, during austral summer. Cont Shelf Res 9: 1063-1070.
Citation: Sokeland WP (2019) Exploding Stars Produce Polynyas. J Earth Sci Clim Change 10:520.
Copyright: © 2019 Sokeland WP. This is an open-access article distributed under the terms of the Creative Commons Attribution License, which permits unrestricted use, distribution, and reproduction in any medium, provided the original author and source are credited.
Share This Article
Recommended Journals
Open Access Journals
Article Usage
- Total views: 3121
- [From(publication date): 0-2019 - Apr 27, 2025]
- Breakdown by view type
- HTML page views: 2340
- PDF downloads: 781

