Research Article Open Access
Explaining Climate Variability Vis-A-Vis Spatio-Temporal Interactions in Bangladeshi Exclusive Economic Zone (BEEZ)
Nidhi Nagabhatla1,2,3*, Sobhan Kumar Sahu2, Altaf Arain M3,4, Mahfuzul Haque ABM5 and Abhijit Mitra6
1United Nations University, Institute for Water Environment and Health (UNU-INWEH), ON, L8P 0A1, Canada
2APEC Climate Center, Busan, South Korea
3School of Geography and Earth Sciences, McMaster University, ON, L8S 4K1, Canada
44McMaster Centre for Climate Change, McMaster University, ON, L8S 4K1, Canada
5 The World Fish Center, Dhaka, Bangladesh
6Department of Marine Sciences, University of Calcutta, Kolkata, India
- *Corresponding Author:
- Nidhi Nagabhatla
United Nations University
Institute for Water Environment and Health
(UNU-INWEH), 204-175
Longwood Road South Hamilton
ON L8P 0A1, Canada
Tel no: 1 905 667 5511
Fax: 1 905 6675510
E-mail: nidhi.nagabhatla@unu.edu
Received date: July 25, 2016; Accepted date: July 30, 2016; Published date: August 04, 2016
Citation: Nagabhatla N, Sahu SK, Altaf Arain M, Mahfuzul Haque ABM, Mitra A (2016) Explaining Climate Variability Vis-A-Vis Spatio-Temporal Interactions in Bangladeshi Exclusive Economic Zone (BEEZ). J Earth Sci Clim Change 7:364. doi: 10.4172/2157-7617.1000364
Copyright: © 2016 Nagabhatla N, et al. This is an open-access article distributed under the terms of the Creative Commons Attribution License, which permits unrestricted use, distribution, and reproduction in any medium, provided the original author and source are credited.
Visit for more related articles at Journal of Earth Science & Climatic Change
Abstract
We present an application of time series remote sensing data and climatological information for improved understanding of complexity in the Bangladeshi Exclusive Economic Zone (BEEZ). Three seasonal slots from the annual climate calendar of the temporal slice 1998 to 2009 are selected: December-February [DJF], March-May [MAM] and September-November [SON]) to assess the relationship between marine fish productivity and climate induced variations in a pelagic system. The interdisciplinary approach, explained in two segments, integrates data on climatic variables, oceanography and fish landings. The first segment deals with explanation of spatio-temporal distribution of chlorophyll (Chll-a), derived using Sea-WiFS sensor. This is followed by correlation of Chll-a gradient with marine fish productivity, using a proxy indicator –annual fish landings. The second segment examines the relationship between the Chll-agradient and representative biophysical indicators of the marine environment viz., Sea Surface Temperature [SST] and Sea Surface Height (SSH). The analysis from 1998-2009 indicates decline in Chll-a concentration during SON (0.055 mg/m3), DJF (0.012 mg/m3) and MAM (0.033 mg/m3). Fluctuations in Chll-a is explained in terms of increase in SST’s during DJF and SON and correlation between SST and SSH established in order to compliment the explanation for variability in Chll-a concentration.
Keywords
Marine-fisheries; Chll-a; SSH; SST; Remote sensing; Climate variation
Introduction
In recent years, fisheries sector worldwide has seen some stagnation and many commercial fish stocks have even collapsed due to a combination of regime shifts, climatic events, coastal degradation and poorly managed anthropogenic influences [1]. Fisheries sector in Bangladesh is important for livelihoods and for food and nutritional security; therefore, a significant socio-ecological system [2]. Sciencebased outcomes remain a crucial to the objectives outlined in marine spatial planning frameworks [3]. Alma and Thomson [4] underline the need for in-depth scientific understanding of climate-land-human interactions in order to explain the reduction in fish production, especially for coastal or marine stocks. In this context, the potential role of geospatial data for addressing multi-faceted challenges of resource management is widely acknowledged. For example, Baldwin et al. [5] used participatory geographic information systems (GIS) for effective marine resource management and strengthening the trans-boundary marine governance planning for the small island states in the Pacific region. Choudhury et al. [6] assays the application of satellite derived ocean information to study fisheries trends. Review of literature shows that some research studies have employed satellite derived images, ship board data collection, modeling and simulation techniques to assess and monitor the dynamics of Bay of Bengal [BoB] region [7-9]. The seasonal dynamics in the BoB (including the BEEZ region) underlines the influence of oceanic hydrographic phenomena such as upwelling, sea level anomalies, winds and their coupling with biomass production. Hitherto, only very few studies focus on mapping long term seasonal and temporal correlations with respect to climatic variables.
Overland et al. [10] studied the impact of climate variability induced stress, emphasizing the importance of spatio-temporal characterization. He also highlighted the need to assess biophysical attributes of climatic variability while examining ocean based ecosystems and their biological response. Gomes et al. [11] inspected the impact of freshwater influx on the hydrography, thermodynamics and biological productivity in the coastal BoB region. Other research studies reflect on the inter-annual variability of primary productivity of BoB, suggesting the influence of monsoon phenomenon and freshwater flux from riverine systems, i.e. Ganges and Brahmaputra. As well as, with the impact of physical circulations, i.e. currents, gyres and eddies originating in the ocean environment [12]. Seasonally, BoB region is also impacted by seasonal local oceanic phenomenon such as Ekman pumping (refers to wind driven mixing) eddies and East India Coastal Current (EICC). Monsoonal winds, rainfall and freshwater discharge are other factors that regulate ocean dynamics [5]. Furthermore, McCreary et al. [13] clarifies how monsoonal winds influence the annual cycle of near-surface circulation at sea level. Shetty and Gouveia [14] add their perspective by comparing the salinity profile of BoB region and Arabian Sea, while analyzing similarities and differences in their biophysical properties. Research studies by Shetye et al. and Bhat [15] further explain the BoB dynamics mainly in terms of primary productivity, integrating internal and external forcing factors. In most studies, the aspect on seasonal variability is largely overlooked.
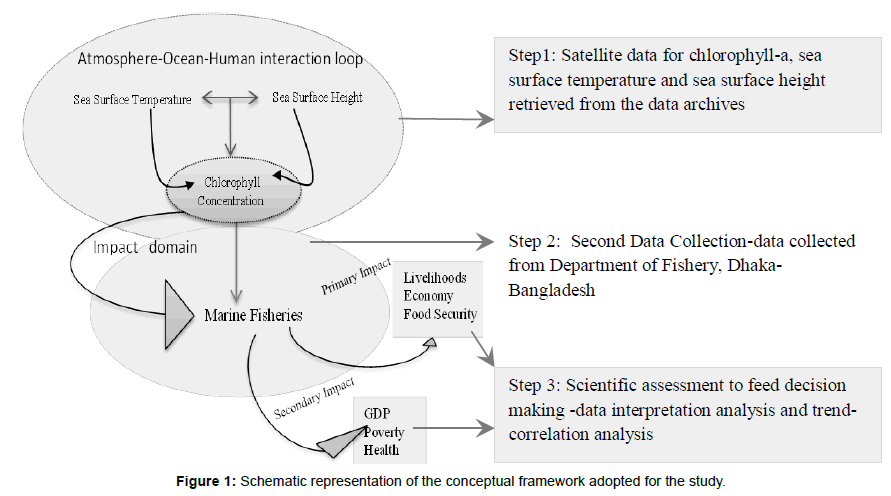
Very few research experiments deal with seasonal dimension of climate variability. For instance, Prasanna Kumar et al. [7] compared monsoonal (June to August) productivity and biogeochemical processes in the BoB and Arabian Sea, while explaining the coupling between physical forcing and how that impacts biological productivity. The study observed seasonal dynamics of chlorophyll biomass affirming high productivity during the post-monsoon time period (June-September), followed by winter and spring. Climate variation impact studies on marine fisheries in the vulnerable regions of Bangladesh are critical, as they are particularly important for food and nutritional security, and livelihoods. Observations on seasonal/ temporal climate dynamics and productivity could assist in developing a greater understanding of larger socio-economic implications and better decision making. Towards this, the conceptual outline in Figure 1 presents the guiding framework for our analysis. The analysis relates annual trends of marine fish landings (as a proxy indicator of marine productivity) with the seasonal fluctuations of Chll-concentrations in the BEEZ region. The objective embeds the need for filling existing research gaps by focusing on seasonal observations for three seasonal slots viz.,September, October, November (SON); December, January, February (DJF) and March, April, May (MAM).
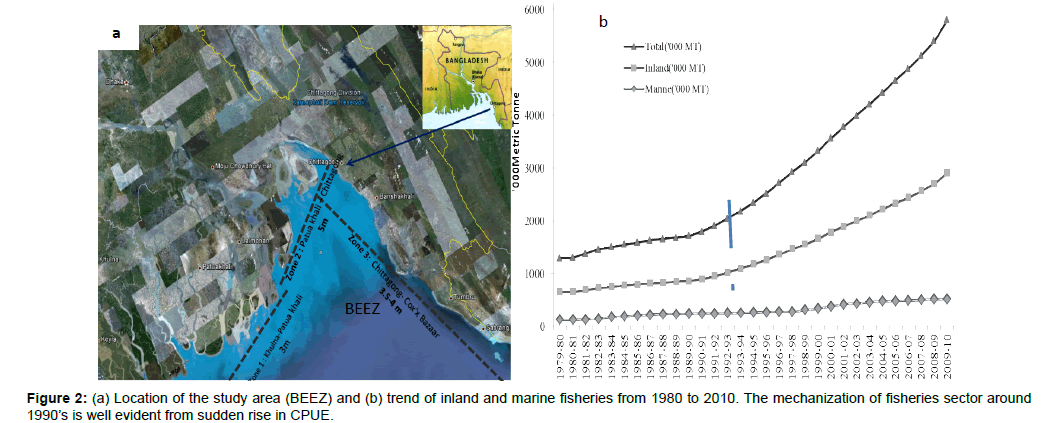
Bangladesh is predominantly an agricultural nation; the topography slopes gently from north to south, meeting at the BEEZ region in the southern end while forming a flood plain delta with rivers and canals including, the Ganges-Brahmaputra-Meghna (GBM) river system. The 710 km long coastline runs parallel to the BoB [16]. The fisheries sector is among the important livelihood activity along with agriculture. Inland and marine fisheries combined are of key importance for food security, livelihood sustainability and economic growth for contributing significantly (average of 5% annual GDP) to the country’s economy [17]. Our focus is particularly set within the BEEZ boundary conditions as: 880-930E and 150-190N, a part of marine territorial range for Bangladesh in the northern BoB region (Figure 2a). Interdisciplinary application of climate and weather data is an increasing trend that will see further expansion in the future [18]. In line with this argument, the present study aims to relate the biophysical patterns of the marine environment with fish productivity using spatial correlation techniques and trend analysis, explaining relevance of science-based evidence to decision making. In this research, we examine trends of Chlorophyll a in Bay of Bengal for over the decade (1998-2009) during each of SON, DJF and MAM periods of the year by measuring Sea-WiFS using monthly means averaged over the region (areas of interest) and monthly means at spatial grid. Further, we comparatively examine trends in catch of fish from marine waters and total catch measured as annual catch over the same 1998-2009 period.
Data and Methods
The main set of data used includes the following (a) Fish/catch per trawler or the catch per unit effort, i.e. CPUE for the time period 1998- 2009. The ideal way is to consider catch per trawl; however, CPUE serves as a surrogate for marine fish productivity. It is expressed as total marine catch in percentages to identify the measure of fishery yield partly because of limited data availability. (b) Sea-WiFS multispectral data, available from the instrument aboard the OrbView-2 spacecraft provides information in eight channels, six in the visible and two in the infrared spectrum with a spatial resolution of 1.1 km. This data was retrieved from NOAA’s (National Oceanic & Atmospheric Administration’s web interface-http://oceanwatch.pifsc.noaa.gov) and employed to assess spatial and temporal variation of Chll-a. (c) Sea Surface Temperature or SST, available from NOAA-OISST (Optimum Interpolation Sea Surface Temperature) as weekly, monthly or long terms means with spatial coverage of 1.0 degree latitude x 1.0 degree longitude global grid (180 x 360). (d) Sea Surface Height or SSH, representative of dynamic ocean topography at the sea surface is obtained from Archiving, Validation and Interpretation of Satellite Oceanography (AVISO)-Asia Pacific Data Research Center (APDRC) web interface. The analytical part is comprised of two sections. First section illustrates the fish production trends [marine and inland] and also their temporal variations (species-level). Secondary data from the Department of Fisheries served as the baseline to examine distinction between time span of artisanal and mechanized fishing in the BEEZ region. To analyze fishery yield, we dissected marine fish catch showing the total marine catch, total number of vessels, catch per unit effort (CPUE), and total pelagic catch as proportion of total marine catch for each year from 1998 to 2009.
The second section explains the correlation between marine fish productivity and climate variability analyzed using representative indicators. The first section of our analysis helped in selection of a representative time period for analysis. The fish catch data was correlated with climatic and oceanographic parameters [sea-surface temperature (SST), sea-surface height (SSH) and productivitymeasured as Chlorophyll-a (Chll-a) concentration], although lack of complete temporal match in the available data sets was limited. Data sets for three different period’s viz., SON, DFF and MAM were used. During monsoon season (JJA-June to August), typically considered as the spawning period for species like Eleutheronema tetradactylum [19], the rate of fish landings are flat or low as fish is not caught or harvested in the region during this period. In addition, procuring cloud free satellite observation based data during the monsoon season is a challenging task. Accounting these concerns, that seasonal slot was not included in analysis.
We used Ferret software (http://www.ferret.noaa.gov) to compute monthly anomaly data sets based on SST, SSH and Chll-a values and calculated visually explicit ‘Spatial Pattern Maps’ (hereafter referred as SPM) or ‘Special Trend Plots’ outputs. The aim of the study is to provide empirical evidence to acknowledge the effect of climatic variability on the productive capacity of the pelagic system, a knowledge that could serve meaningful for managing the production economics and socioeconomic planning of BEEZ.
Results
Trends in marine fisheries vis-a-vis trends in Chll-a distribution
The time series secondary data was analysed to observe the pattern of marine fish productivity between 1998 and 2009. The inter-annual variability, more specifically the proportional and species wise marine fisheries contribution to the total fish (inland & marine) production is notable (Figure 2b). Of the 1500,000 MT (metric tons) of production in 1998-1999, nearly 19% (300,000 MT) represent the marine sector; this share increased to nearly 22 (455,000 MT) in 2003-2004. In 2009, whilst the total production doubled (compared to 1998-99) reaching 3000,000 MT, the contribution from marine sector declined to 17.5% (500,000 MT). The above explanations at an annual level; however, the total fish landings is cumulative sum of all seasons and is affected by biomass variations at seasonal scale. The marine catch has increased every year from 1998 to 2009; however, as a proportion of the total Bangladeshi fishery, it has fluctuated between about 89.5% and 92.7% presumably as of annual fluctuations in marine and freshwater landings.
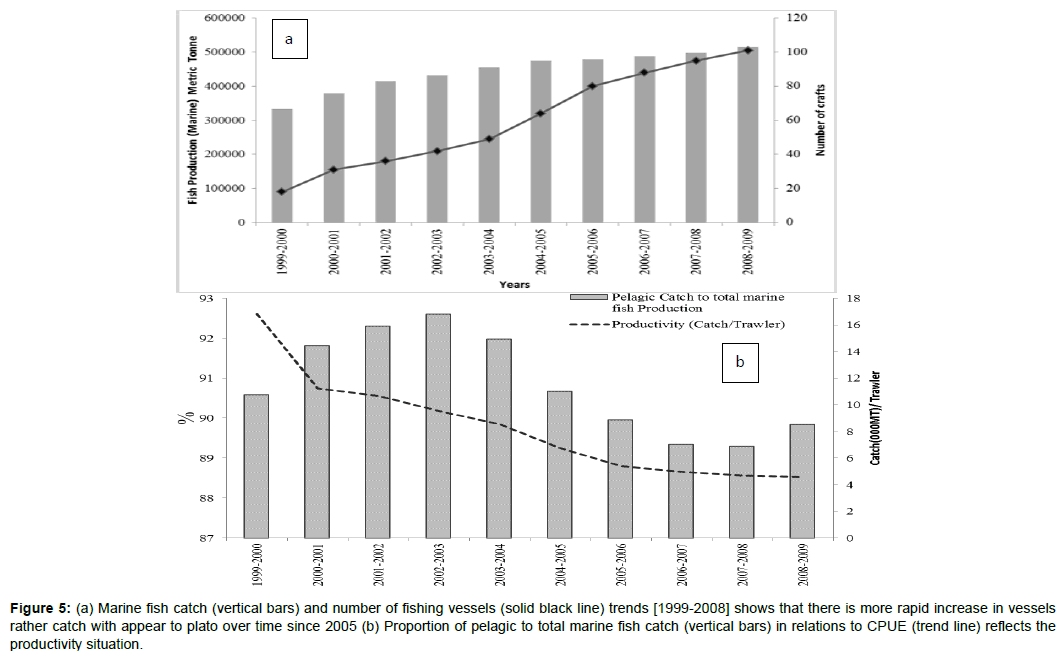
One can argue that changes in primary production are impacting fish production. The composition of the marine fishery catch has remained relatively constant – the most abundant species, Hilsa as well as sharks, rays, catfish, and Indian salmon all remain rather constant as proportion of total catch shows a small rise. Bombay duck, pomfret and jaw fish seem to have come to represent larger fractions of the catch. The marine CPUE is deteriorating, a fact that is readily attributable to the great increase in number of vessels fishing.
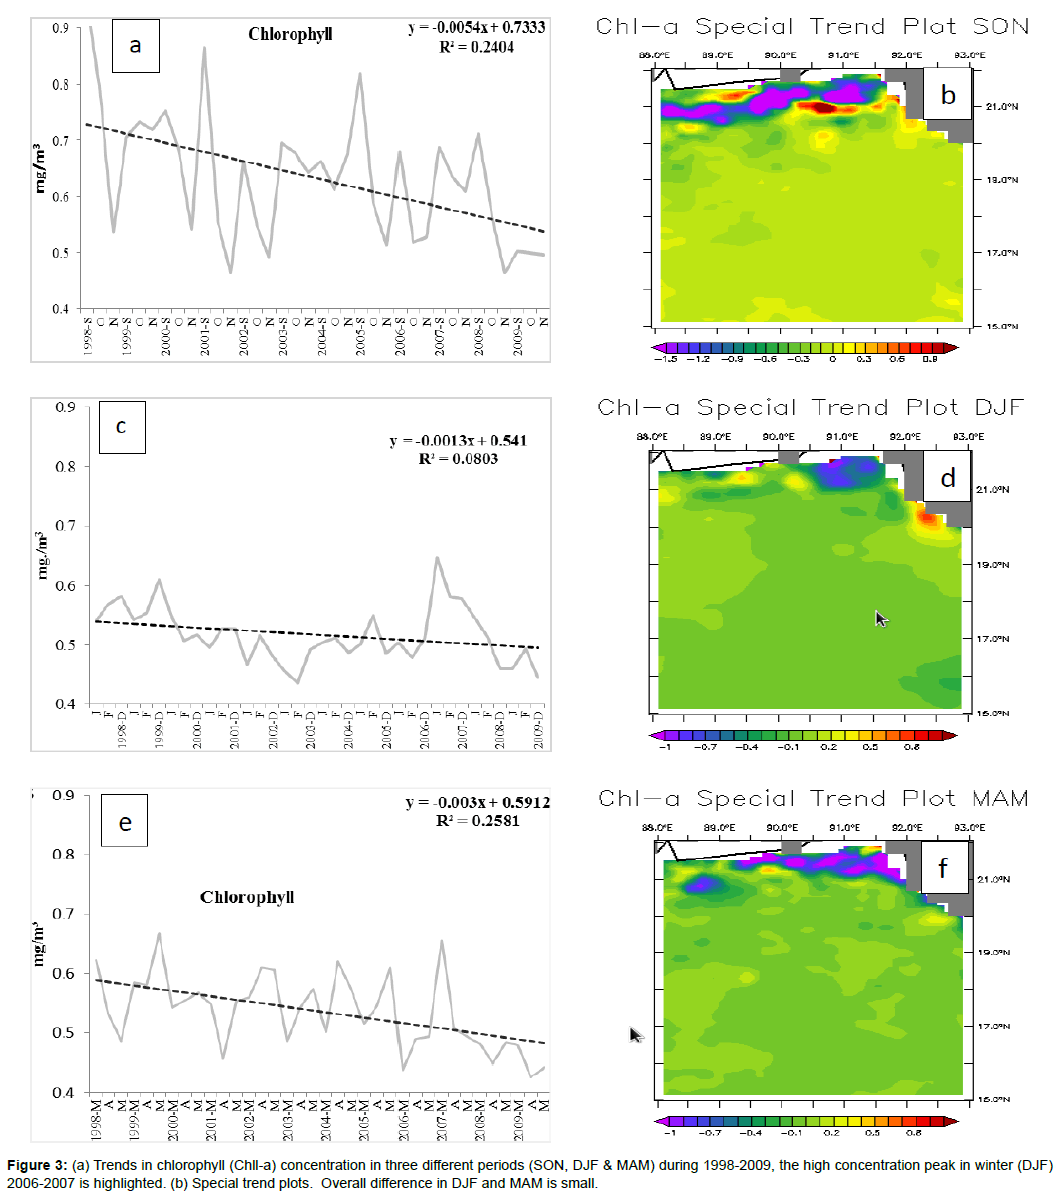
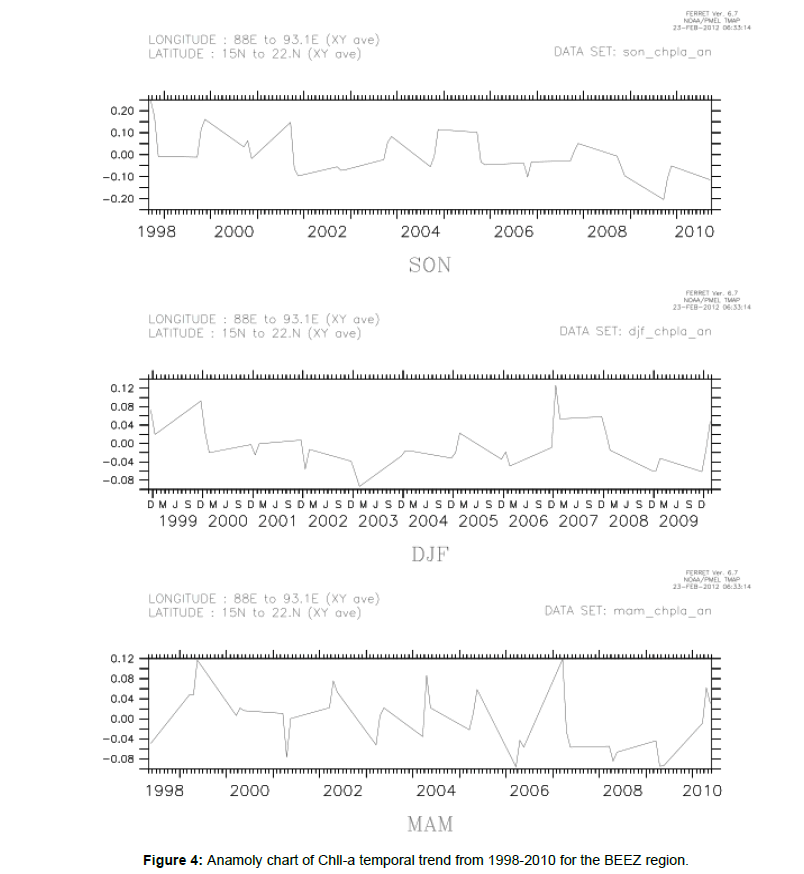
The analysis further investigates how change in Chll-a concentration possibly correlates with marine productivity. Temporal (1998-2009) and seasonal (MAM, SON and DJF) Chll-a variability is employed to explain fluctuations computed using the SST and SSH data sets. It was observed that Sea-WiFS records high Chll-a concentration during SON, than in DJF and MAM. Chll-a trend shows notable decline during MAM and SON and relatively small decline during DJF. SPM’s of three seasonal slots report on spatial distribution of illustrating the trend of Chll-a anomaly in BEEZ (Figure 3b). Seasonal comparison shows SON as the most dynamic part of the year with variations of high order. For example, herein the Chll-a concentration decreased to almost half (from 0.95 mg/m3 in September-1998 to 0.49 mg/m3 in September-2009) in span of a decade. In order to explain these variations, reference can be drawn from land-ocean dynamics, attributing to the phenomenon of post-monsoon algal bloom off the mouths of the Ganga, Brahmaputra and Meghna rivers (GBM-effect) after the waning of the southwest monsoon. This is usually followed by flow of East Indian coastal current in northern part of Indian coast towards the equator, as a result, high Chll-a region adheres to the coast [20]. With reverse current, Chll-a plume flows offshore from the coast in open bay. Conversely, during spring (MAM), this plume can be observed several hundred kilometers to south, occasionally extending far south to 17oN reports Vinayachandran [21]. During DJF, decline in Chll-a level is of smaller order (0.0121 mg/m3); however, during MAM the trend (decline) is of the order of 0.033 mg/m3. In support of the above argument, refer to Chll-a anomaly plots in Figure 4.
The atmospheric variations and the corresponding variation in the biophysical properties of the oceanic environment colligate. The overall values of Chll-a concentration during DJF is low when compared with SON and MAM, this is due to cooling of water in northern BoB. This does not extend to winter convection as surface waters have low salinity. Away from influence of low salinity water regime, the stratification of upper layers is weak allowing fairly moderate winter monsoon winds to initiate wind-mixing and thereby facilitating nutrient supply to the euphotic zone [8]. It is clear that ocean eddies plays a vital role in enhancing biological productivity. In that regard, Chll-a concentration peaks during 1999 and 2007 (Figure 3) can be attributed to the impact of modest La-Nina event.
Examining secondary data based marine fisheries trends (annual) and spatially derived Chll-a [seasonal] variation in conjunction; one can derive some interesting notes, even though perfect temporal matching could have been more effective. The secondary data on fish landing was available only as annual aggregates, limiting this opportunity. Figures 5a and 5b shows variations in CPUE for marine fish landings in the BEEZ region and their proportional contribution from pelagic catch.
Figure 5: (a) Marine fish catch (vertical bars) and number of fishing vessels (solid black line) trends [1999-2008] shows that there is more rapid increase in vessels rather catch with appear to plato over time since 2005 (b) Proportion of pelagic to total marine fish catch (vertical bars) in relations to CPUE (trend line) reflects the productivity situation.
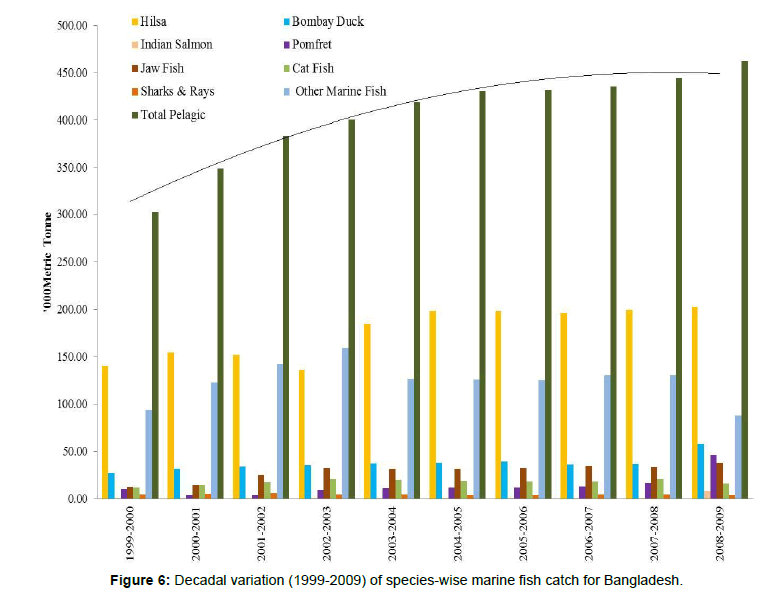
The key species harvested from the east BoB region include: Hilsa (Tenulosa ilisha), Bombay duck (Harpadon nehereus) and Indian Salmon (Oncorhynchus tshawytscha). Landings of these species report waning at an annual level (compared to decadal mean for each species), which is likely due to spatial, temporal and seasonal pattern of change in Chll-a gradient. Different trends were observed for different species, for instance Bombay duck and Hilsa display comparatively dynamic pattern of temporal variance, compared to the rest. Bhuiyan et al. [22] explained that the winter season is the most productive for coastal BoB, especially for Bombay duck and shrimp. Towards this deduction, a correlation analysis between seasonal trends of Chll-a and marine productivity (species level) was attempted. Fish catch statistics (Figure 6) supports the argument as 27,480 metric tons (MT) of Bombay duck was harvested during 1999. Comparatively, during 2007-2008, the production of the species increased to 36,980 MT at the same time Chll-a gradient reported high concentration peak (Figure 3a), which supports the case of close influence of Chll-a gradient on fish productivity (here for Bombay duck) at the seasonal and annual level. The catch data for Jawfish (Opistognathidae) show that landings nearly doubled (4.16 % of the total catch in 1999 to 8.31% in 2009) while Hilsa, an economically important marine species, declined (from 46.4% in 1999 to 43.89% in 2009) in its contribution to the total fish landing.
Chlorophyll distribution vis-a-vis SSH and SST
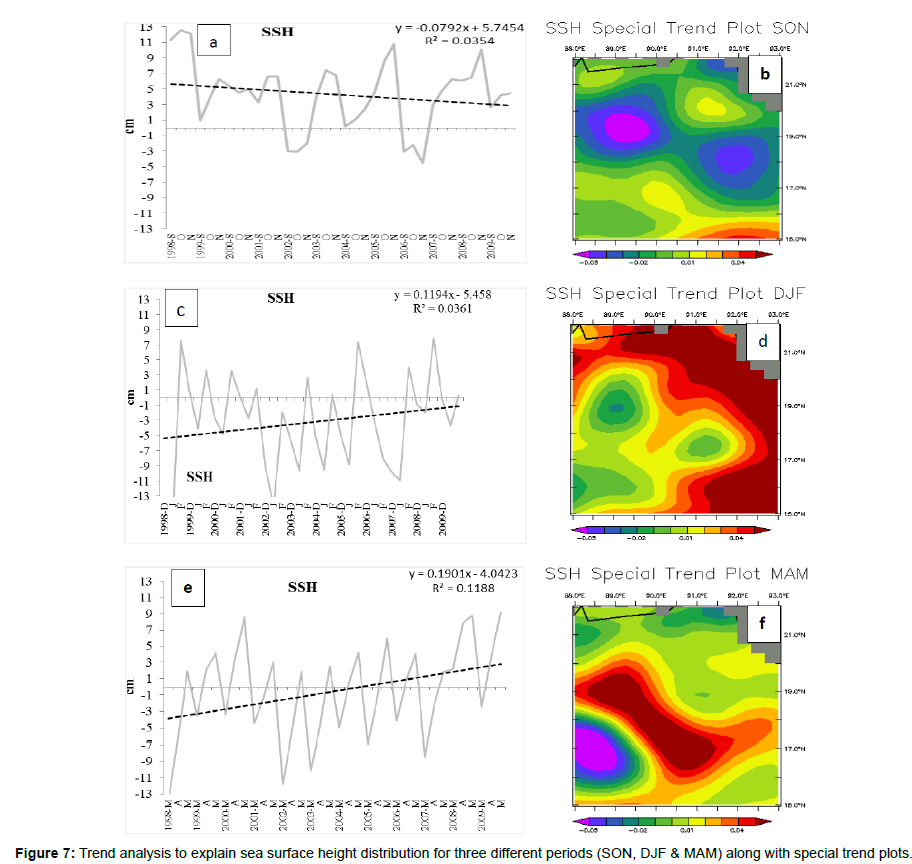
Decadal pattern (1998-2009) of climatic variables reveals an interesting set of correlations. First, the Chll-a and SST are directly correlated and Chll-a and SSH are inversely related, although seasonal gradients in both cases shows variations. For example, during MAM and DJF the correlation between Chll-a and SST is positive; however, during SON the pattern do not appear as significant. The visual representation or STM’s (Figures 7 and 8) depicts the spatial distribution of SSH and SST: highlighting that SSH is decreasing (0.87 cm) during SON and reports an increasing trend during DJF and MAM corresponding to the values of 1.31 cm and 2.09 cm respectively (Figure 7a). It is important to note that SSH trend is inversely proportional to Chll-a trend. In terms of spatial distribution, central and south-west BEEZ region reveal high value of SSH during DJF while the central region records high value during MAM (Figure 7b).
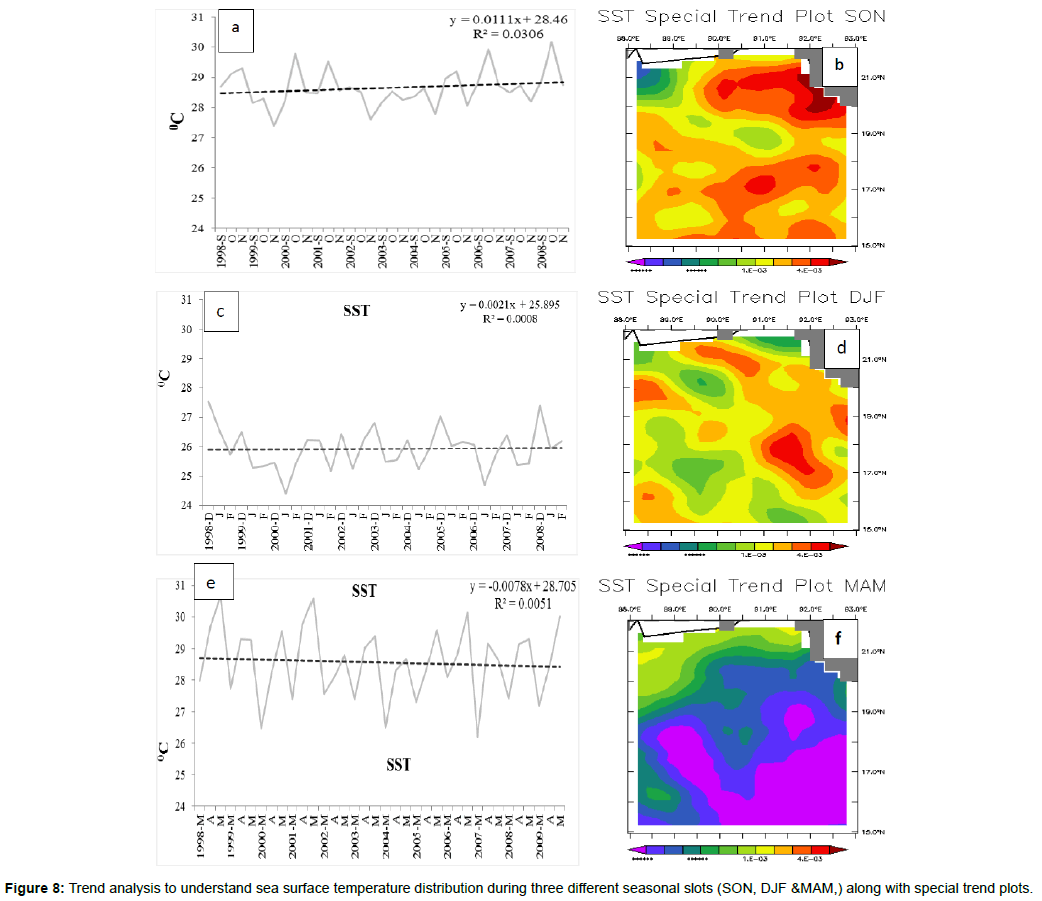
The temporal trends evaluated for SST from 1998 onwards show signs of increase, conspicuously during SON (Figure 8a). The analysis report SST shows increase of the order 0.13oC and 0.07oC during SON and DJF. During MAM, a negative trend of the order 0.16oC is noted. Special trend plots in Figure 8 depict spatial distribution of SST, for example, during SON most of the region shows identical values except part of the extreme North-West. In contrast, SST fluctuation during DJF was comparatively dynamic with random distribution pattern. Furthermore, during MAM, spatial patterns indicate small gradient of decline in SST for most of the region except the extreme north. In order to advance the understanding the biophysical dynamics of the marine environment, SST and SSH trends were correlated with Chll-a variability using the software interface (Figure 9). The analysis shows that Chll-a is mostly negatively correlated with SST and positively correlated with SSH in each of the three seasons. As seen in Figure 9, the relationships in most locations appear to show weak correlations (r > -0.3, <0.3).
Spatial correlation pattern Chll-a and SST is mostly negative during SON and DJF, excluding a few patches in the coastal and southern region. During MAM, it’s a positive correlation, also for Chll-a and SSH, the values are mostly positive, however, patchy signs of negative values are observed during MAM. Overall, the coastal zone is quite dynamic as correlation values vary a lot at within a seasonal scale. No significant correlations are observed in the western region. The analysis provides a fair understanding of how the biomass availability (Chll-a) varies with biophysical properties and how this variation perhaps drives the fluctuations in fish productivity.
Discussion
BEEZ region is a significant zone with regards to export and domestic economy. Therefore, up-to-date understanding of trends in its biophysical environment and CPUE can help manage the marine resources better. For instance, the notable decline in Chll-a gradient from 1998-2009 reflects a situation demanding further scientific exploration. One can attribute this as a cumulative impact of several factors, including climatic factors [23]. Parameterization of the biophysical environment of the marine ecosystem using representative indicators compliments the secondary data based information, mainly the marine fish landings for assessment of marine fish productivity.
The links between SST and chlorophyll shows trends in primary production in the BoB region and contributes to the issue of flow-on effects from falling productivity to reduce fishery production capacity. The available fishery data served helpful to generate evidence of production loss in a decadal span, although we note that the absence of data on size or age distribution of key species could have served better for establishing further evidence. While the total catch is still increasing slowly, catch data is not a clear representation of dropping production. However, a downward trend in composition (Figure 6) of the marine catch could be considered to explain the trend. The aggregated annual fishery landings data and the fisheries department do not often extract data on fishery yield at the seasonal scale. Absence of seasonal data has limited our attempt to quantitatively estimate if the yield correlates with Chll-a. The temporal trend of important catch species of the annual fishery catch data conforms with the hypothesis of declining productivity during the time span under investigation and to the conclusion derived from trend analysis.
We also examined trends in SST and SSH for each of SON, DJF and MAM periods during 1998-2009 using monthly means averaged (Figure 7) over the area of interest and site-specific monthly (Figure 8). It is a challenging task to investigate all aspects of climatic variability; therefore, an attempt is made to select representative indicators (SSH, SST) to examine the inter-relationship in atmospheric dynamics, hydrographic variability and marine productivity.
The analysis reflects a decadal or longer declining trend in Chll-a. The trend is statistically significant in the seasons SON, MAM and in DJF; however, the slope is steepest for SON. Concurrent to our observation, the study of Chll-a distribution in BoB by Gomes et al. [11] depicts an increase in productivity during DJF, especially in the northern part of BoB. A seasonal increase is prominent along the coast due to estuarine conditions and freshwater influx. Another factor influencing variation in species-wise catch is the change in salinity and hydrology, resulting from seasonal freshwater flux of three major inland GBM channels. In a similar context, Dwivedi [24] explains the hydrologic changes in territorial environment of a marine ecosystem induced from fresh water discharge. Low Chll-a concentration during MAM period can be explained by referring to the study by Prasanna Kumar et al. [7]. Seasonal trend of Chll-a, SST and SSH provide a fair clarification on the biophysical dynamics and adds to the understanding of how this changing dynamics could possibly impact marine ecosystem services and benefits (primarily, fish landings) and subsequently, fish based livelihoods and industry.
The spatial distributions represented in SPM’s shows the differential influence of Chll-a concentration on BEEZ during seasonal periods and the difference in impact of near coast and shelf regions. For example, our finding confers with study conducted by Mome [17] showing that southern patch of marine fishing zone is comparatively productive than other regions in the AOI. Correlations between SST, SSH and Chll-a concentration corroborates understanding of dynamic processes that govern climate variation and its broad impact on marine ecosystems. During SON and DJF, SST and SSH are inversely correlated; however during MAM, a reverse trend is observed, likely due to the effect of local oceanic circulatory processes and currents or the influence of land-sea-atmospheric phenomena, such as runoff and eddies. The study provides an explanation for the loss of Chll-a (1998 -2009) driven by hydro climatic dynamics and how that impacts the timing and setting of monsoon and flooding. Highlighted is the influence of fresh water influx from rivers and oceanic precipitation under monsoon conditions, which causes strong stratification of upper waters and low salinity waters during summer. The circulations result in the stratification of the upper layers, and as a consequence, strong monsoonal winds are regulated from penetrating below. At the same time, this process initiates wind-driven mixing to supply subsurface nutrients to euphotic zone.
Correlation between Chll-a, SST and SSH coincide with Hussain and Hoq [25], who argued that extensive human activity accelerates the rate and amount of seashore erosion, as spatial trends nearcoast are usually quite dynamic. Clear seasonal trends depict Chll-a concentration inversely related to SST. Investigation by Venegas et al. [26] from Northern California illustrates the variability in seasonal cycles of circulation in SSH, SST and Chll-a. Noted in the study is a positive correlation in the central region during MAM. One can note that winds are favorable for coastal upwelling during December- March that favors development of blooms, as measured by increases in Chll-a levels [27]. It can be argued that seasonal variability in Chll-a concentration varies prominently under atmospheric influence. However, overall decline in Chll-a gradient during 1998-2009 is indicative of a larger temporal phenomenon that needs to be factored in for the management of marine ecosystems.
It is pertinent to highlight the limitations of the study. While we reckon that examining spatio-temporal linkages by employing geographically differentiated fish landings data is an ideal way to establish cause-effect relationship, the fragmented nature of available data served as big constrain in this experiment. We employed a range of date sets accessed from different sources and available at different scales; achieving satisfactory data harmonization remained a gap area. For example, the Chll-a values derived from SeaWiFs images for monsoon times are often inhibited by cloud cover problem [28-30]. As most limitations relate to data accessibility, data accuracy and data gaps; the authors suggest that the follow up studies could factor monthly fish landings, ideally matching with the same temporal interval as the Chll-a, SST and SSH data. In addition, the authors also acknowledge that examining corresponding impact on the socioeconomic aspect needs better and detailed evaluation.
Conclusions
Firstly, the study explored a possible interdependence between the changes in the fishery landings and climate impacts on productivity of Bay of Bengal. Investigating seasonal and temporal correlation of marine fish productivity with climate variability by employing a set of indicators derived from remote sensing sensor and secondary data provided clear indication on the spatial distribution of biomass and its seasonal variability. Example: Chll-a reports a decline of nearly 50 per cent in the past two decades, i.e. 0.95 mg/m-3-September 1998 to 0.50 mg/m-3- September 2009. Additionally, time series observation allows for a good understanding towards a possibly alarming situation for the marine fish sector if the variations in climate continue at the same pace. Whilst, several determinants stemming from natural and anthropological factors cumulatively induce the land-atmosphere dynamics or likely influence marine fish productivity; Chll-a (biomass availability) concentration remains an important parameter.
Secondly, it reiterates that the impact of climate effects on the monsoon pattern of BoB region is almost undisputable; however, the understanding of its multidimensional impact is missing. The dynamics and knowledge of various other local events could be having direct impacts on primary production in BoB. While the data on marine landings do not appear to show any significant decline, the lack of specific data (species level, seasonal scale) collection by the federal agencies pose a limitation in establishing clear-cut scientific evidence on the current status of fish productivity. The changes in Chll a, which is proxy for phytoplankton, are clear (particularly in SON) and suggested impact of climate on monsoon and flooding provides a logical causal mechanism. It is clear from the CPUE that the increase in effort has reached the point where fishers catch the maximum, and, even if primary production is not going to fall any further, continuing this level of effort, or increasing it further will likely lead to overfishing and an overall declining marine fishery yield.
The final remarks highlight the multi-level analysis comprising of descriptive comparisons and spatial-statistical testing taking account of selected indicators (SST, SSH, Chll-a) provide a fair evidence to examine the accelerating impact of climatic variability, including the significant dimension of seasonality. At the end of the day, research studies should be able to contribute to develop a knowledge pool that can equip decision makers and stakeholders with up-to-date science based information (evidence). The overarching goal of climate change adaptation planning can only be achieved through interdisciplinary efforts that combine knowledge from varied disciplines while influencing collaboration between resource users, management planning and policy decisions. This demonstrated research is an effort in this direction, enabling the readers to gain scientific insights to plan for large marine ecosystems, in this case, the BEEZ region.
Acknowledgment
Majority of the analysis was conducted during the research engagement of first author at Asia Pacific Climate Center of the Asia Pacific Economic Cooperation, South Korea. The authors extend their gratitude to all the contributors and their organizations. The authors would like to especially acknowledge the crucially relevant feedback from Prof Peter Sale of the University of Windsor, Canada that has led to significant refining of the content in the script.
References
- FAO (1994) Marine Fisheries and the Law of the Sea: A Decade of Change. FAO Fisheries Circular No. 853.
- Nagabhatla N, Sahu S, Gaetaniello A, Wen L, Lee W (2015) Understanding impacts of climate variation in varied socio-ecological domains: a prerequisite for climate change adaptation and management. In Handbook of Climate Change Adaptation. Eds (Leal Filho W) Springer pp:1-25
- Douvere F (2008) The importance of marine spatial planning in advancing ecosystem-based sea use management. Marine Policy 32: 762–771.
- AlamMdF KJ, Thomson (2001) Current constraints and future possibilities for Bangladesh fisheries.Food Policy 26: 297-313.
- Girishkumar M, Ravichandran M, and Han W (2013) Observed intraseasonal thermocline variability in the Bay of Bengal. J Geophys Res (Oceans) 118: 3336–3349.
- Choudhury SB, Rao KH, Rao MV (2002) Satellite remote sensing for marine resources assessment. Tropical Ecology 43: 187-202.
- Prasanna KS, Muraleedharan PM, Prasad TG, Gauns M, Ramaiah N (2002) Why is the Bay of Bengal less productive during summer monsoon compared to the Arabian Sea? Geophysical Research Letters.
- Prasanna KS, Nuncio M, Narvekar J, Kumar A, Sardesai S (2004)Are Eddies nature’s trigger to enhance biological productivity in the Bay of Bengal? Geophysical Research Letters.
- Vinayachandran PN, McCreary JP, Hood RR, Kohler KE (2005) A numerical investigation of the phytoplankton bloom in the Bay of Bengal during Northeast Monsoon. J Geophysical Research. 110: C12001.
- Overland EJ, Juergen A, Andrew B, James HW, David (2010) Climate controls on marine ecosystems and fish populations. J Marine Systems 79: 305–315.
- Gomes HR, Goes JI, Saino T (2000) Influence of physical processes and freshwater discharge on the seasonality of phytoplankton regime in the Bay of Bengal. Continental Shelf Research. 20: 313– 330.
- Shetye SR, Gouveia AD, Shenoi SSC, Michael GS, Sundar D(1991) The coastal current off western India during the northeast monsoon. Deep-Sea Research 38:1517–1529.
- McCreary JP, Kundu PK, Molinari RL (1993) A numerical investigation of dynamics, thermodynamics and mixed-layer processes in the Indian Ocean. Progress in Oceanography. 31: 181–244.
- Shetye SR, Gouveia AD (1998) Coastal circulation in the north Indian Ocean: Coastal segment (14, S–W). The Sea 18:523–556.
- Bhat GS (2001) Near surface atmospheric characteristics over the North Bay of Bengal during the Indian summer monsoon. Geophysical Research Letters 28: 987-990.
- Near surface atmospheric characteristics over the North Bay of Bengal during the Indian summer monsoon. Geophysical Research Letters 28: 987-990.
- CZPo (2005) Coastal Zone Policy Document. Ministry of Water Resources, Government of the People’s Republic of Bangladesh, Dhaka.
- Mome MA (2007) The potential of the artisanal Hilsa fishery in Bangladesh: An economically efficient fisheries policy. Report of The United Nations University Fisheries Training Programme. E-publishing Inc. pp: 50.
- Nagabhatla N, Beveridge M, Haque ABM, Nguyen-Khoa S and Van Brakel M (2012) Multiple water use as an approach for increased basin productivity and improved adaptation: a case study from Bangladesh. International Journal of River Basin Management 10:121-136.
- Nesarul HM, Abu Hena MK, Saifullah SM, Idris MH (2014) Breeding Biology of Eleutheronematetradactylum (Shaw, 1804) from the Bay of Bengal, Indian Ocean. World Applied Sciences J 30: 240-244.
- Chauhan P, Nagamani PV, Solanki HU, Nayak S (2005) Composite image of chlorophyll and Sea Surface Temperature (SST) using MODIS-AQUA. J Indian Society of Remote Sensing 33: 177-180.
- Bhuiyan AS, IslamSN and Bhiuyan SS (2008) Seasonal occurrence of some copepods in relation to the physicochemical conditions of a fish pond in Rajshahi, Bangladesh. Fishing Chimes 28: 39-41.
- Vinayachandran PN (2009) Impact of physical processes on chlorophyll distribution in the Bay of Bengal. Geophysical Monograph Series 185: 71-86.
- Islam M, Sallu S, Hubacek K, Paavola J (2014) Vulnerability of fishery-based livelihoods to the impacts of climate variability and change: insights from coastal Bangladesh.Regional Environmental Change. 14: 281–294.
- Dwivedi SN (1993) Long-term variability in the food chains, biomass yield and oceanography of the Bay of Bengal Ecosystem. American Association for the Advancement of Science. Large Marine Ecosystems: Stress, Mitigation and Sustainability.Washington, DC: 43-52
- Hussain MG, Hoq ME (eds.) (2010) Sustainable Management of Fisheries Resources of the Bay of Bengal- Compilation of national and regional workshop reports. Report of Sustainable Management of BOBLME Project. Bangladesh Fisheries Research Institutepp: 122.
- Venegas RM, Strub PT, Beier E, Letelier R, Andrew CT (2008) Satellite-derived variability in chlorophyll, wind stress, sea surface height, and temperature in the northern California Current System. J Geophysical Research 113: C03015.
- McCreary JP, Kohler KE, Hood RR, Olso DB (1996) A four-component ecosystem model of biological activity in the Arabian Sea. Progress in Oceanography 37: 193-240.
- Nordkvist K, Loisel H, DuforêtGaurie L (2009) Cloud masking of SeaWiFS images over coastal waters using spectral variability. Optics Express 17: 12246-12248
- DevarajM, Vivekanandan E (1999) Marine capture fisheries of India: challenges and opportunities. Current Science 76: 314-332
Relevant Topics
- Atmosphere
- Atmospheric Chemistry
- Atmospheric inversions
- Biosphere
- Chemical Oceanography
- Climate Modeling
- Crystallography
- Disaster Science
- Earth Science
- Ecology
- Environmental Degradation
- Gemology
- Geochemistry
- Geochronology
- Geomicrobiology
- Geomorphology
- Geosciences
- Geostatistics
- Glaciology
- Microplastic Pollution
- Mineralogy
- Soil Erosion and Land Degradation
Recommended Journals
Article Tools
Article Usage
- Total views: 14345
- [From(publication date):
August-2016 - Jul 06, 2025] - Breakdown by view type
- HTML page views : 13338
- PDF downloads : 1007

