Experimental Investigation of Chemical Flooding using Joint Nanoparticles and Polymer on Displacement of Crude Oil with Injection Air Booster for Enhanced Oil Recovery
Received: 13-May-2023 / Manuscript No. OGR-23-98747 / Editor assigned: 16-May-2023 / PreQC No. OGR-23-98747 (PQ) / Reviewed: 31-May-2023 / QC No. OGR-23-98747 / Revised: 03-Jan-2024 / Manuscript No. OGR-23-98747 (R) / Published Date: 10-Jan-2024
Abstract
The understanding of the physical properties of reservoir fluids such as viscous and interfacial forces is serious in many oil and gas, petrochemical and other connected industries. In oil and gas industry, the production, transference and processing of hydrocarbon fluids involve dealing with the multiphase system. Viscosity and Interfacial Tension (IFT) are between the fluids properties that affect fluid performance. These properties have important effects on fluid flow physiognomies and thus their importance in oil and gas production and processing features from the reservoir to other surface services. Hence correct resolve of these fluid properties theatres a vital role in forecasting multiphase flow and dealing related problems faced by the industry such as hydrates, scale and corrosion. Surfactants are other along the line, to prevent hydrate formation, by miserable the formation temperature and transport it as hydrate slurry when formed to avoid pipe blockages. While important research has been showed in reservoir conditions, but pipeline system, the presence of salt and polymer surfactants which tend to alter the IFT behavior has not been well studied. One of enhanced oil recovery methods to increase oil production is nanoparticles with polymer flooding. Combinations are considered as effective chemical agents used in lab in university of Salford. It is used to reduce the Interfacial Tension (IFT) Therefore, the aim of this work is to investigate and measure the IFT based on the air injection and conditions of combination silica nanoparticles and polymer GA at the oilfield. These parameters such as temperature, pressure, salinity as well as the attention of combination silica nanoparticles and GA polymer are used to investigate the effects on IFT reduction. From the results, it is reported that pressure from 1200 psi and temperature diverse from 30°C, 35°C, 40°C, 45°C and 50°C can decrease IFT insignificantly. Though, (combination silica nanoparticles and GA) and salinity absorption are the main parameters that effect on the IFT reduction. It can critically reduction IFT up to for combination silica nanoparticles and GA concentration and up to for salinity. Finally, the results can be practical to use in the real field for enhanced oil recovery in oilfield.
Keywords
Food waste; Eating disorder; Hunger-reduction; Climate change; Nano particles
Introduction
Currently, the world economic growth is developing incessantly. Thus, energy ingesting is rising fast as well. Oil production requests to be enhanced to serve this increasing petition. Enhanced Oil Recovery (EOR) technology as tertiary recovery is getting more care because of ineffective primary and secondary recoveries. Chemical flooding agents are considered as one of the effective because it can significantly reduce the Interfacial Tension (IFT) between water and oil interfaces and increase values of both displacement efficiency and sweep efficiency, as well as decrease residual oil saturation [1]. Nanotechnology has been usually used in some other manufactures, and the attention in it within the oil industry is growing, due to its potential to really change Enhanced Oil Recovery (EOR) and to improve the mechanism of recovery. With the decline in oil discoveries throughout the last periods, it is believed that EOR technologies will play a key role to meet the energy demand in future. New materials and additives are needed to make EOR economical in stimulating reservoirs or harsh environments. Nanoparticles have been generally studied for EOR, but nanoparticles with polymer chain joined to the surface, known as Polymer coated Nanoparticles (PNPs), are an developed class of materials that may be better than nanoparticles for EOR due to enhanced solubility and stability, greater maintenance of foams and emulsions, and more superficial transportation through porous media. The aim of this work is to investigate the Interfacial Tension (IFT) of (silica nanoparticles/polymer gum-Arabic) in the presence brine at different temperature to enhanced and improve oil recovery at the oilfield.
Theory of interfacial tension
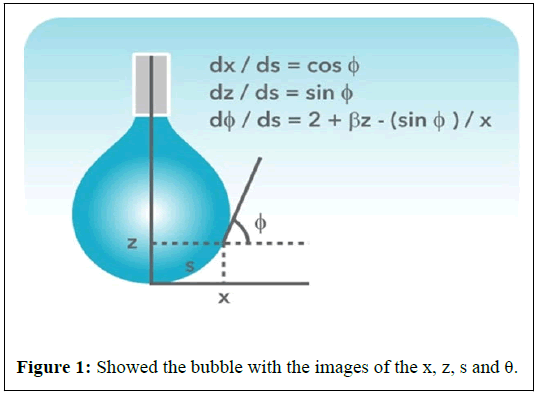
Interfacial tension of the Air bubble is determined from the shape of the bubble created using a Radius of the curvature (R0) and the shape Influence (β) by the equations 1 and 2:

Where Δρ is the density difference between the incessant and increased bubble phase, g is the gravitational constant, R0 is the radius of curvature at the droopy bubble apex, and β is the shape factor.
The bubble outline has been defined using Young-Laplace equation, which is presented in a dimensionless form as shown in equations 3–5.
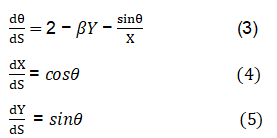
Figure 1 schematic of the pendant drop coordinate system and the Young-Laplace equation parameterized with respect to arc length. The arc length in the meridional plane is s, and the angle between the surface tangent and horizontal is φ.
The parameter, s, is the distance along the drop profile from the drop apex, X, Y and S are dimensionless parameters made by dividing x, y and s, separately by R0. H” and H’ are the distance from the centre of the curvature to the drop apex. Many academic dimensionless profiles were calculated for the whole possible β-range, from β=-0.55 to 1020 using Kutta-Merson’s geometric addition procedure with automatic step length modification [2]. The maximum relative error was set to 10-4. Each profile was measured mathematically by using cubic interpolation. In this way curves relating the parameters β and R0 with calculable parameters as designated in Figure 1 were produced and these curves were fitted with linear polynomials by the method of least squares.
For pendant drops too short for the determination of DS (DS is the diameter at a distance DE from the drop apex), the drop Height (H) and the Radius (R) is used. R is given as shown in equation 6:

DE is the maximum diameter of the bubble from the bubble apex of methane gas. Equation 1 may be re-written in term of H as shown in equation 7 as:

Where β is a transformed shape parameter. It is easily observed that H will have an upper limit because of the maximum hydrostatic pressure the surface tension may resist. When the drop becomes infinitely full, only one radius of curvature will be necessary, and the limiting value of β is 2.0. Equation 7 is therefore much more convenient for small pendant bubbles. Another parameter B may derive from equation 1 and 7 as a function of the ratio x=H/R as shown in equations 8 and 9 as:
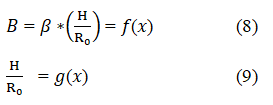
Combining equations 8 and 9 yields:

Therefore, R0 and β are resolute for all values of β <1000 from the measured values of H and R from the profile and equations 9 and 10.
Materials and Methods
Experiment
Chemicals
Oil: Oil sample is obtained from the university of Salford laborty.
API: 20.3 Viscosity: 134.828 Density (g/m3): 0.932 Classification: Medium oil
Arabic gum polymer: Gum arabic from Acacia trees is extracted from the branches of Acacia senegal and Acacia seyal trees. It is an edible, dried, gummy exudate. Gum arabic has high solubility and is used in the food industry as a stabiliser, emulsifier, flavouring agent, thickener and surface finishing agent. It initiates turbidity or hinders sugar crystallization [3]. Gum arabic inhibits colour pigmentation and protein precipitation in wine production.
Silica nano particles: This is a good hydrophilic, suitable for oil systems, and is widely used in plastics, coatings, composite materials, rubber, ceramics and so on (Table 1).
| Name | Appearance | Average particles size | Purity | SSA |
|---|---|---|---|---|
| KH570 processing nano silicon dioxide powder | White powder | 20 nm | 99% | 140.21 m2/g |
Table 1: Types 1 of nanoparticles (Silica) used.
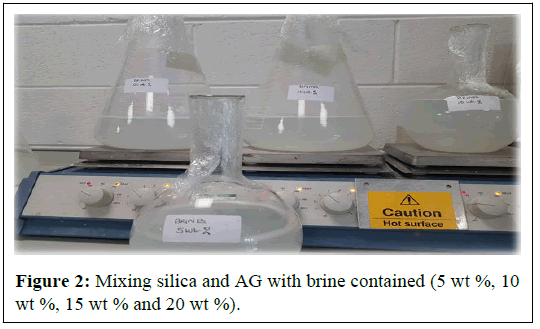
Silica nano particles and arabic gum polymer mixed with brine solation as showing in Figure 2. Brine is prepared from distilled water and sodium chloride purchased from Ajax at various salinity depending on the sources in the oilfield.
Interfacial tension measurement using pendant drop method
Description of IFT apparatus
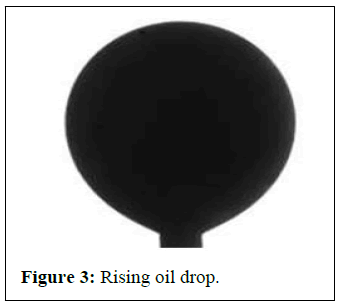
Interfacial Tension (IFT) equipment description and principles: Because of its important role in many technical parts, many tensiometers have been established for the experimental study of IFT between fluid phases interaction. Amid all the several techniques studied by Dorsey, et al., only a few are still being utilised for interfacial tension measurements in fluid liquid interfaces. The most general techniques used today were briefly studied by Drelich, Fang and White, et al. They are also chosen in detail in (Rusanov and Prokhorov, et al. More valuable sources of information on experimental measurement techniques of interfacial tension include. The Pendant Drop (PD) is possibly the most generally used method for measuring the IFT at liquids phase system, due to its simplicity and ease of implementation at a gas-liquid interface under a wider range of pressure and temperature conditions [4]. In the context of the PD technique, a drop of a denser fluid is formed at the tip of a capillary tube and kept in equilibrium with a surrounding less dense fluid (vapour or liquid), and the shape of the drop is subsequently analysed once the profile of the drop or the height of the liquid column is determined, they are combined with pertinent phase density data to obtain interfacial tension values. In the PD the effect of gravity on the shape of a drop of the fixed volume is analysed. In this section, a brief historical and technical discussion of the theoretical background of these techniques are presented, along with a detailed description of the apparatus used in this work to measure the interfacial tension of reservoir fluids over a broad range of experimental conditions. Associated to computer will notice the made drop which is shaped by calibrated capillary in the chamber as presented in Figure 3. The results will then be logged by integrated software.
The parameters will be varied to measure IFT as shown in Table 2. Initial, the combination concentrations are prepared at 0.5, 1.0, 2.0 and 4.0 wt. %. Second, the salinity is set at 5 wt %, 10 wt %, 15 wt % and 20 wt %. Then, the temperature is also varied at 30°C, 35°C, 40°C, 45°C and 50°C. Lastly, pressure would be tested for different values which are 500 to 1500 psi. The operating conditions for this study are presented in Table 2.
| Parameters | Operating conditions |
|---|---|
| Type of surfactant | Combination (silica+GA) |
| Solution concentration (wt %) | 0.55 wt % and 0.50 wt % |
| Salinity (wt %) | 5 wt %, 10 wt %, 15 wt % and 20 wt % |
| Temperature (°C) | 30°C, 35°C, 40°C, 45°C and 50°C |
Table 2: Operating conditions for IFT measurement.
The essential of the rig was a cylinder-shaped made of stainless steel. The volume of the cell is 39 cm3 and is fitted with a glass round window to let photographic observation and footage of the shape of each increased bubble. Using chamber to control the temperature, using the heating element mounted around the cell. The needle is made of the stainless steel insert hole at the bottom of the cell [5].
For measuring the interfacial tension was started by filling the fluid sample cylinder using manual or automatic pump. The pressure of the cylinder was adjusted using manual pump and back pressure regulator. The air source connected to the capillary tube and controlling the with valve to the rising bubble of the suitable size at the top of the capillary tube. Ten measurements were developed for each image captured. Usual value of the interfacial tension values gotten from the bubble profile at each agreed experimental pressure and temperature was stared as the interfacial tension value typical of the present work.
Bubble chamber and vibration control
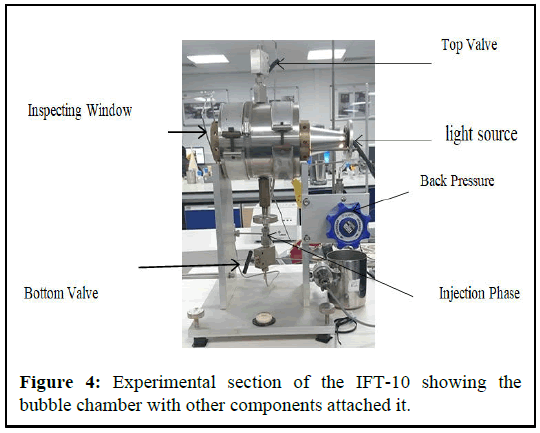
The bubble chamber is the primary section of the system as this is where both the liquid and gaseous sample is meeting each other, to produce the interface. Figure 4 shows the measurement chamber and vibration control table. The chamber was made of stainless steel metal and valued up to 10000 psi at 200℃. The total inside volume of the chamber is 39 cm3, with a sealed port at the bottom for the needle insertion while at the top is the overflow valve and linked to the back pressure controller
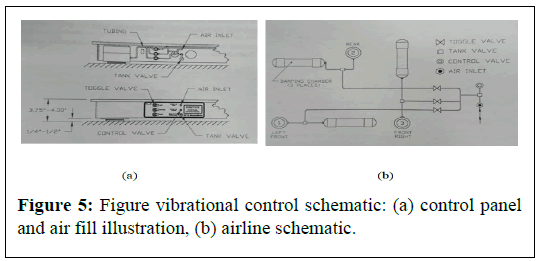
The chamber was mounted and centered on the vibrational control bench mate. The vibrational control bench minimises the error of IFT measurement due to vibration. The platform air (Figure 5).
Mounts of the bench mate are inflated using manual pump according to the schematic as shown in Figure 5.
The front end of the chamber is the viewing window, which allowed the capturing camera to capture and record a live image of the bubble or droplet. While at the back end of the cell is the illuminating light mate, which illuminates the fluid in sight the cell to allow viewing of the inside of the cell.
The bottom of the needle fastens to the lower valve assembly which connected the gas source to the capillary tube. Rotating the knurled stem positions the needle tip into the suitable place in the cell for bubble or drop generation.
Automatic and manual pump
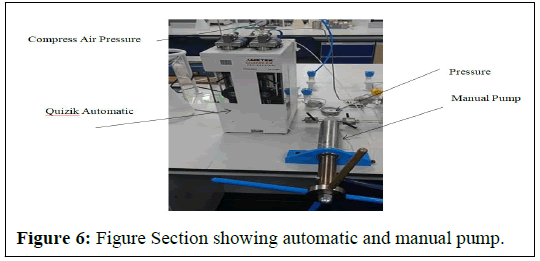
The Figure 6 below shows the automatic and manual pump used during the IFT measurement. The automatic pump is QX series pump (QX-6000), is totally joined, connected to the data achievement system and measured, via Quizix pump works software. It contains a pump controller, which coordinates the activity of two independent, positive displacement piston pumps A and B. These two piston pumps can each be used separately for single stroke volumes, or as a pair to give pulseless continuous fluid flow for a single fluid [6]. It can exert a maximum pressure of 6000 psi, with a maximum flow rate of 50 cm3 per minute, having stroke volume of approximately 12 cm3 and piston diameter of 0.375 in. The manual pump is used for pressure build up in the cell.
The live image capturing camera (Rame-hart)
A visual record of the drop or bubble created inside the cell was captured using a Rame-hart digital video camera mounted outside the viewing chamber of the cell.
Data acquisition system
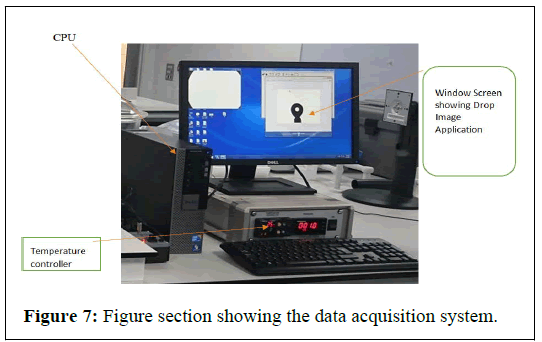
Rame hart camera connected to the PC allowed the supplied the drop image software with the live image for analysis. The suit is attached to the Rame hart camera, which provided the live image of the drop generated in the cell for further analysis using advanced image software (Figure 7).
Experimental procedures
The essential of the rig was a cylinder-shaped made of stainless steel. The volume of the cell is 39 cm3 and is fitted with a round glass window to let photographic observation and footage of the shape of each increased bubble. Using a chamber to control the temperature, using the heating element mounted around the cell. The needle is made of a stainless steel insert hole at the bottom of the cell.
Measuring the interfacial tension was started by filling the fluid sample cylinder using a manual or automatic pump. The pressure of the cylinder was adjusted using a manual pump and back pressure regulator. The air source is connected to the capillary tube and controlled with a valve to the rising bubble of the suitable size at the top of the capillary tube. Ten measurements were developed for each image captured. The interfacial tension values obtained from the bubble profile at each experimental pressure and temperature were used to determine the typical interfacial tension value of the present work.
Steps of experimental procedures
The pendent drop system was employed to regulate the Interfacial Tension (IFT) of the interface between crude oil and brine. This system involved the formation of a small oil drop at the tip of a stainless steel needle that was submerged in the aqueous brine solution. The resulting experimental procedures were followed:
• Run a calibration test first by placing stainless steel ball inside an
empty IFT cell.
• Setting up the imaging system to be ready to take a picture.
• Select the calibration option and run the program to adjust the
horizontal/vertical apex ratio.
• Remove the ball from the IFT cell and fix the camera's position.
• Pump synthetic brine into the IFT cell to full level.
• Pump oil carefully through the bottom needle to get a stable oil drop
on the top of the needle inside the cell.
• Set temperature at reservoir value using temperature control to
obtain temperature equilibrium inside the cell. Use the heating
jackets wrapped around the cell and water bath to control the system
temperature.
• Pump brine into the cell to increase the pressure inside the cell to
reservoir pressure. At the same time, oil should be pumped to keep
the oil drop still on the top of the bottom needle.
• Take pictures of reservoir temperature and pressure.
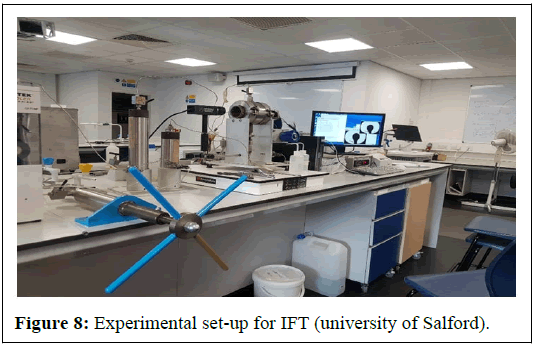
• Run the image drop image program to calculate IFT values (Figure
8).
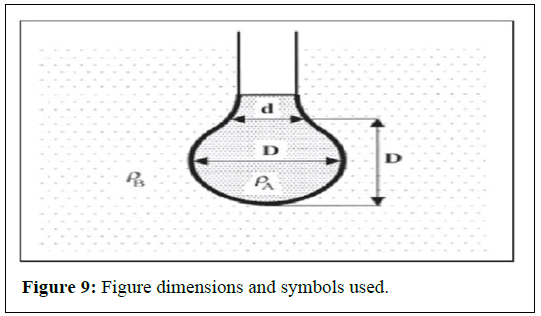
The silica nanoparticles and Arabic gum preparation should be able to decrease water/oil interfacial tension. The pendant drop method measures initial water/oil interfacial tension before brine, silica and Arabic gum reduction. The mechanism behind the pendant drop method is to study the drop shape shaped when the oil meets water, brine, or any fluids through the needle. The figure below shows a pendant drop for interfacial tension measurement (Figure 9).
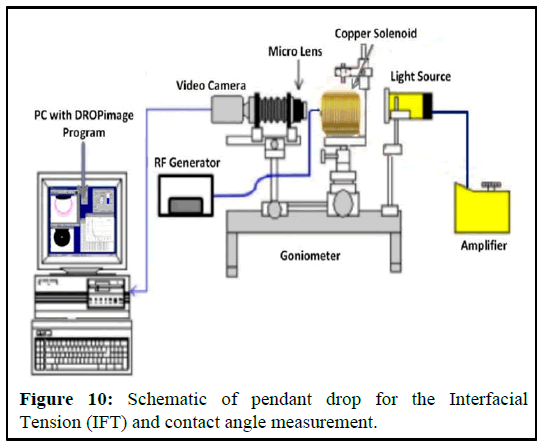
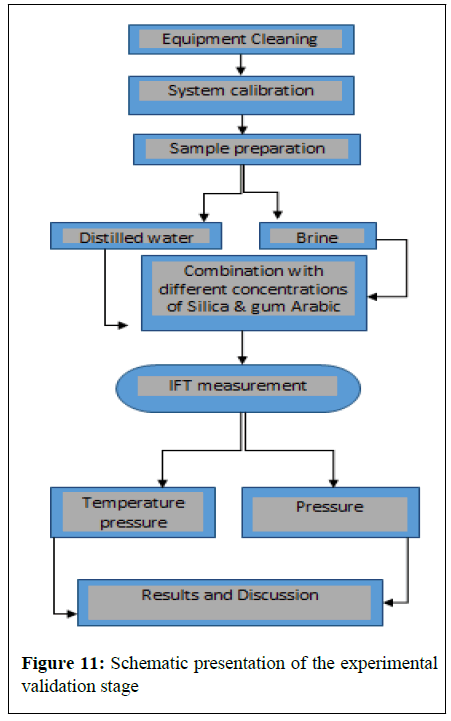
A transparent cell with a needle attached at the bottom is partially filled with water or brine, while oil is injected through a needle into the cell. The cell is filled halfway with water or brine to allow the oil to form a drop. When the oil meets the fluid from the needle, it forms a drop shape. This drop is then captured by a video camera. The cell is positioned so that the oil drop can be properly captured by the camera. The video camera is connected to a computer with drop analyzing software installed. The setup for interfacial tension measurement is shown in the figure below (Figures 10 and 11). Multiple drops are analyzed to obtain accurate measurements of the drop shape. The interfacial tension is calculated from the sizes of the pendant drop. The pendant drop method involves the measurement of the two parameters known as equatorial diameter D and the diameter d of the distance D (equatorial diameter) from the top of the drop. The interfacial tension is then calculated from the equation below.

g=Gravity D=Equatorial diameter H=Shape parameter Ρ=Density
Results and Discussion
Effect of temperature on IFT
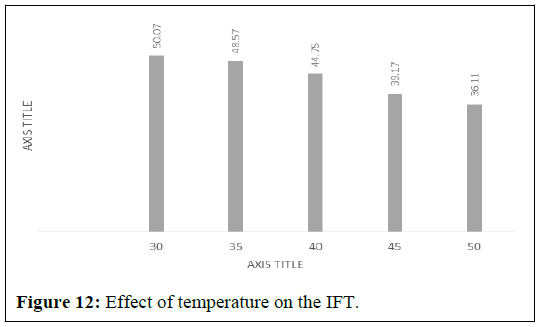
The interfacial tension between dead oil and brine was measured at several temperatures (30, 35, 40, 45 and 50) and pressures (500 to 1500 psig). IFT result at difference temperatures and pressure. A Figure 5 shows plots of IFT versus temperature. Data Figure 12 shows a decrease in IFT of dead oil/brine system with increasing temperature. The decrease of IFT values at higher temperature can be official to the weakening of intermolecular forces at the oil/brine interface.
The Interfacial Tension (IFT) of air was determined by measuring its surface tension against distilled water, brine, and polymer silica solutions. The brine solutions were prepared at various concentrations of NaCl, namely 5, 10, 15 and 20 wt%. Similarly, different sets of combined polymer and silica solutions were tested.
In addition to IFT measurements, the density of the aqueous solutions was also determined and recorded. The results are presented in a tabulated format for easy comparison and analysis.
Air-distilled water IFT
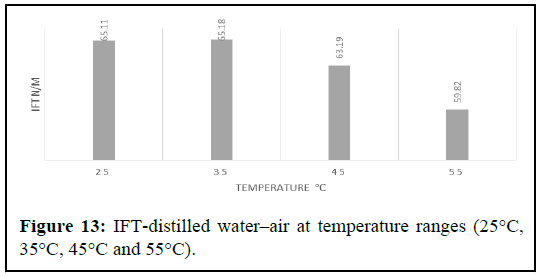
To ensure the accuracy of the investigation, the IFT of the air water system was measured and compared with literature data, as well as with the results obtained from testing other fluid solutions such as aqueous solutions, polymer fluids, silica fluids and combined silica and polymer fluids. The aim of this comparative analysis was to observe the impact of salts and fluid solutions on IFT. In addition, the study also examined the effects of system pressure and temperature by measuring IFT under varying pressure and temperature conditions. The findings of this study have the potential to provide valuable insights into the behavior of the interfacial tension in different fluid systems.
Experiments were performed over a temperature range of 25°C to 55°C and under pressures ranging from 0 to 100 psi. During the experiments, the effects of pressure and temperature were closely monitored and recorded in the final report (Figure 13).
IFT measurement between fluid (brine/Arabic gum/silica) and air
Brine 5%
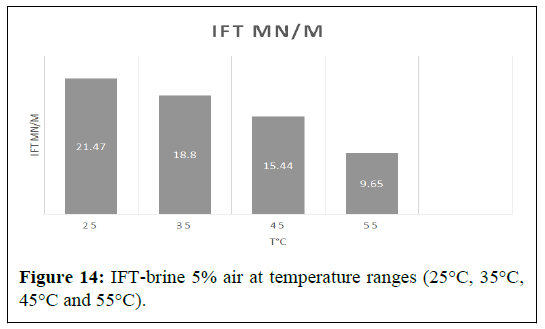
The IFT between air and 5 wt % brine- was 21.47 mN/m at 25℃; it then decreased to 18.80 mN/m at 35°C and to 15.44 mN/m and 9.65 mN/m at 45°C and 55°C respectively. The best results were shown at the lower temperature of 25°C and at the higher temperature of 55°C, where interfacial tension reduced from 21.47 mN/m to 9.65 mN/m, with a reduction almost 55.05 % (Figure 14).
Brine 10%
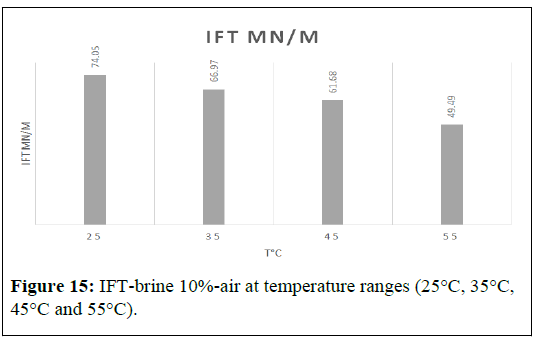
The Interfacial Tension (IFT) between air and a 10 wt% brine solution was measured at different temperatures, namely 25°C, 35°C, 45°C and 55°C. The initial IFT at 25°C was measured to be 74.05 mN/m. As the temperature increased to 35°C, the IFT decreased to 66.97 mN/m [7]. Subsequently, at 45°C, the IFT decreased further to 61.68 mN/m, and at 55°C, it was reduced to 49.49 mN/m. Notably, the most significant reduction in IFT was observed at the lowest and highest temperatures tested, i.e., 25°C and 55°C, respectively. At these temperatures, the IFT decreased from 74.05 mN/m to 49.49 mN/m, which is a reduction of almost 33.61% (Figure 15).
Brine 15%
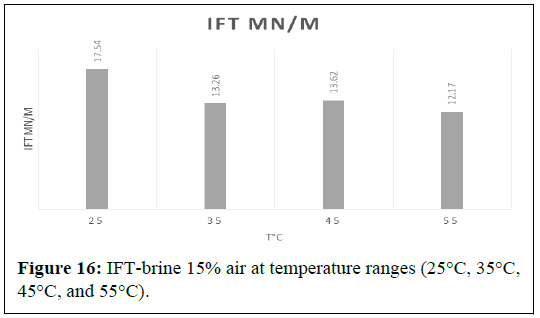
The Interfacial Tension (IFT) between air and a 15 wt% brine solution was measured at various temperatures, namely 25℃, 35℃, 45℃ and 55℃. The initial IFT at 25℃ was recorded to be 17.54 mN/m. As the temperature was increased to 35℃, the IFT quite increasing to 13.26 mN/m. However, at 45℃, the IFT increased to 12.17 mN/m, only to reduce again to 30.61 mN/m at 55℃ (Figure 16).
Brine 20%
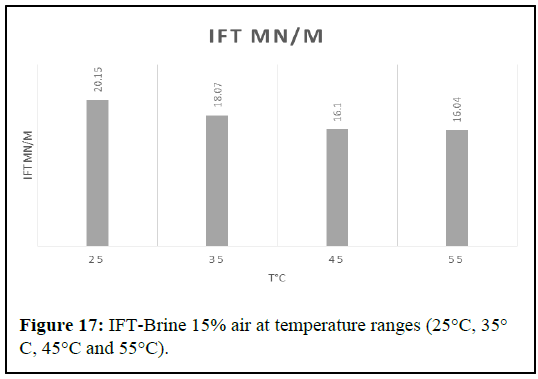
It appears that the IFT between air and 20 wt% brine was measured at different temperatures and the results show that the IFT decreased at higher and lower temperatures. The best results were obtained at 25℃ and 55℃, with a reduction in IFT of almost 20.39%. It is important to note that the IFT values are relatively small, which indicates that the system is favorable for air water displacement. The effect of salinity on IFT was examined by examining the impact of varying concentrations of NaCl. NaCl concentrations of 5, 10, 15 and 20 wt %were used and the outcomes were depicted in (Figure 17).
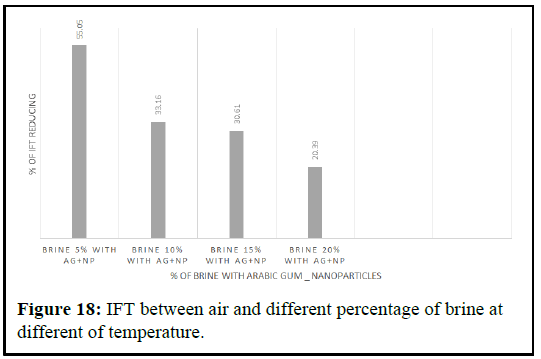
It is important to note that the accuracy of the method used for IFT determination is crucial in ensuring reliable results. Comparing the obtained results with those in the literature helps to validate the method and ensure that the results are consistent and reliable [8]. The impact of pressure, temperature and salt concentration on the behavior of the air water phase boundary is also an important consideration in studying the IFT between air and water, and it is necessary to control and monitor these factors during experimentation (Figure 18).
(IFT) of oil-aqueous solution (combination silica and polymer) two-phase system.
IFT between oil and fluids
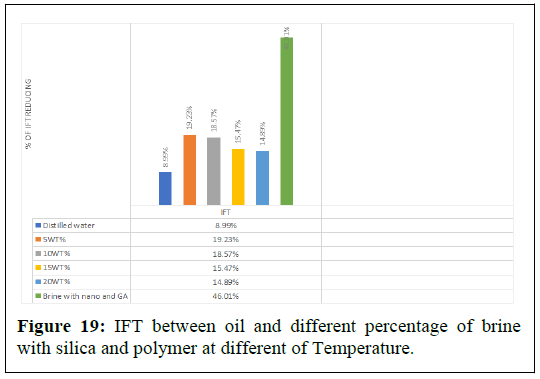
The pendant drop method was used to measure the Interfacial Tension (IFT) between crude oil and nano polymer fluids with varying concentrations, under ambient conditions until a stable IFT value was obtained. The results showed that the presence of polymer silica nanoparticles decreased the IFT between crude oil and brine. The IFT values between crude oil and brine were 19.23%, 18.57%, 15.47% and 14.89%, with decreasing percentages from 19.23% to 14.89% depending on the percentage of brine, as shown in Figures 18 and Table 3. The IFT was reduced to 14.89% with 20% brine, 15.47% with 15% brine, 18.57% with 10% brine and 19.23% with 5% brine [9].
| Aqueous | Distilled water | 5 WT% | 10 WT% | 15 WT% | 20 WT% | Brine with nano and GA |
|---|---|---|---|---|---|---|
| IFT | 8.99% | 19.23% | 18.57% | 15.47% | 14.89% | 46.01% |
Table 3: Effect salinity and combined fluid (AG+NP) with air face on IFT.
Figure 19 illustrates the results of the experiments conducted using a combination of Arabic gum and silica nanoparticles with 5% brine.
The results showed a decrease in Interfacial Tension (IFT) at different temperatures. The reduction in IFT was observed to be almost 46.01%.
Conclusion
In the present work, pendant drop (risen bubble) method was used to measure the IFT for air wate, air brine and fluids (Silica+Arabic gum) system for temperature range (25℃ to 55℃) and pressure constant (1200) psi. The effects of temperature, fluid (Silica+Arabic gum) and salinity (NaCl) on the IFT were confirmed. The results show the importance of IFT during mass transfer of air into the water molecules. The presence of salt (NaCl) indicated a reduction of air dissolution in the water thereby increasing the interfacial area of the air bubble and hence the increase in the IFT. Result of the IFT on silica nanoparticles and gum Arabic polymer at different temperatures to enhanced oil recovery. Brine based nanoparticles with a few different concentrations and distilled water-based nanoparticles with different concentrations were used during the experiment. Additionally, the bubble size also affects the IFT values obtained.
References
- Sheng JJ (2010) Modern chemical enhanced oil recovery: Theory and practice. Gulf Professional Publishing, Elsevier, USA.
- Ahmadi MA, Arabsahebi Y, Shadizadeh SR, Behbahani SS (2014) Preliminary evaluation of mulberry leaf-derived surfactant on interfacial tension in an oil-aqueous system: EOR application. Fuel 117: 749-755.
- Hjelmeland OS, Larrondo LE (1986) Experimental investigation of the effects of temperature, pressure and crude oil composition on interfacial properties. SPE Reserv Eng 1: 321-328.
- Drelich J, Fang C, White CL (2002) Measurement of interfacial tension in fluid-fluid systems. Encycl Surf Colloid Sci 3: 3158-3163.
- Rusanov AI, Prokhorov VA (1996) Interfacial tensiometry. Elsevier, New York.
- Harkins WD, Jordan HF (1930) A method for the determination of surface and interfacial tension from the maximum pull on a ring. J Am Chem Soc 52: 1751-1772.
- Arashiro EY, Demarquette NR (1999) Use of the pendant drop method to measure interfacial tension between molten polymers. Mater Res 2: 23-32.
- Cheng P, Li D, Boruvka L, Rotenberg Y, Neumann AW (1990) Automation of axisymmetric drop shape analysis for measurements of interfacial tensions and contact angles. Colloids Surf 43: 151-167.
- Wu Z, Yue XA, Cheng T, Yu J, Yang H (2014) Effect of viscosity and interfacial tension of surfactant-polymer flooding on oil recovery in high-temperature and high-salinity reservoirs. J Pet Explor Prod Technol 4: 9-16.
Citation: Rashid F, Enyi GC, Nourian A (2024) Experimental Investigation of Chemical Flooding Using Joint Nanoparticles and Polymer on Displacement of Crude Oil with Injection Air Booster for Enhanced Oil Recovery. Oil Gas Res 10: 327.
Copyright: © 2024 Rashid F, et al. This is an open-access article distributed under the terms of the Creative Commons Attribution License, which permits unrestricted use, distribution and reproduction in any medium, provided the original author and source are credited.
Select your language of interest to view the total content in your interested language
Share This Article
Recommended Journals
Open Access Journals
Article Usage
- Total views: 1662
- [From(publication date): 0-2024 - Nov 19, 2025]
- Breakdown by view type
- HTML page views: 1349
- PDF downloads: 313

