Evaluation Scheme for Large Scale Innovation Competition Based on Biostatistical Model
Received: 01-Nov-2023 / Manuscript No. jbtbd-23-121963 / Editor assigned: 03-Nov-2023 / PreQC No. jbtbd-23-121963 (PQ) / Reviewed: 20-Nov-2023 / QC No. jbtbd-23-121963 / Revised: 25-Nov-2023 / Manuscript No. jbtbd-23-121963 (R) / Published Date: 29-Nov-2023 QI No. / jbtbd-23-121963
Abstract
We present an optimized "cross-assignment" program for large-scale innovation contests. The program aims to improve work allocation and fair judging by utilizing the optimal objective function method. Our study found that the two-stage and weighted evaluation schemes are more effective than traditional judging schemes. However, there are still some shortcomings in the current system. To address these issues, we propose an improved two-stage evaluation scheme that normalizes scores with a normal distribution and uses the Borda sorting technique to categorize submissions into five groups for judges to evaluate based on their perceptions. We also detail a method for weighting tied scores to determine final rankings. Testing showed that this approach yields a Normalized Discounted Cumulative Gain (NDCG) of 0.8667, indicating greater fairness and precision in the assessment of submissions.
Keywords
Evaluation program; Normalization of a normal distribution; Borda sorting method; Grey correlation analysis; Analysis of variance
Introduction
One way to improve the effectiveness of the judging program is to establish a standardized evaluation criteria and rubric. This will ensure that all judges are evaluating the submissions based on the same set of criteria, which will increase the fairness and transparency of the process. The criteria should be designed to assess the innovation, feasibility, impact, and sustainability of the solutions presented by the participants. Another approach is to involve a diverse group of judges with different backgrounds and expertise in the judging panel. This will help to mitigate the potential biases that may arise from having a homogenous group of judges. Additionally, it is essential to provide training and guidelines for the judges to ensure that they understand the evaluation criteria and how to apply them consistently. To further enhance the fairness and transparency of the judging process, it may be helpful to implement an anonymous review system. This would allow the judges to evaluate the submissions without knowing the identities of the participants or their affiliations. This can help to reduce any potential biases that may arise from knowing the background of the participants.
Large-scale innovation-based competitions play a crucial role in fostering science, technology, innovation, and entrepreneurship development. To ensure the sustainability of these competitions, it is necessary to conduct research and improve the effectiveness of the judging program. By establishing a standardized evaluation criteria and rubric, involving a diverse group of judges, providing training and guidelines, and implementing an anonymous review system, we can create a fairer, transparent, and credible selection scheme for innovation competitions.
The design and improvement of evaluation programs for largescale innovation competitions have long interested scholars and experts in various disciplines, driven by recent rapid advances in science and technology. In their 2006 co-authored publication, Henry Chesbrough, Wim Vanhaverbeke, and Joel West introduced the concept of open innovation from its inception [1], discussed its implications for competitions, provided a framework for evaluating large-scale innovation programs, and explored the impact of open innovation for matches. Innovation is the result of discovery, and societal progress results from innovation. The evaluation of innovative ideas has generated much debate, and there are ongoing efforts to establish unbiased evaluation methods, including the framework developed by Poetz and Schreier in 2012. Their model emphasizes the importance of involving regular users to achieve diverse innovations [2] while considering feasibility and social impact. You Qinggen [3] have developed a user-friendly evaluation index system for experts, which provide a theoretical contribution to improving the current evaluation indexes. In addition, Changchao and Minglong [4] investigated the feasibility of evaluation using AHP hierarchical analysis, grey cluster analysis, and other algorithms in the "Challenge Cup" start-up project. In particular, for large innovation competitions, such as joint national and provincial competitions, existing programs are typically based on those developed for smaller competitors, which are not practical to use and tend to be inconsistent in large rounds, leading participants to question the results.
This paper will, therefore, focus on the following. For innovation competitions of significant scale, we offer a thorough evaluation process. Our approach encompasses suggesting an ideal "crossdistribution" format for the blind judging phase, refining the calculation of the standard scores to augment the impartiality of the verdicts, and producing an appropriate evaluative framework for resolving contentious submissions.
There are both practical and theoretical implications to our research. These models theoretically improve the current evaluation criteria and suggest a methodology and confidence level for the evaluators assessing the projects submitted to the competition. We have advanced relevant theoretical research by identifying, raising, analyzing, and resolving issues and integrating them into a coherent theoretical research framework based on the work of innovation competitions.
Data
The data utilized in this paper was provided by a large-scale competition based on innovation. Technical term abbreviations, when used, were explained. The language used was clear, objective, and value-neutral, with a formal register. Biased phrasing was avoided. It was divided into three copies, each undergoing two stages of judging. Five experts assessed the entries in the first stage and generated raw and standard scores. The structure of the paper followed the conventional academic sections and maintained consistent author and institution formatting. The text was precise, free from grammatical, spelling, and punctuation errors, and presented a logical flow of information with causal connections between statements. In the second stage, another panel of three experts reviewed the entries, generating raw and standard scores and a concordance score. In the initial phase, the mean scores of the five experts were calculated, and the pieces positioned within the top 16% of all teams were admitted to the subsequent evaluation stage. After reassessing the standard scores and making appropriate adjustments to the standard scores of a few works with significant differences, the standard scores of the five experts in the first stage and the standard scores of the three experts in the second stage will be averaged into four scores. The resulting scores will then be ranked based on the final total scores to establish the ranking of the works. The dataset comprises 3,000 teams and 125 experts. Each piece of work was randomly assigned to five experts in the first stage, while three experts were given in the second stage. The experts worked independently without interacting with one another throughout the process.
Related Work and Methods
Preliminary work
Data cleaning
(1) Processing of missing values: For experts who did not rate some of the data points, we remove individual samples with missing values.
(2) Processing of outliers: Individual samples with outliers are removed from the data. For example, we remove ratings with significant extreme differences in works that did not participate in the second evaluation or that did not win the prize in the second evaluation. We convert the data types to ensure the consistency of our analysis.
(3) Conversion of data types: Convert different styles in the data to the correct data type. For example, "first prize" in the data should be converted to 1, "second prize" to 2, "third prize" to 3 and "did not win" to 0. Consistency should be maintained throughout the processing.
(4) Processing for consistency: Only papers that reached the second stage were considered to allow a comparative analysis of the two locations.
(5) Pre-processing stage: The raw data were technically processed to extract the ten indicators necessary for the model covered by the dataset to establish the evaluation model for this paper. ① the raw score of the first expert in the first evaluation; ② the raw score of the second expert in the first evaluation; ③ the raw score of the third expert in the first evaluation; ④ the raw score of the fourth expert in the first evaluation; ⑤ the raw score of the fifth expert in the first evaluation;⑤ the raw score of the fourth expert in the first evaluation; ⑤ the raw score of the fifth expert in the first evaluation; ⑥ The raw score of the first expert in the second evaluation; ⑦ The raw score of the second expert in the second evaluation; ⑧ The raw score of the third expert in the second evaluation
Cross distribution: For the case of 3,000 teams and 125 judges, where five experts judge each entry, we propose maximizing comparability between judges' scores while satisfying the requirement that at least one judge rules each entry.
The objective function is formulated to increase the comparability between scores from different
Reviewers and satisfy the associated constraints.
(1) The level of expertise of the 125 expert reviewers will remain the same.
(2) Five experts are chosen randomly to assess each submission.
(3) At least one expert reviewer evaluates each submission.
(4) Each reviewer has the same number of reviews for each submission.
Record the binary variables [,], ith denoting the team number from 1-3000 and j denoting the expert number from 1-125. Then the constraints are:
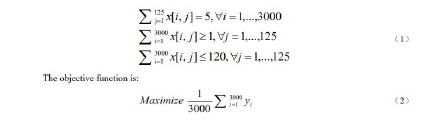
Where represents the size of the intersection between the work of the ith team and the work evaluated by different experts. We calculate the size of each meeting between the entries in the set scored by other experts, and finally, we find the average of these intersection sizes in this objective function. We optimize the allocation scheme by maximizing this average to increase comparability with different expert scores [5].
To further explain, the quantitative relationship in the question is scaled down, as shown in Figures 1 and 2. below, from 3000 teams and 125 experts, each entry rated by five experts, to 200 teams and 15 experts, each entry rated by three experts, which allows us to visually observe the intersection between each expert's sets of entries.

Figure 1: Collection of 3000 entries with 125 expert judges (left).

Figure 2: Collection of 200 entries with 15 expert judges (right).
This allows us to see the intersection of each expert's portfolio, as the scores of entries with significant intersections are more accurate. In contrast, the scores of entries with minor intersections are less convincing. For the reduced set of 200 entries and 15 experts, the number of entries with minor intersections increases, and the number of entries with significant intersections decrease.
Finally, to improve the comparability of the scores given by different experts, the graph should be presented in such a way that the middle part of the set moves to the outer circle to produce a certain number of intersections, and the set in the outer ring spreads out to ensure that there is only a suitable number of intersections.
In the implementation of this process, the current workload of each expert can be guaranteed for the time being under the same conditions. Three thousand works are to be evaluated by 125 experts, each piece to be considered by five experts, then each expert to assess an average of 120 jobs, which not only improves the efficiency of the work of the task but also ensures that each expert works for a consistent period. This not only improves the efficiency of the task but also ensures that each expert works for the same amount of time.
Maximize the collection of works: The proposed scheme is to maximize the intersection between each paper and the set of documents reviewed by different experts, i.e., the gain maximization constraint, if we expect to increase the comparability of the grades given by other reviewers [6].
The specific steps are as follows:
Step 1: Number the 3000 works and 125 experts; for example, the works are numbered from 1 to 3000, and the experts are numbered from 1 to 125. Then, five experts are assigned to each piece for evaluation. Each expert can be selected repeatedly during the assignment because the number of experts is limited.
Step 2: If the experts can be selected repeatedly, resulting in the inconsistency of the number of experts' selection, we adopt the average distribution of the number of works, and the number of jobs assigned to each expert is consistent at 120.
Step 3: With the above constraint, the intersection size between each team and the set of papers evaluated by each expert is calculated using the built-in Python package.
Step 4: Finally, the maximum value of the intersection size between each entry and the set of entries judged by different experts is chosen as the optimal solution to determine the best cross-distribution scheme. That is, the constraint to obtain the objective function of the average value of the intersection size between each work and the collection of outcomes evaluated by different experts is 498. To ensure that the number of works selected by each expert is the same, it can satisfy the maximization of the comparability between the grades given by different evaluation experts [7].
Standard scores: A standardized score is calculated for each data point, where that standardized score is shifted with a mean value of 50. Deals with more significant standard deviations will result in a more extensive range of variation in the normal score.
The formula for this standardized score is then.

Firstly, we calculated the standard score of each entry for the five expert judges in the first stage. The average of these five standard scores was used to determine the score of the entries in the first stage. These scores are then ranked, and the top 16% of entries are selected for the second judging stage. In the second stage, three experts will assess these entries, giving them three separate scores. These scores are converted into standard scores and then adjusted as necessary. At the end of the second stage, a composite score is given for each entry by adding up these three standard scores. The final overall score is the average of the phase 1 standard scores added to the stage 2 composite score, which ranks all entries that have participated in both stages of judging.
Data analysis and modeling: The means of the same factor at different levels are usually various when dealing with experimental data [8]. The overall change in scores between the two stages can be observed by calculating the difference in means between the two stages.In addition, the difference in mean scores
Can be used to quantify the change in work performance between the two assessment levels [9]. The specific steps are as follows:
Step 1: Take the standard scores given by the reviewing experts in the first stage and add them together, then divide by the total number of reviewers to get the average score of the first stage.
Step 2: Take the standard scores assessed by the reviewing experts in the second stage and add them up, then divide by the total number of reviewers to get the average score of the second stage.
Step 3: Calculate the mean difference: subtract the second stage's mean from the first stages.
As can be seen from Figure 3 Stage 1 and Stage 2 have overall fluctuations, and works with high scores in Stage 1 have higher results in Stage 2; on the contrary, works with scores of medium level and below in Stage 1 have lower results in Stage 2 than in Stage 1, and most of them have negative mean differences, indicating that there are differences in the results of the evaluation of Stage 1 and Stage 2.

Figure 3: Comparison Chart of Mean Differences between Stage One and Stage Two.
Analysis of variance (ANOVA): An analysis of variance difference (ANOVA) was performed to determine whether there was a significant difference between the two phases, and the hypothesis to be tested was whether the two-stage review program would produce more reasonable assessment results than the no-stage review program [10].
Specific steps
Step 1: Test the hypothesis
Null hypothesis (H0): No significant difference exists between the two-stage and no-stage review programs.
Alternative hypothesis (H1): A significant difference exists between the two-stage and non-staged judging schemes.
Step 2: Selection of the test method and calculation of the statistics. Paired samples t-test
Step 3: Interpret the results
From the results of the two-stage t-test in Table 1. The first-stage variance is based on the variables paired with the second-stage clash. The significance p-value is 0.000***, which represents significance at the level of rejection of the original hypothesis, so there is a significant difference between the two-stage accreditation program and the nostage accreditation program.
| paired variable | Mean ± standard deviation | t | df | P | Cohen's d | ||
|---|---|---|---|---|---|---|---|
| Pairing 1 | Pairing 2 | Pairwise difference (pair 1 - pair 2) | |||||
| First-stage variance paired with second-stage variance |
33±24 | 28±20 | 5±4 | 6 | 1499 | 0.000*** | 0.18 |
Table 1. Table of two-stage t-test results.
Comparison of two-stage review programs: Figure 4 plotted using Python, shows that most of the differences are harmful and that the two-stage judging scheme has the following advantages over the no-stage judging scheme:

Figure 4: Comparison of the difference between Stage 1 and Stage 2 variances.
Improved consistency: It is expected that scores in the second stage will show improved consistency, indicating that judges are more consistent in their scoring of entries, i.e., subjective variation between judges in the second stage is reduced, resulting in more centered scores within a given range.
Minor differences: The data from Stage 1 showed more significant discrepancies, i.e., more considerable differences in scores between entries. The second judging stage minimized these discrepancies, resulting in more uniform scores between works.
More uniform judging criteria: Stage 2 was assessed with greater stringency, leading to more harmonized scores. The reviewers applied more comparable assessment criteria to the entries in the second stage.
Limiting effect: In certain instances, the assessment standards were constrained during the subsequent phase, culminating in more centralized scores. Finally, the analysis suggests that large-scale innovation competitions tend to follow the standard score as a ranking method, which assumes that the academic level of the works evaluated by each reviewer is similar. However, the number of jointly evaluated papers is limited; each reviewer evaluates only a few documents. As a result, the assumptions underlying the standard review scheme may no longer be applicable.
Establishment of scoring weights based on gray correlation analysis: Grey correlation analysis is a powerful method for handling grey systems and is particularly helpful in assessing correlations among various factors and their impact on a specific objective [11]. To obtain respective weights, we conducted a grey correlation analysis on the scores provided by five experts for each entry in the first round, three for each entry in the second round, and the final overall score. The steps involved in this analysis are as follows:
Data preparation: A table containing each factor should be prepared. Each column represents a single factor, and each row represents a sample.
Data normalization: Data processing should remain neutral. The data should be normalized for each column and transformed into the range [10, 11].
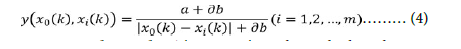
Calculate the correlation coefficient: Calculate the correlation coefficient between each factor and the target by using the selected correlation function. This provides the correlation coefficient of each indicator:
Determine the weights: The experts' weights in both evaluations were obtained after normalization using each expert's grey correlation degree.
The resulting weights assigned to each expert, obtained through grey correlation analysis and related data processing, are shown in Table 2. These weighting measures aim to enhance the precise consideration of each expert's review contribution and thus promote the review process's accuracy and credibility [12].
| Experts in the first review | Expert I in the second review | Expert II in the second review | Expert III in the second review | |
|---|---|---|---|---|
| weights | 0.280 | 0.242 | 0.237 | 0.241 |
Table 2. The weighting of grades in the assessment.
Exploring the average-based judging model: The average-based judging model calculates the final score of the competition by taking the average of the five experts' scores in the first judging and adding the raw scores of the three experts in the second judging. The following assumptions are made:
The raw score dataset in the first judging is represented as X = {1, 2, …, }, where denotes the mark of the ith expert in the first judging.
The raw score dataset in the second review is represented as Y = {1, 2…}, where
Denotes the mark of the ith expert in the second review. The average score of the five experts in the first review is calculated as follows:
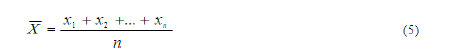
Where (i = 1, 2... n) denotes the original score of the expert in the first evaluation, and average1 indicates the average score of the expert in the initial assessment.
The final score of the two-stage evaluation is calculated as:
Where (i = 1, 2... n) denotes the original score of the expert in the first evaluation, and average1 indicates the average score of the expert in the initial assessment.
The final score of the two-stage evaluation is calculated as:
Z + X + y1 + y2 + y3…… (6)Using software such as Matlab and Excel, the average of the scores of the five experts in the first review can be calculated. Then, the scores of the entries that went into the second review are added to the original scores of the three experts in the second review to obtain the final score of the competition. The partial scores of the final ranking can be seen in Table 3.
| order of precedence | Final scores calculated for the initial assessment scheme |
order of precedence | Final scores calculated for the first evaluation scheme |
|---|---|---|---|
| 1 | 80.76 | 14 | 67.54 |
| 2 | 79.44 | 15 | 67.32 |
| 3 | 79.43 | 16 | 67.16 |
| 4 | 77.15 | 17 | 67.16 |
| 5 | 76.12 | 18 | 67.15 |
| 6 | 73.96 | 19 | 67.02 |
| 7 | 73.35 | 20 | 66.79 |
| 8 | 71.69 | 21 | 66.36 |
| 9 | 70.78 | 22 | 66.11 |
| 10 | 70.70 | 23 | 65.84 |
| 11 | 69.93 | 24 | 65.75 |
| 12 | 68.46 | 25 | 65.46 |
| 13 | 67.77 |
Table 3. Final scores and rankings for the first evaluation scheme.
In judging the competition, the average score method calculates the scores given by several judges. This significantly reduces the disproportionate influence of individual judges on the result and promotes impartiality and fairness. It also allows for combining different perspectives and scores, as judges have additional expertise, experience, and preferences. This leads to a more comprehensive assessment. Finally, averaging the scores of several assessors can reduce the influence of misjudgments or incorrect ratings by individual assessors on the results and increase the accuracy and reliability of the assessment results. In general, the assessment results' impartiality, comprehensiveness, and authenticity can be promoted, and the results of the competition are made more objective and trustworthy by using the average score assessment.
The weighted average-based judging model: In the second evaluation method, grey correlation analysis is used to determine the average of the expert scores from the first evaluation and the four weightings of the original scores provided by three additional expert evaluators during the second evaluation. The weighted average technique derives the final score. The following assumptions are made: The raw score dataset in the first judging is represented as X = { 1, 2, …, }, where
(i=1, 2... n) denotes the mark of the ith expert in the first judging.
The raw score dataset in the second review is represented as Y = {1, 2…}, where
(i=1, 2... n) denotes the mark of the ith expert in the second review. The dataset of weights for each rating is represented as ω= {ω0, ω1... ωn}, where ωi denotes the importance of the i+1th rating in the second review.
Therefore, the average score of the first stage review is calculated as follows:
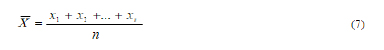
Where (i=1,2,...,n) denotes the original score of the experts in the first review, and average1 indicates the average score of the experts in the first review.
The final score W is calculated as:
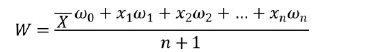
Using Matlab and Excel software, the grey correlation analysis was utilized to determine the average of expert scores from the first review and the four weights of raw scores from the three expert reviews in the second review. The final grades were then obtained through the weighted average method. The sub-scores of the final ranking are shown in Table 4.
| order of precedence | Final scores for the second accreditation program | order of precedence | Final scores for the second accreditation program |
|---|---|---|---|
| 1 | 69.17 | 14 | 61.94 |
| 2 | 68.84 | 15 | 61.90 |
| 3 | 66.97 | 16 | 61.82 |
| 4 | 66.59 | 17 | 61.34 |
| 5 | 66.20 | 18 | 60.98 |
| 6 | 64.94 | 19 | 60.59 |
| 7 | 64.82 | 20 | 60.34 |
| 8 | 64.43 | 21 | 60.31 |
Table 4. Final scores and rankings of the second evaluation program.
To enhance the impartiality of the judging process, we use a weighted average method for our competitions. The judges with more competence and expertise are given a greater weight to influence the final results of the judging process [13]. Only objective judgments are considered, and subjective assessments are explicitly marked as such, helping to ensure that the judges' scores align with the contest's requirements and standards. By assigning a higher weight to the most critical reviewers, the accuracy and reliability of the final judgment can be ensured, as their opinions are more strongly represented. Similarly, weighing the reviewers can consider their respective characteristics, backgrounds, and experience, thus better reflecting the contributions and credibility of the reviewers. This approach allows for adaptive adjustments to specific circumstances, thereby increasing the rationality and reliability of the review results.
We then compare the differential rankings of the two assessment methods to determine their comparative merits, allowing for a fairer, more valid, and more effective assessment.
Comparison of ranking differences in two evaluation models: The rankings of the final grades, which were obtained via separate analyses using both the average and weighted average formulas, were compared to the dataset grade rankings. This percentage difference was used to analyze the grade distribution characteristics for each expert, the original grades allocated for each assignment, and the adjusted grades (e.g., standard scores). In addition, the effectiveness of both methods was compared to determine which way is more advantageous [14].
The average formula calculates the final score as:
= 1+2+…+ + 1 + 2 + … + (9)Where (= 1,2, . . .,)notes the raw score of the expert in the first evaluation, and (=1,2, . . .,) denotes the raw score of the expert in the second evaluation. The weighted average formula calculates the final score as follows:
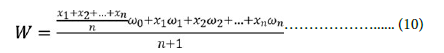
Where ωi denotes the weight of the ith grade.
The final grade, Z, calculated using the average formula, and the last grade, W, computed using the weighted average formula, are sorted. The sorted results are denoted as {1', 2', ..., '} and {1', 2', ..., '}.
To measure the degree of difference between the rankings in the original dataset and the rankings in another dataset, we calculate the difference ratio one and difference ratio 2. The mathematical formulas for these discrepancy ratios are as follows:
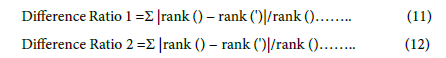
where n denotes the number of grades in the dataset, rank () denotes the rank of the ith quality in the original dataset, (‘) means the rank of the grade in the other dataset that corresponds to the ith grade, and rank(') denotes the rank of the grade ' in the other dataset that corresponds to the ith grade, rank()-rank(')| denotes the ranking difference.
Using software such as Matlab and Excel, the final results obtained from the average and weighted average formulas can be compared with those from the original dataset to calculate the difference ratios. The ranking difference results of the two schemes are shown in Figures 5 and 6.

Figure 5: Difference in ranking for the first evaluation scheme.

Figure 6: Difference in ranking for the second evaluation scheme.
Where the vertical coordinate signifies the variance between the ranking order calculated by the averaging and weighted average methods and the original order, 0 indicates no differences, a negative number indicates a descending ranking order and a positive number indicates an ascending ranking order. From the graph provided, it can be inferred that the first scoring scheme shows a percentage difference in ranking of approximately 0.57%. The second scoring scheme offers a difference of roughly 0.28%. It is worth noting that the percentage difference in the order of the second scoring scheme is lower than that of the first. In other words, the percentage difference in charge of the weighted average method is lower than that of the middle way.
The analysis of the means, extremes, and variances produced by the two methods and the comparison with Table 5 shows that the extremes and variances of the first evaluation method exceed those of the second. It is understood that minor extreme deviation and variance indicate a narrower range of data values, resulting in more minor differences between data points and more stable data that is less susceptible to outliers and closer to the mean. This indicates better consistency between the data and the scoring criteria.
| The first accreditation program | The second evaluation program | |
|---|---|---|
| Mean | 50.63 | 50.89 |
| Extreme Deviation | 34.73 | 34.24 |
| variance (statistics) | 34.92 | 33.69 |
Table 5. Comparison of the parameters of the two review programs.
To sum up, the second model of the scoring scheme appears superior to the first. After analyzing and discussing different models, we have narrowed our focus to whether the subjective views of the experts influence the review results. This has led to the development a two-stage scoring process aimed at optimizing the review process and minimizing the influence of human factors on the final results. This has led to the product of a two-stage scoring process aimed at optimizing the review process and minimizing the impact of human factors on the final results.
Controlling subjective factors experimental design
With judges applying their independent criteria, innovation competitions suffer from inconsistent scoring. Lenient judges may award higher scores, while stricter judges award lower [15]. Contributing to this subjectivity is the lack of clearly defined examlike criteria. The study found that the main influences on the subjective rating of the index are emotional factors related to the subject and object of the assessment, the methods, and mechanisms used in the evaluation and that the expert's ability to judge is not reflected in the actual rating [16]. To improve the evaluation process, a more impartial method should be used. We conducted a hypothesis test to confirm the accuracy of our assumption, and the results confirmed our hypothesis. The first stage of the scoring process uses the normal distribution of judges' scores for standardization purposes. This method removes the influence of the judges' subjective opinions, thus ensuring fairer and more objective scores [17]. Therefore, the independent criteria of each judge no longer affect the scores but rather align with the distributional characteristics of standard normal distribution, enhancing consistency and fairness. In addition, a new ranking approach based on the Borda sorting method has been applied to rank the entries in the second round of judging [18].
Establishment of nonlinear programming model: A comprehensive two-stage integration method has been proposed [19]. In the first stage of the evaluation, the scoring results of each expert are analyzed employing a normal distribution. Then, the distribution is normalized to ensure that each expert adheres to the same scoring criteria [20]. In the second stage, we have adopted a new categorization approach based on the Borda method [21,22]. The main objective is to categorize the works submitted for the second evaluation into five ABCDE grades: A has 5 points, B has 4 points, C has 3 points, D has 2 points, and E has 1 point. Each work is evaluated by three experts who assign a grade according to the content of the work and the corresponding score. They then sum up the total scores of all the pieces. Each submission is evaluated by three experts who assign grades based on the quality of the content and subsequently provide corresponding scores. The final score is then calculated by summarising the individual scores given by each expert. The maximum number of points that can be obtained is 15, while the minimum is 3. Innovation competitions, such as modeling contests, generally list the first, second, and third prizes without ranking. Therefore, the works need to be sorted for segmentation. Results are divided into different phases during the segmentation process if they score similarly. At this point, the second weighting can be applied [23,24]. Firstly, the weight of the scores from the three expert judges is obtained. Then, the weighting is multiplied by the corresponding scores and added up. By doing so, different total scores are accepted, and the highest score is considered a reasonable and fair ranking. This segmentation makes it easier to identify the winning entries in creative competitions. It also ensures that the judging aligns with the predetermined award standards [25].
For better modeling in the second stage of judging, we have made the following assumptions and limitations:
Limitations
1. Each work is scored by three experts and categorized into five grades: A, B, C, D, and E.
2. The scores of the works are calculated based on the scores corresponding to the grades.
3. The total score of the work is the sum of the scores rated by the three experts.
4. The total score of the work is within the range [Tmin, Tmax].
5. The works are ranked according to the total score, with the highest score being the first place.
6. The entries are segmented based on their total scores to determine the first, second, and third-place entries.
The specific flowchart of the two-stage judging program is shown in Figure 7.

Figure 7: Model building flowchart.
In this flowchart:
First, let () represent the probability density value at a given. Represents the mean, represents the standard deviation, represents the circumference, and Exp represents the natural exponential function normalized as follows [26].
Let represent the transformed random variable, represent the original customarily distributed random variable, μ represent the mean of the original random variable, and present the standard deviation of the original random variable. The normalized average distribution formula is as follows:
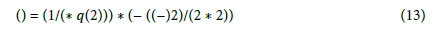
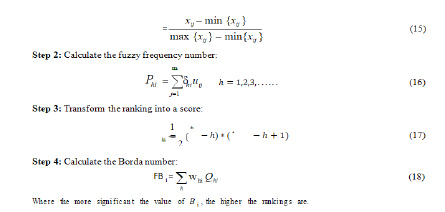
Finally, the Borda ranking method is divided into the following five main steps:
Step 1: Calculate the degree of affiliation. Can be expressed as the result of the jth evaluation method of the ith review expert. It is a simplistic normalization:
Results and Discussion
To ensure the fairness, impartiality, and scientific validity of the judging process in the innovation category of the competition, we investigate whether the subjective evaluations of the experts affect the judging results. As a result, we have designed a two-stage scoring system consisting of standard distribution standardization and a Borda ranking-based sorting method. This approach allows us to optimize the judging process and reduce the potential influence of human factors on the final decision [27]. We implemented a two-stage scoring scheme using Matlab based on competition scoring data. In the first stage, we normalized the scores using the normal distribution. To achieve this, we calculated the normal distribution of each judge's score and obtained the normalized result. The figure below shows the normal distribution of some judges' scores and the resulting normalization process. Four judges (P005, P022, P127, and P230) were randomly selected from a pool of 125 experts. As can be seen in Figure 8, their scores met the criteria for a normal distribution [28]. This procedure aimed to establish consistency in the scoring criteria of each expert. Figure 8 shows the normalization of the experts' scores in the first review. This was achieved by standardizing the distribution. Figure 9 shows the results of the first review, which involved developing ratings and league tables. By standardizing the scoring process, we were able to eliminate scoring bias. By standardizing the scores, we stopped the discrimination by making the scores follow a standard normal distribution. This process ensured that the scoring results would be fair by removing the bias caused by different scoring criteria.

Figure 8: Normal Distribution of Ratings of Selected Experts in the First Review.

Figure 9: Normalization of the Normal Distribution of Selected Expert Ratings in the First Review.
As shown in Figure 10, we have obtained the scores and rankings from the first round of evaluations. By standardizing the scores, we successfully eliminated the bias in the scoring. Bias in scoring can occur due to different judges or scoring criteria, resulting in unfair scoring results. By normalizing the scores using a normal distribution, we transformed the scores into a standard normal distribution, eliminating the bias caused by different scoring criteria and ensuring a fairer scoring result [29].
Assumptions |
Symbolic representation |
|---|---|
Collection of works |
w = {w1, w2, ..., wn} |
Expert rating scale |
R = {A, B, C, D, E} |
Expert rating score |
S = {5, 4, 3, 2, 1} |
Weights of entries |
ω= {ω1,ω2,ω3} |
Number of works |
N |
Number of experts |
m (assumed to be 3) |
Maximum score of an entry |
Tmax = 15 |
Minimum score for an entry |
Tmin = 3 |
Table 6: Symbolic representation.

Figure 10: Ranking table of scores after normalization in the first review.
In the second stage of the evaluation, we implemented an improved approach based on the Borda ranking method, as illustrated in Figure 11. We obtained the final results of the second round of evaluations through this new ranking method based on the Borda ranking method. Since the competition adopted a two-stage evaluation model, this represents the review's outcome. We can observe the ranking and positions of each team. To prove the validity of our sorting method and model, NDCG Normalized Discounted Cumulative Gain (NDCG) is used for validation. The value of NDCG ranges from 0 to 1, where 1 indicates the best sorting result, and 0 indicates the worst. Higher NDCG values indicate better sort quality and lower NDCG values indicate poorer quality [30]. In general, the following general guidelines can be used to evaluate NDCG values:

Figure 11: Ranking of scores in the second review.
When 1>NDCG ≥ 0.8, it is an excellent sorting result;
When 0.8>NDCG≥0.6, it is a good sorting result;
When 0.6>NDCG≥0.4, it is a fair sorting result;
When 0.4>NDCG≥0, it is a poor sorting result.
We calculated the NDCG result of the reordering model for the second judging by Matlab as 0.8667>0.8, which means that our proposed new ordering model will get an excellent ordering result in the judging process.
This paper proposes a more streamlined judging technique that divides the competition judging into two phases and implements different judging methods. First, we applied a standardization technique using a normal distribution to evaluate the scores of each judge. This ensured that the judges had identical scoring criteria,thereby increasing the impartiality of the scoring. The first judging stage was crucial, enabling many outstanding teams to be selected. The second stage of the judging process was introducing a new judging method based on the Borda method. The entries were divided into five levels, with the judges assigning a score to each group based on their judgment. This method ensures that the evaluation process is fair and objective. The final ranking of each entry was determined by the total number of points it received. When multiple entries receive the same score, a weighting process increases the accuracy and fairness of the final ranking results. In addition, our methodology shows practical solid performance. It has been validated by NDCG scores, which confirm the successful control of subjective factors and the production of quality ranking results in the judging scheme. This ensures a fair and accurate judging process. It also guarantees a reasonable ranking of competition entries.
Future Work and Improvements
The judging scheme proposed in this study for large-scale innovation contests can be applied to innovation contests and various other large-scale assessments and evaluations, such as art tests, exams of multiple levels, and elections of public officials, while achieving a more equitable level of accuracy. Its benefits are the enhancement of impartiality, consistency, and objectivity throughout the assessment process. Implementing and designing large-scale innovation competitions is a complex process influenced by several factors that impact each other. This paper focuses on controlling subjective factors that influence the scoring of entries and only provides solutions for controversial entries. To ensure the quality and longevity of competitions, further research into additional features for factor analysis is necessary, and a continued focus on improving the judging scheme is imperative.
Conflict of Interest
We have no conflict of interests to disclose and the manuscript has been read and approved by all named authors.
Acknowledgments
This work was supported by the Philosophical and Social Sciences Research Project of Hubei Education Department (19Y049), and the Staring Research Foundation for the Ph.D. of Hubei University of Technology (BSQD2019054), Hubei Province, China.
References
- Chesbrough HW, Vanhaverbeke W, West J (2006) Open Innovation: Researching a New Paradigm. Wim Vanhaverbeke 84:1259-1262.
- Poetz M K, Schreier M. The Value of Crowdsourcing: Can Users Really Compete with Professionals in Generating New Product Ideas. Journal of Product Innovation Management 29: 245-256.
- You Qinggen (2014) Research and Implementation of Expert Selection Model for WISCO Research Project Review. Huazhong University of Science and Technology 32: 56-60.
- Kim Y, Kim Y, Kim J (2009) Boosting on the functional ANOVA decomposition. Statistics & Its Interface 2:361-368.
- Kannemann K (2010) The Exact Evaluation of 2-way Cross-classifications: An Algorithmic Solution. Biometrical Journal 24:157-169.
- Song Yonghao, Shi Xiao, Hu Bin (2018) Team Building Algorithm Based on Multi-Objective. Greedy Strategy for Gain Maximization. High Technology Communications 28: 279-290.
- Mielik Inen T, Ukkonen E (2006) The Complexity of Maximum Matroid-Greedoid Intersection and Weighted Greedoid Maximization. Discrete Applied Mathematics 154: 684-691.
- Jia Tianli (2005) Hypothesis Analysis Model of the Causes of Mean Differences. Mathematics Practice and Understanding 64: 212-215.
- Daoji S (1988) An analysis of variance test for the extreme value distribution. Tianjin Daxue Xuebao, 1988:116-121.
- Shapiro SS, Wilk MB (1975) An analysis of variance test for normality (complete samples). Biometrika 67:215-216.
- Guohong S, Zhenhui Z (1999) Application of Gray Correlation Analysis in Fault Tree Diagnosis. China Safety Science Journal 30: 1505-1507.
- Liu G, Yu J (2007) Gray correlation analysis and prediction models of living refuse generation in Shanghai city. Waste Management 27:345-351.
- Ginsburgh, Victor, Juan D, Moreno-Ternero (2022) The Eurovision Song Contest: voting rules, biases and rationality. Journal of Cultural Economics 47.2: 247-277.
- Looney, Marilyn A (2004) Evaluating Judge Performance in SportJournal of Applied Measurement. 5:31-47.
- Cliff, Margaret A, Marjorie C King (1996) A proposed approach for evaluating expert wine judge performance using descriptive statistics. Journal of Wine Research 7.2: 83-90.
- Wang Yonglin (2017) Subjective Indicators in Educational Evaluation and Factors Affecting Their. Judgment. Education Science 33: 14-19.
- Xu Kai (2017) Exploration and Research on Retrospective Evaluation Selection Method Based on Peer Review Experts. Beijing University of Chinese Medicine 7:47-50.
- Ryo I, Kazumasa O (2022) Borda Count Method for Fiscal Policy: A Political Economic Analysis. The Institute of Comparative Economic Studies Hosei University 36:25-40.
- Chen Yuan (2011) Research on Decision-Making Methods for Scientific Fund Project Review and Selection. Northeastern University9:23-26.
- Lee SM, Kim KH, Kim EJ (2012) Selection and Classification of Bacterial Strains Using Standardization and Cluster Analysis. Journal of Animal Science and Technology 32:54-56.
- Zheng Rui (2015) Ranking Risk with Borda Method. Enterprise Reform and Management 32: 154-156.
- Orouskhani M, Shi D, Cheng X (2021) A Fuzzy Adaptive Dynamic NSGA-II with Fuzzy-Based Borda Ranking Method and its Application to Multimedia Data Analysis. IEEE Transactions on Fuzzy Systems 29:118-128.
- Tang Huanling, Wang Jingdong, Lu Yuchang (2004) A New Weight Allocation Strategy to Reduce Similar Topic Classification Errors. Computer Engineering and Applications 58: 185-188.
- Wang Zeyan, Gu Hongfang, Yi Xiaoxin, Zhang Shenru (2003) A Linear Combination Weighting Method Based on Entropy. Systems Engineering Theory and Practice 69: 112-116.
- Kilgour, Marc D, Grégoire (2021) Correction to: Weighted scoring elections: is Borda best. Social Choice and Welfare 58:1-2.
- Pierrat L, Samuel K (2013) Standardization of the Logistic Distribution based on Entropy. International Journal of Performability Engineering 9:352-354.
- Ke Nianri, Zhang Chaomo, Wang Yingwei (2010) Application of Normal Distribution Method in Well Logging Curve Standardization in M Oilfield. Journal of Yangtze University (Natural Science Edition), 7: 76-78.
- Aroian, Leo A (1996) Handbook of the Normal Distribution. Technometrics 25:112-115.
- Taylor M (2008) Soft Rank: Optimising Non-Smooth Rank Metrics. Inproceedings 2008:77-86.
- Jian W, Qianqian M, Hu-Chen L (2021) A meta-evaluation model on science and technology project review experts using IVIF-BWM and MULTIMOORA. Expert Systems with Applications 36: 68-70.
Indexed at, Google Scholar, Crossref
Indexed at, Google Scholar, Crossref
Indexed at, Google Scholar, Crossref
Indexed at, Google Scholar, Crossref
Indexed at, Google Scholar, Crossref
Indexed at, Google Scholar, Crossref
Indexed at, Google Scholar, Crossref
Indexed at, Google Scholar, Crossref
Indexed at, Google Scholar, Crossref
Indexed at, Google Scholar, Crossref
Indexed at, Google Scholar, Crossref
Indexed at, Google Scholar, Crossref
Citation: Zhao B, Jiang X, Mou J (2023) Evaluation Scheme for Large ScaleInnovation Competition Based on Biostatistical Model. J Bioterr Biodef, 14: 358.
Copyright: © 2023 Zhao B, et al. This is an open-access article distributed underthe terms of the Creative Commons Attribution License, which permits unrestricteduse, distribution, and reproduction in any medium, provided the original author andsource are credited.
Share This Article
Recommended Journals
Open Access Journals
Article Usage
- Total views: 904
- [From(publication date): 0-0 - Apr 11, 2025]
- Breakdown by view type
- HTML page views: 695
- PDF downloads: 209