Research Article Open Access
Evaluation of the Speciation Patterns and Risk Assessment of Some Heavy Metals within Victoria Island, Lagos, Nigeria
Okafor OF*, Okoye PAC, Umeobika UC and Abugu HO
Department of Pure and Industrial Chemistry, Nnamdi Azikiwe University, Anambra State, Nigeria
- *Corresponding Author:
- Okafor OF
Department of Pure and Industrial Chemistry
Nnamdi Azikiwe University, Awka
Anambra State, Nigeria
Tel: +2348063498395
E-mail: feloksys@gmail.com
Received date: October 31, 2015 Accepted date: November 19, 2015 Published date: November 26, 2015
Citation: Okafor OF, Okoye PAC, Umeobika UC, Abugu HO (2015) Evaluation of the Speciation Patterns and Risk Assessment of Some Heavy Metals within Victoria Island, Lagos, Nigeria. Ind Chem Open Access 1:111. doi: 10.4172/2469-9764.1000111
Copyright: © 2015 Okafor OF, et al. This is an open-access article distributed under the terms of the Creative Commons Attribution License, which permits unrestricted use, distribution, and reproduction in any medium, provided the original author and source are credited.
Visit for more related articles at Industrial Chemistry
Abstract
Sequential extraction was carried out to determine the speciation and mobility of total and potentially bioavailable heavy metal concentrations in the soil of Victoria Island, Lagos. The soil samples were collected from four strategic locations within Victoria Island, Lagos. Samples were tested for their total metal concentrations of nine selected heavy metals using Atomic absorption Spectrophotometer (AAS) and Energy Dispersive X-ray fluorescence (EDXRF). The metals analysed include Mn, Cu, Fe, Pb, Cd, Cr, Ni, Zn and Co. Target extraction fractions includes; water soluble, Carbonate bound, exchangeable, bound to iron and manganese oxide, bound to organic and sulphide and residual fraction. This was undertaken to assess the environmental fate of these trace metals. The modified form of the Tessier method of sequential extraction was used. The proportion of the mean metal concentrations of the bio-available metals follows the order Cr>Ni>Cu>Zn>Pb>Mn>Co>Fe>Cd. From the trend, it is evident that the results revealed that iron though with the highest concentration at Victoria Island, is the second to the least bioavailable metal in the location, about 32% was found in its bio-available form. Although Cd contributed least to the bio-available content, a percentage of about (30%) was found in the bio-available fraction. Cr has highest percentage Bioavailability of about (53%) for Victoria Island while that of Ni is about (55%). This suggests that Cr, Ni, Cd and Pb were highly mobile and, since it is known to be toxic, its concentration in the bio-available form constitutes an environmental threat. The contribution of metals bound to residue was found to be high; that is about 60% of the non-bio-available metal contents. From statistical treatment, a correlation was drawn between the two array of data generated from the two different methods i.e., AAS and EDXRF used for analysing total selected metals; giving rise to a correlation coefficient of 0.9928. From the result, it can be deduced that both methods are invaluable in elemental analysis and environmental study because they showed neither significant difference nor variation.
Keywords
Heavy metals; Speciation; Fractions; Soil; Pollution
Introduction
In an effort to improve our way of living through increasing industrialization and human activities, we release some chemical, physical, biological substances into the ecosystem. These substances tend to accumulate in the ecosystem to certain concentrations that they distort ecological balance thus becoming harmful to life; this is called pollution. However, some of these substances often referred to as pollutants become harmful even at minute concentrations [1].
Health consequences from exposure to soil contamination vary greatly depending on pollutant type, pathway of attack and vulnerability of the exposed population. Chronic exposure to chromium, lead and other metals, petroleum, solvents, and many pesticide and herbicide formulations can be carcinogenic, can cause congenital disorders, or can cause other chronic health conditions. Industrial or man-made concentrations of naturally-occurring substances, such as nitrate and ammonia associated with livestock manure from agricultural operations, have also been identified as health hazards in soil and groundwater [2].
Chronic exposure to benzene at sufficient concentrations is known to be associated with higher incidence of leukemia. Mercury and cyclodienes are known to induce higher incidences of kidney damage, some irreversible. PCBs and cyclodienes are linked to liver toxicity. Organophosphates and carbamates can induce a chain of responses leading to neuromuscular blockage. Many chlorinated solvents induce liver changes, kidney changes and depression of the central nervous system. There is an entire spectrum of further health effects such as headache, nausea, fatigue, eye irritation and skin rash for the above cited and other chemicals. At sufficient dosages a large number of soil contaminants can cause death by exposure via direct contact, inhalation or ingestion of contaminants in groundwater contaminated through soil [3]. Soil is the reservoir for many harmful constituents, elemental and biological, including heavy metals and trace metals, henceforth referred to as just metals [4].
The evaluation of heavy metals pollution of soils as a means of monitoring the status of the environment for the good of the ecosystem is crucial because of these increasing domestic and industrial activities of man [5]. Total metal content of soils is useful for many geochemical applications but often the speciation (bioavailability) of these metals is more of an interest agriculturally in terms of what is biologically extractable. Speciation is defined by Tack and Verloo as “the identification and quantification of the different, defined species, forms or phases in which an element occurs” and is essentially a function of the mineralogy and chemistry of the soil sample examined.
In Nigeria, the major sources of heavy metals pollution are industrial effluents discharged from various processing industries, and untreated waste dumping. This increases the influx of metals in the soil, which can be transported and taken up by plants and animals either as inorganic salts or as organometallic derivatives [1]. These heavy metals attain higher concentrations and accumulate in dangerous quantity in different plant and animal parts, and finally pose serious health hazard to human beings and the animals through biomagnifications.
The lagoons and creeks of South Western Nigeria are linked to the sea through the Lagos harbour [6]. Owing to seasonal distribution of rainfall, the lagoon system and creeks experience seasonal flooding which introduces a lot of detritus, nutrients as well as pollutants from land. Such pollutants arising from land based activities include domestic and industrial effluents, urban storm run-off; agricultural land run- off, shipping activities; coastal habitat modification coupled with contaminants from garbage and solid waste dump [7]. This study is aimed at assessing the heavy metal load and the risk level at this location.
Materials and methods
Materials
Materials used for the experiment include; Mettler analytical balance, elenmeyer volumetric flask, Bosch oven, measuring cylinder, beakers, AAS equipment (Buck Scientific Model), XRF (Twin-x Oxford Equipment model), fume cupboards, plastic sample bottles, universal indicator paper, glass policeman (stirrer).
Reagents
The reagents used were of analar grade, certified by American Chemical Society (ACS). They include; Deionised water, Hydroflouric acid, 3.2M Ammonium acetate, 25% v/v Acetic acid, 1M Sodium acetate, 30% Hydrogen peroxide, Aqua regia, 0.02M Nitric acid, 1M Boric acid, Hydrochloric acid, 0.04 Hydroxylamine.
Study location
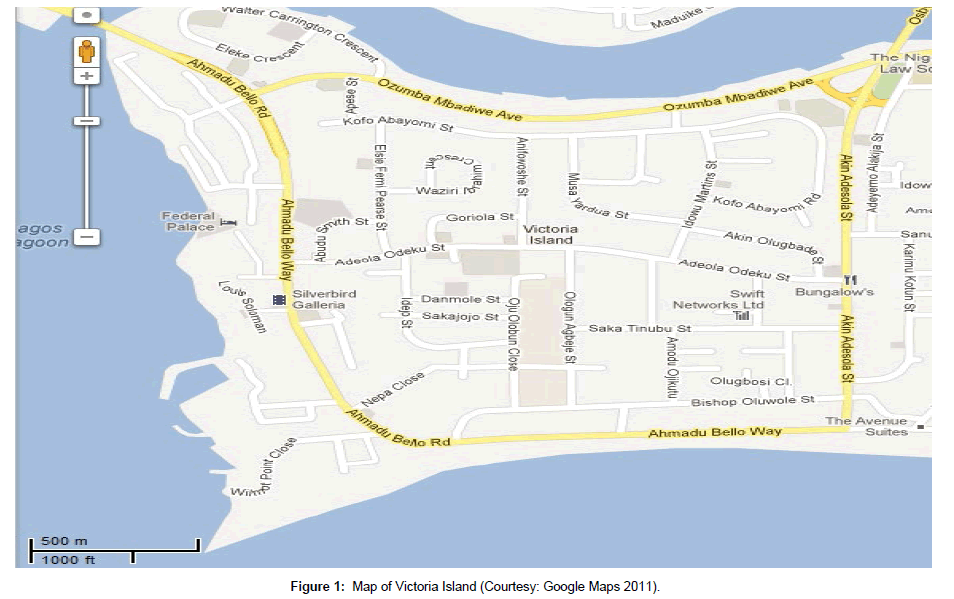
Four soil samples were collected from within Victoria Island and were properly labeled for easy identification and reference. The sampled locations are: Ahmadu Bello way Bar beach (SSV 1), Adeola Odekustreet (SSV 2), Ozumba Mbadiwe Avenue (SSV 3) and Kofo Aboyomi Street (SSV 4). Several Soil samples from sub-surface were carefully collected from each of the mentioned locations. The samples were mixed together in order to produce a representative composite sample and was stored in a dry polythene bag. Samples were immediately transported to the laboratory where loose particles and plants debris were removed manually from the soil prior to chemical treatment. Sampling was limited to Victoria Island only (Figure 1).
Moisture content
5 g weights approximately each of the soil samples was measured in a glass dish and placed to dry in the oven at temperature of 55°C for about 24 h. The weight measurements taken include, W1, weight before drying, W2, weight after drying, M, moisture content and M% percentage moisture were recorded.


Determination of pH
Approximately 5 g weight of the soil samples was measured and equilibrated for about 30 minutes in a thoroughly washed and dried beaker containing 20 ml of deionised water. The pH values were determined and recorded.
Sample pretreatment
The sorted dried soil samples were then ground to fine powdered form using an agate mortar and pestle leaving particle sizes in the nanometres range thus increasing the surface area, which ensure the homogenization of the test samples and also to enhance the samples to be in suspension in the mixture during the extraction processes for optimum extractability. Each of the test samples was divided into two portions; one part was for determining total concentrations of the metals in the soil samples using energy dispersive X-ray fluorescence, while the other part was used for the extraction scheme.
Digestion and extraction
Total metal analysis: 1 g approximate weight of the soil sample was placed into a Teflon container and digested by addition of 5 ml HF and 5 ml aqua regia, and heating on a water bath for one and half hours in a fume cupboard. After allowing it to cool, fresh equal volumes of HF and aqua regia, 5 ml each, was added and digested again for another one and half hours heating on the water bath. 20 ml volume of saturated boric acid (H3BO3) was added on cooling after the final digestion process to complex the residual hydrofluoric acid (HF) which otherwise, would attack glass wares made of silicates. The digested samples were filtered with whatman No.1 filter paper to obtain a residue-free product and were made up to mark of the sample bottles used for storage before AAS analysis.
The dry soil samples were analysed using the Energy Dispersive X-Ray Fluorescence (EDXRF) to determine the total concentration of the metals (pollutants) in the soil samples.
Sequential extraction [8]
a) Water soluble fraction: To 1 g weight of soil sample, 10 ml of deionised water was added in a 50 ml Teflon centrifuge tubes and agitated for 30 minutes before centrifugation and decantation into the sample bottles for storage. Subsequent series of washing with 10 ml of deionised water was done to make up to 50 ml mark of the sample bottles.
b) Exchangeable fraction: To the residue from previous leach, 8 ml of 1M sodium acetate (NaOAc pH 8.5) was added and agitated for one hour at room temperature before centrifugation and decantation. The residue was washed with deionised water and 4 ml of aqua regia added to the liquid sample taken for mark of the sample bottles.
c) Exchangeable fraction: To the residue from previous leach, 8 ml of 1M sodium acetate (NaOAc pH 8.5) was added and agitated for one hour at room temperature before centrifugation and decantation. The residue was washed with deionised water and 4 ml of aqua regia added to the liquid sample taken for analysis before making up to 50 ml mark of the sample bottles with deionised water.
d) Carbonate-bound fraction: To the residue from previous leach, fresh 8 ml 1M sodium acetate solution (adjusted to pH 5 with acetic acid) was added and agitated for one hour at room temperature before centrifugation and decantation. The residue was washed with deionised water while 4 ml aqua regia was added to the liquid sample taken for analysis and made up to mark with deionised water.
e) Fe-Mn oxide fraction (Reducible): To the residue from previous leach, 20 ml 0.04M NH2OH.HCl in 25% v/v acetic acid was added and agitated periodically in boiling water bath for 5 hours. The residue was washed with deionised water after centrifugation and decantation. The liquid sample obtained for analysis was added 4 ml of aqua regia and made up to the mark.
f) Organic and sulfide fraction (Oxidizable): To the residue from previous leach, 3 ml 0.02M HNO3 and 5 ml of 30% H2O2, which has been adjusted to pH 2 with HNO3, was added and agitated periodically in hot water bath (85°C) for 2 hours. This was followed by addition of 3 ml H2O2 (pH 2) and periodic agitation in the hot water bath for another 3 h. After cooling to room temperature, 5 ml of 3.2M ammonium acetate in 20% v/v HNO3 was added finally and agitated at room temperature for 30 minutes before centrifugation and decantation to obtain the liquid sample for analysis. The residue was washed with deionised water and 4 ml aqua regia was added to the liquid sample for analysis before making it up to mark in the sample bottles.
g) Residual fraction: To the residue from previous leach, 5 ml HF and 5 ml aqua regia was added to digest it. This was heated in a hot water bath for 2 hours. Centrifugation was followed by decantation and deionised water was used to make up to the mark.
AAS analysis: All the sample solutions obtained from various stages of the extraction processes were analysed with Flame Atomic Absorption Spectrometer for the selected metals concentration using Buck scientific model of AAS machine to determine the availability and mobile fractions of the pollutants of interest.
Calibration standard solutions of the metals were prepared from analytical grade stock solutions of the metals of interest; to ascertain the sensitivity of the instrument so that the results are reliable. The monochromator of the instrument was adjusted to select specific, narrow region of the wavelength spectrum for transmission to the detector and rejects all other wavelengths outside the specified wavelength region. After setting the wavelength region, the extracted test sample solutions were shaken then introduced into the analysing instrument via the capillary tube of the nebulizer. The results in absorbance values which are proportional to the concentration of the metals were obtained from the PC-readout system and recorded as the concentration values of the metals extracted from the soil samples. The final residues were dried and re-analysed with the EDXRF spectrometer to determine the remaining concentration levels of the metals after the extraction processes. The concentrations of the metals left in the final residue are described as the residual fractions.
EDXRF analysis: The Energy dispersive X ray Florescence is based on the principle that individual atoms, when excited by an external energy source, emit x-ray photons of a characteristic energy or wavelength. By counting the number of photons of energy emitted from the sample, the elements present may be identified and quantified. This technique is well suited for multi-element determinations in environmental samples. In particular, the samples do not need any chemical pre-treatment and hence any possibility of contamination is avoided. The samples are analysed non-destructively, being retained for re-use, re-evaluation or for further studies. The small sample size required, coupled to its other features make it a valuable tool for pollution studies.
Concentrations of elements in soil test samples were analysed by EDXRF with the use of hel arrangement, suitable for analysis of liquid samples. Examinations were carried out on the basis of calibration curves which were made with the use of certified reference material: CRM of soil S-l. Correction for mutual multi-element interactions was calculated for calibration curves.
The spectrometer used in this work is based on a three axial geometry which reduces the background by polarisation of the radiation. The primary beam from the X-ray tube impinges on a secondary target, which emits almost monochromatic X-ray radiation. In this method, the ionisation cross-section for an atomic level is greatest when the exciting X-ray energy just exceeds the binding energy of the electron in that level, and falls off drastically with an increasing difference between the excitation energy and the electron binding energy. In order to cover a broad range of elements we usually use a W X-ray tube and a Mo secondary target. Under these conditions, atoms are ionised in K shell for 15<Z<38 and in L shell for heavier elements; characteristic K and L X-ray radiation is emitted.
The characteristic radiation emitted by the elements present in the sample is detected by a Si (Li) detector with 50 mm2 active area, 8 μm beryllium window, and 150 eV resolution at 6.4 keV. Data are stored in a PC computer interfaced with the XRF. The spectra are evaluated using the fundamental parameters method.
Results and Discussion
pH and moisture content of soil samples
The pH value ranges from 8.3 to 9.6 due to the soil increase in salt concentration as a result of nearness to the sea. As observed, the alkalinity of the soil of Victoria Island is attributed to the fact that the region is an Island surrounded by Atlantic Ocean. However with the increased alkalinity, it is expected that some metal forms bound to the water soluble fraction and the exchangeable fraction, (of alkali or alkaline earth cations) to the soil, would be readily detectable in a solution of normal water flowing along the discharge channels into the environment (Table 1).
| Sample Reference | Weight taken (W1) | Weight after drying (W2) | Moisture content (M) | %Moisture content | pH value |
|---|---|---|---|---|---|
| SSV 1 | 5.0025 | 4.1572 | 0.8453 | 16.9 | 9.2 |
| SSV 2 | 5.0042 | 4.0085 | 0.9957 | 19.9 | 9.8 |
| SSV 3 | 5.0038 | 4.0123 | 0.9915 | 19.81 | 9.3 |
| SSV 4 | 5.0063 | 4.0651 | 0.9412 | 18.8 | 9.6 |
| Average | 5.0042 | 4.0608 | 0.9434 | 18.85 | 9.5 |
Table 1: pH and Moisture content of the Soil samples.
However due to an external influence of the surrounding ocean, imminent change in pH of the soil to alkalinity, and/ or changes in redox with other favourable conditions, would increase the level of some metal concentration in the soil solution/moisture available for absorption into biota.
Lagos, being a high humid area has a lot of canals and swamps. The influence of high annual rainfall and steady inflow of waste water contributed to the significant moisture content which facilitates mobility and absorption of heavy metal into the ecosystem.
Fractional concentrations of metals in the soil samples
Presented in Tables 2-10 are the different physicochemical forms and fractions of metals that make up the total metal concentration in the soil sample of the locations considered. The Bioavailable fraction (BAF) is the sum of concentrations of the water soluble, exchangeable and the carbonate forms. The acronym “ND” here stands for not detectable.
| Sampling points | Water soluble fraction | Exchange-able fraction | Carbonate bound | Fe-Mn oxide fraction | Organic and sulfide | Residual fraction | Total | Mean | BAF | %BAF |
|---|---|---|---|---|---|---|---|---|---|---|
| SSV 1 | 1.521 ± 0.047 | 1.125 ± 0.014 | 3.219 ± 0.035 | 2.267 ± 0.024 | 1.013 ± 0.079 | 3.891 ± 0.097 | 13.04 | 2.17 | 5.87 | 45 |
| SSV 2 | 1.128 ± 0.041 | 1.058 ± 0.064 | 2.428 ± 0.013 | 3.182 ± 0.085 | 1.283 ± 0.081 | 4.351 ± 0.032 | 13.43 | 2.24 | 4.61 | 34.4 |
| SSV 3 | 1.043 ± 0.037 | 1.731 ± 0.028 | 3.457 ± 0.002 | 3.215 ± 0.036 | 0.935 ± 0.013 | 2.858 ± 0.006 | 13.24 | 2.21 | 6.23 | 47.1 |
| SSV 4 | 0.985 ± 0.017 | 1.332 ± 0.058 | 0.504 ± 0.091 | 1.926 ± 0.013 | 2.753 ± 0.006 | 2.479 ± 0.073 | 9.98 | 1.66 | 2.82 | 28.3 |
| TOTAL | 4.68 | 5.25 | 9.61 | 10.59 | 5.98 | 13.58 | 49.68 | 8.28 | 19.5 | 155 |
| MEAN | 1.17 | 1.31 | 2.4 | 2.65 | 1.5 | 3.39 | 12.42 | 2.07 | 4.88 | 38.7 |
Table 2: Fractional concentration of Manganese (mg/2 g).
| Sampling points | Water soluble fraction | Exchange-able fraction | Carbonate bound | Fe-Mn oxide fraction | Organic and sulfide | Residual fraction | Total | Mean | BAF | %BAF |
|---|---|---|---|---|---|---|---|---|---|---|
| SSV 1 | 0.995 ± 0.047 | 8.472 ± 0.057 | 5.972 ± 0.041 | 7.732 ± 0.062 | 4.351 ± 0.042 | 26.98 ± 0.054 | 54.5 | 9.08 | 15.4 | 28.3 |
| SSV 2 | 1.184 ± 0.035 | 9.212 ± 0.024 | 4.581 ± 0.016 | 5.582 ± 0.045 | 4.852 ± 0.046 | 27.66 ± 0.091 | 53.07 | 8.85 | 15 | 28.2 |
| SSV 3 | 0.874 ± 0.094 | 7.295 ± 0.037 | 3.952 ± 0.012 | 5.585 ± 0.063 | 2.357 ± 0.011 | 28.01 ± 0.054 | 48.07 | 8.01 | 12.1 | 25.2 |
| SSV 4 | 1.021 ± 0.059 | 8.014 ± 0.063 | 5.525 0.039 | 6.682 ± 0.029 | 1.573 ± 0.046 | 21.96 ± 0.015 | 44.78 | 7.46 | 14.6 | 32.5 |
| TOTAL | 4.074 | 32.993 | 20.03 | 25.58 | 13.133 | 104.61 | 200.4 | 33.4 | 57.1 | 114 |
| MEAN | 1.02 | 8.25 | 5.01 | 6.4 | 3.28 | 26.15 | 50.11 | 8.35 | 14.3 | 28.6 |
Table 3: Fractional concentration of Iron (mg/2 g).
| Sampling points | Water soluble fraction | Exchange-able fraction | Carbonate bound | Fe-Mn oxide fraction | Organic and sulfide | Residual fraction | Total | Mean | BAF | %BAF |
|---|---|---|---|---|---|---|---|---|---|---|
| SSV 1 | 0.025 ± 0.003 | 0.274 ± 0.018 | 0.215 ± 0.024 | 0.054 ± 0.013 | 0.024 ± 0.016 | 1.481 ± 0.022 | 2.049 | 0.34 | 0.514 | 25.085 |
| SSV 2 | 0.018 ± 0.005 | 0.125 ± 0.010 | 0.197 ± 0.081 | 0.021 ± 0.002 | 0.019 ± 0.006 | 1.112 ± 0.031 | 1.492 | 0.25 | 0.340 | 22.788 |
| SSV 3 | 0.042 ± 0.009 | 0.143 ± 0.016 | 0.202 ± 0.012 | 0.072 ± 0.006 | 0.087 ± 0.020 | 0.546 ± 0.012 | 1.092 | 0.18 | 0.387 | 35.440 |
| SSV 4 | 0.017 ± 0.007 | 0.115 ± 0.002 | 0.243 ± 0.031 |
0.077 ± 0.011 | 0.062 ± 0.005 | 1.249 ± 0.019 | 1.763 | 0.29 | 0.375 | 21.271 |
| TOTAL | 0.102 | 0.657 | 0.857 | 0.224 | 0.192 | 4.388 | 6.40 | 1.07 | 1.616 | 104.58 |
| MEAN | 0.03 | 0.16 | 0.21 | 0.06 | 0.05 | 1.10 | 1.60 | 0.27 | 0.404 | 26.15 |
Table 4: Fractional concentration of Cobalt (mg/2 g).
| Sampling points | Water soluble fraction | Exchange-able fraction | Carbonate bound | Fe-Mn oxide fraction | Organic and sulfide | Residual fraction | Total | Mean | BAF | %BAF |
|---|---|---|---|---|---|---|---|---|---|---|
| SSV 1 | -0.046 ± 0.002 | 1.251 ± 0.010 | 1.086 ± 0.017 | 1.179 ± 0.021 | 1.406 ± 0.003 | 1.794 ± 0.006 | 6.716 | 1.12 | 2.337 | 34.797 |
| SSV 2 | -0.057 ± 0.006 | 1.054 ± 0.003 | 1.342 ± 0.005 | 1.539 ± 0.006 | 1.492 ± 0.003 | 1.274 ± 0.025 | 6.701 | 1.12 | 2.396 | 35.756 |
| SSV 3 | -0.029 ± 0.003 | 1.924 ± 0.014 | 1.361 ± 0.009 | 1.642 ± 0.003 | 1.116 ± 0.001 | 0.899 ± 0.005 | 6.942 | 1.16 | 3.285 | 47.321 |
| SSV 4 | -0.036 ± 0.001 | 1.519 ± 0.008 | 0.997 ± 0.017 | 0.854 ± 0.014 | 1.503 ± 0.017 | 0.745 ± 0.006 | 5.618 | 0.94 | 2.516 | 44.785 |
| TOTAL | ND | 5.748 | 4.786 | 5.214 | 5.517 | 4.712 | 25.98 | 4.33 | 10.534 | 162.66 |
| MEAN | ND | 1.44 | 1.20 | 1.30 | 1.38 | 1.18 | 6.49 | 1.08 | 2.634 | 40.66 |
Table 5: Fractional Concentration of Copper (mg/2 g).
| Sampling points | Water soluble fraction | Exchange-able fraction | Carbonate bound | Fe-Mn oxide fraction | Organic and sulfide | Residual fraction | Total | Mean | BAF | %BAF |
|---|---|---|---|---|---|---|---|---|---|---|
| SSV 1 | 0.264 ± 0.002 | 1.235 ± 0.021 | 1.958 ± 0.015 | 0.742 ± 0.009 | 0.897 ± 0.007 | 2.115 ± 0.075 | 7.21 | 1.20 | 3.46 | 47.94 |
| SSV 2 | 0.064 ± 0.007 | 1.015 ± 0.014 | 1.382 ± 0.011 | 1.265 ± 0.085 | 1.213 ± 0.025 | 1.892 ± 0.018 | 6.83 | 1.14 | 2.46 | 36.03 |
| SSV 3 | 0.092 ± 0.005 | 0.749 ± 0.008 | 1.518 ± 0.003 | 0.885 ± 0.046 | 1.483 ± 0.001 | 1.324 ± 0.074 | 6.05 | 1.01 | 2.36 | 38.99 |
| SSV 4 | 0.089 ± 0.012 | 0.968 ± 0.058 | 1.731 ± 0.037 | 1.243 ± 0.004 | 1.375 ± 0.001 | 2.392 ± 0.072 | 7.71 | 1.28 | 2.70 | 35.01 |
| TOTAL | 0.42 | 3.97 | 6.59 | 4.14 | 4.97 | 7.72 | 27.80 | 4.63 | 10.98 | 157.96 |
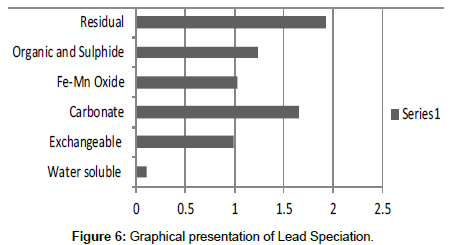
| MEAN | 0.11 | 0.99 | 1.65 | 1.03 | 1.24 | 1.93 | 6.95 | 1.16 | 2.74 | 39.49 |
Table 6: Fractional concentration of Lead (mg/2 g).
| Sampling points | Water soluble fraction | Exchange-able fraction | Carbonate bound | Fe-Mn oxide fraction | Organic and sulfide | Residual fraction | Total | Mean | BAF | %BAF |
|---|---|---|---|---|---|---|---|---|---|---|
| SSA 1 | ND | 0.054 ± 0.001 | 0.047 ± 0.004 | 0.010 ± 0.001 | 0.020 ± 0.003 | 0.274 ± 0.002 | 0.405 | 0.068 | 0.101 | 24.94 |
| SSA 2 | -0.011 ± 0.000 | 0.038 ± 0.002 | 0.028 ± 0.000 | 0.017 ± 0.003 | 0.012 ± 0.001 | 0.196 ± 0.004 | 0.291 | 0.049 | 0.066 | 22.68 |
| SSA 3 | ND | 0.018 ± 0.001 | 0.039 ± 0.001 | -0.008 ± 0.001 | 0.025 ± 0.001 | 0.234 ± 0.003 | 0.316 | 0.053 | 0.057 | 18.04 |
| SSA 4 | -0.008 ± 0.000 | 0.027 ± 0.002 | 0.057 ± 0.007 | ND | 0.016 ± 0.002 | 0.295 ± 0.006 | 0.395 | 0.066 | 0.084 | 21.27 |
| TOTAL | ND | 0.137 | 0.171 | 0.027 | 0.073 | 0.999 | 1.407 | 0.235 | 0.308 | 86.92 |
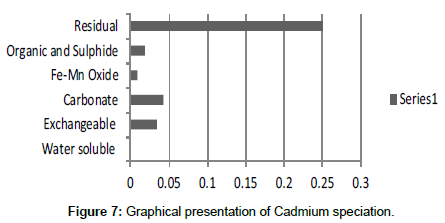
| MEAN | ND | 0.034 | 0.043 | 0.009 | 0.018 | 0.25 | 0.35 | 0.059 | 0.077 | 21.73 |
Table 7: Fractional concentration of Cadmium (mg/2 g).
| Sampling points | Water soluble fraction | Exchange-able fraction | Carbonate bound | Fe-Mn oxide fraction | Organic and sulfide | Residual fraction | Total | Mean | BAF | %BAF |
|---|---|---|---|---|---|---|---|---|---|---|
| SSV 1 | 0.185 ± 0.002 | 1.824 ± 0.010 | 0.672 ± 0.014 | 0.406 ± 0.004 | 0.572 ± 0.004 | 0.897 ± 0.045 | 4.556 | 0.759 | 2.681 | 58.85 |
| SSV 2 | 0.018 ± 0.000 | 1.638 ± 0.022 | 0.431 ± 0.018 | 0.512 ± 0.002 | 0.402 ± 0.001 | 0.735 ± 0.012 | 3.736 | 0.623 | 2.087 | 55.86 |
| SSV 3 | 0.104 ± 0.004 | 0.818 ± 0.022 | 0.194 ± 0.016 | 0.342 ± 0.010 | 0.321 ± 0.020 | 0.789 ± 0.008 | 2.568 | 0.428 | 1.116 | 43.46 |
| SSV 4 | 0.194 ± 0.034 | 1.227 ± 0.041 | 0.572 ± 0.024 | 0.284 ± 0.018 | 0.196 ± 0.014 | 1.124 ± 0.026 | 3.597 | 0.600 | 1.993 | 55.41 |
| TOTAL | 0.501 | 5.507 | 1.869 | 1.544 | 1.491 | 3.55 | 14.46 | 2.410 | 7.877 | 213.57 |
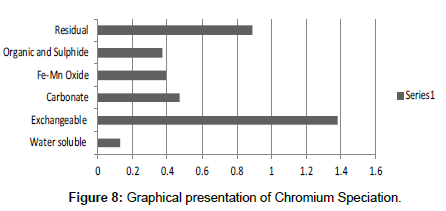
| MEAN | 0.13 | 1.38 | 0.47 | 0.39 | 0.37 | 0.89 | 3.61 | 0.60 | 1.97 | 53.39 |
Table 8: Fractional concentration of Chromium (mg/2 g).
| Sampling points | Water soluble fraction | Exchange-able fraction | Carbonate bound | Fe-Mn oxide fraction | Organic and sulfide | Residual fraction | Total | Mean | BAF | %BAF |
|---|---|---|---|---|---|---|---|---|---|---|
| SSA 1 | 0.128 ± 0.004 | 0.759 ± 0.010 | 0.672 ± 0.016 | 0.226 ± 0.001 | 0.351 ± 0.006 | 0.891 ± 0.020 | 3.027 | 0.505 | 1.559 | 51.50 |
| SSA 2 | 0.089 ± 0.003 | 0.562 ± 0.004 | 0.505 ± 0.008 | 0.321 ± 0.003 | 0.394 ± 0.003 | 0.946 ± 0.012 | 2.817 | 0.470 | 1.156 | 41.04 |
| SSA 3 | 0.097 ± 0.004 | 0.687 ± 0.015 | 0.349 ± 0.015 | 0.532 ± 0.010 | 0.173 ± 0.010 | 0.795 ± 0.016 | 2.633 | 0.439 | 1.133 | 43.03 |
| SSA 4 | 0.105 ± 0.008 | 0.345 ± 0.023 | 0.172 ± 0.004 | 0.201 ± 0.004 | 0.129 ± 0.014 | 1.061 ± 0.016 | 2.013 | 0.336 | 0.622 | 30.90 |
| TOTAL | 0.419 | 2.353 | 1.698 | 1.28 | 1.047 | 3.69 | 10.49 | 1.748 | 4.47 | 166.47 |
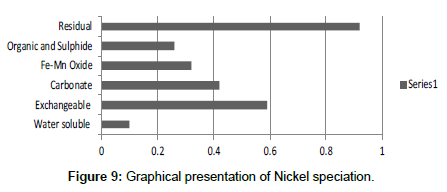
| MEAN | 0.10 | 0.59 | 0.42 | 0.32 | 0.26 | 0.92 | 2.62 | 0.44 | 1.12 | 41.62 |
Table 9: Fractional concentration of Nickel (mg/2 g).
| Sampling points | Water soluble fraction | Exchange-able fraction | Carbonate bound | Fe-Mn oxide fraction | Organic and sulfide | Residual fraction | Total | Mean | BAF | %BAF |
|---|---|---|---|---|---|---|---|---|---|---|
| SSV 1 | 0.812 ± 0.003 | 0.224 ± 0.005 | 0.392 ± 0.002 | 0.432 ± 0.004 | 0.392 ± 0.015 | 1.118 ± 0.016 | 3.37 | 0.562 | 1.428 | 42.37 |
| SSV 2 | 0.387 ± 0.005 | 0.326 ± 0.007 | 0.473 ± 0.006 | 0.228 ± 0.010 | 0.571 ± 0.021 | 1.011 ± 0.001 | 2.996 | 0.499 | 1.186 | 39.59 |
| SSV 3 | 0.475 ± 0.008 | 0.412 ± 0.014 | 0.594 ± 0.003 | 0.409 ± 0.012 | 0.476 ± 0.004 | 1.211 ± 0.014 | 3.577 | 0.596 | 1.481 | 41.40 |
| SSV 4 | 0.275 ± 0.004 | 0.145 ± 0.002 | 0.323 ± 0.002 | 0.349 ± 0.003 | 0.292 ± 0.013 | 0.978 ± 0.008 | 2.362 | 0.394 | 0.822 | 34.80 |
| TOTAL | 1.949 | 1.107 | 1.782 | 1.418 | 1.731 | 4.32 | 12.31 | 2.051 | 4.917 | 158.16 |
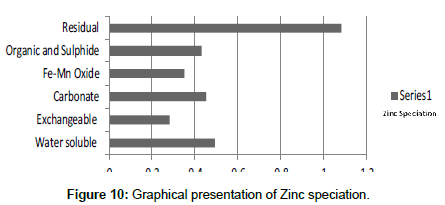
| MEAN | 0.49 | 0.28 | 0.45 | 0.35 | 0.43 | 1.08 | 3.08 | 0.51 | 1.23 | 39.54 |
Table 10: Fractional concentration of Zinc (mg/2 g).
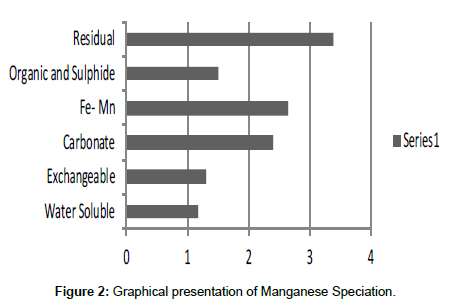
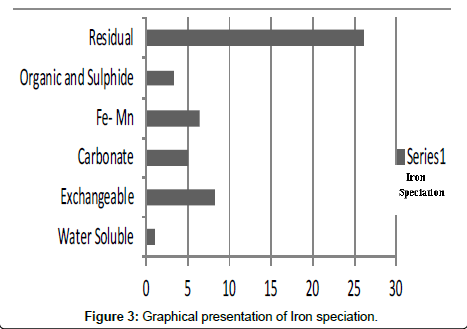
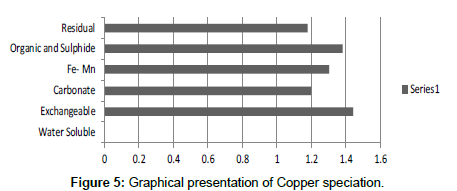
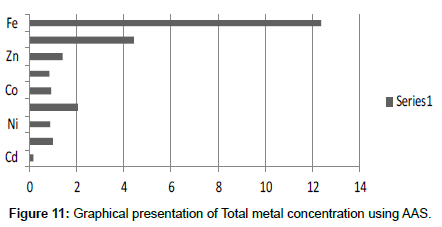
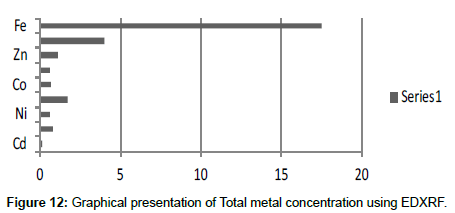
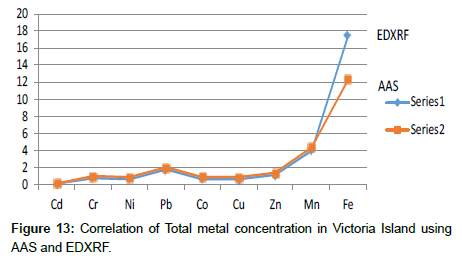
The speciation of Manganese in Victoria Island, Lagos is represented below. Fe was observed to occur mostly in the residual fraction with a mean value of 26.15, while it had the least concentration in the water soluble fraction. This indicates that it may not be readily bioavailable. Cu was not detectable at the water soluble fraction but had its highest mean concentration in the organic and sulfide fraction. From table 11 it can be concluded that among all the heavy metals considered, Cr is the most bioavailable metal while Cd is the least bioavailable. From the comparative study of the two methods used, it is observed that both are similar in their sensitivity of detection since their respective values are almost the same for each metal (Figures 2-13; Tables 11-16).
| Sample Reference | Cd | Cr | Ni | Pb | Co | Cu | Zn | Mn | Fe |
|---|---|---|---|---|---|---|---|---|---|
| SSV 1 | 24.940 | 58.850 | 51.500 | 47.940 | 25.085 | 34.797 | 42.370 | 45.020 | 28.327 |
| SSV 2 | 22.680 | 55.860 | 41.040 | 36.030 | 22.788 | 35.756 | 39.590 | 34.360 | 28.221 |
| SSV 3 | 18.040 | 43.460 | 43.030 | 38.990 | 35.440 | 47.321 | 41.400 | 47.070 | 25.214 |
| SSV 4 | 21.270 | 55.410 | 30.900 | 35.010 | 21.271 | 44.785 | 34.800 | 28.270 | 32.518 |
| TOTAL | 86.930 | 213.580 | 166.470 | 157.970 | 104.584 | 162.659 | 158.160 | 154.720 | 114.280 |
| MEAN | 21.73 | 53.40 | 41.62 | 39.49 | 26.15 | 40.66 | 39.54 | 38.68 | 28.57 |
Table 11: Percentage bioavailability of the Metals.
| Metals(mg/2g) | Cd | Cr | Ni | Pb | Co | Cu | Zn | Mn | Fe |
|---|---|---|---|---|---|---|---|---|---|
| Sum of fractions | 0.35 | 3.61 | 2.62 | 6.95 | 1.10 | 8.49 | 39.54 | 12.42 | 50.11 |
| Bioavailable fraction | 0.08 | 1.97 | 1.12 | 2.74 | 0.404 | 2.63 | 1.23 | 14.27 | 14.27 |
| Water soluble fraction | -0.019 | 0.13 | 0.10 | 0.11 | 0.03 | -0.168 | 0.49 | 1.17 | 1.02 |
| %Bioavailability | 21.73 | 53.39 | 41.62 | 39.49 | 26.15 | 40.66 | 39.54 | 36.68 | 28.57 |
Table 12: Water soluble fractions and the bioavailable fractions of metals.
| Sampling points | Cd | Cr | Ni | Pb | Co | Cu | Zn | Mn | Fe |
|---|---|---|---|---|---|---|---|---|---|
| SSV 1 | 0.172 ± 0.018 | 0.620 ± 0.009 | 0.642 ± 0.006 | 2.624 ± 0.261 | 0.892 ± 0.005 | 1.113 ± 0.004 | 1.672 ± 0.121 | 4.842 ± 0.041 | 18.44 ± 0.113 |
| SSV 2 | 0.135 ± 0.005 | 1.031 ± 0.015 | 0.989 ± 0.020 | 1.241 ± 0.024 | 0.782 ± 0.014 | 0.817 ± 0.008 | 1.275 ± 0.013 | 4.169 ± 0.037 | 16.23 ± 0.125 |
| SSV 3 | 0.156 ± 0.007 | 1.149 ± 0.024 | 1.041 ± 0.005 | 1.485 ± 0.005 | 1.014 ± 0.005 | 0.684 ± 0.004 | 1.512 ± 0.071 | 5.243 ± 0.026 | 22.61 ± 0.103 |
| SSV 4 | 0.147 ± 0.016 | 1.112 ± 0.007 | 0.845 ± 0.018 | 2.813 ± 0.004 | 1.035 ± 0.024 | 0.725 ± 0.002 | 1.156 ± 0.045 | 3.413 ± 0.012 | 19.61 ± 0.095 |
| TOTAL | 0.61 | 3.912 | 3.517 | 8.163 | 3.723 | 3.339 | 5.615 | 17.667 | 49.47 |
| MEAN | 0.153 | 0.978 | 0.879 | 2.041 | 0.931 | 0.835 | 1.404 | 4.417 | 12.37 |
Table 13: Total selected metals (mg/2 g) AAS.
| Sampling points | Cd | Cr | Ni | Pb | Co | Cu | Zn | Mn | Fe |
|---|---|---|---|---|---|---|---|---|---|
| SSV 1 | 0.151 ± 0.012 | 0.437 ± 0.007 | 0.421 ± 0.002 | 2.315 ± 0.113 | 0.529 ± 0.008 | 1.056 ± 0.014 | 1.415 ± 0.098 | 4.341 ± 0.032 | 17.14 ± 0.010 |
| SSV 2 | 0.116 ± 0.007 | 0.925 ± 0.004 | 0.672 ± 0.019 | 1.057 ± 0.006 | 0.425 ± 0.012 | 0.572 ± 0.007 | 1.005 ± 0.010 | 3.651 ± 0.017 | 14.07 ± 0.055 |
| SSV 3 | 0.101 ± 0.005 | 1.009 ± 0.020 | 0.891 ± 0.006 | 1.258 ± 0.004 | 0.924 ± 0.002 | 0.241 ± 0.009 | 1.126 ± 0.031 | 4.833 ± 0.071 | 20.41 ± 0.087 |
| SSV 4 | 0.097 ± 0.006 | 0.927 ± 0.006 | 0.674 ± 0.014 | 2.451 ± 0.002 | 0.835 ± 0.004 | 0.554 ± 0.002 | 0.875 ± 0.053 | 3.134 ± 0.012 | 18.51 ± 0.055 |
| TOTAL | 0.465 | 3.298 | 2.658 | 7.081 | 2.713 | 2.423 | 4.421 | 15.96 | 70.13 |
| MEAN | 0.116 | 0.825 | 0.665 | 1.77 | 0.678 | 0.606 | 1.105 | 3.99 | 17.53 |
Table 14: Total selected metals concentration (mg/2 g) using EDXRF.
| Metals | EDXRF | AAS |
|---|---|---|
| Cd | 0.116 | 0.153 |
| Cr | 0.825 | 0.978 |
| Ni | 0.665 | 0.879 |
| Pb | 1.77 | 2.041 |
| Co | 0.678 | 0.931 |
| Cu | 0.606 | 0.835 |
| Zn | 1.105 | 1.404 |
| Mn | 3.99 | 4.417 |
| Fe | 17.53 | 12.37 |
Table 15: Correlation and Comparative study of Methods for Total metal analysis.
| Metals | Total Concentration in Apapa Wharf | Total Concentration in Victoria Island (mg/kg) | NESREA (2009) (mg/kg) | US EPA (mg/kg) | EPAS (1996) (mg/kg) |
|---|---|---|---|---|---|
| Cu | 0.435 | 0.4175 | 0.1 | - | 0.06 |
| Ca | - | Tolerable | - | ||
| Mn | 3.755 | 2.209 | - | - | - |
| Pb | 1.63 | 1.021 | 0.164 | 0.42 | 0.085 |
| Ni | 0.37 | 0.440 | 0.07 | - | 0.05 |
| Fe | 11.95 | 6.185 | - | - | - |
| Co | 0.47 | 0.4655 | 0.05 | - | - |
| Zn | 0.875 | 0.702 | 0.421 | 7.5 | 0.2 |
| Cr | 0.73 | 0.489 | 0.1 | - | - |
Table 16: Heavy Metals Limits in the soil, as given by National Environmental Standards and Regulations Enforcement Agency (NESREA Nigeria) and other environmental protection agencies.
Discussion of results
The heavy metal concentration at the Locations was higher than that of NESREA standards. However, the metals are above the USEPA provisions. There exists a great difference between NESREA and the results from this study. The extent and the significance of the differences were statistically determined to make a very good conclusion. Total metal concentration was determined using the two different methods; AAS and EDXRF. From statistical treatment, a correlation was drawn between the two array of data generated from the two different methods; giving rise to a correlation coefficient of 0.9928.
From the result, it can be deduced that both methods are invaluable in elemental analysis and environmental study because they showed neither significant difference nor variation.
The heavy metals were quite distributed in all the forms considered. The water soluble had the lowest level of the metal, while the residual form retained the highest concentration of the metal in that soil.
In general, for all the metals and the soil of the considered area, an increased bioavailability and hence mobility would be enhanced by remobilization. Remobilization is mainly influenced by four types of chemical changes in soil and water, and they include the following:
Increased salt concentrations whereby the alkali and alkaline earth cations can compete with the metal ions adsorbed onto solid particle. This is more obtainable for the exchangeable fractions. Decrease in the pH, which leads to dissolution of carbonates and hydroxides, and increased adsorption of metal cations due to competition with hydrogen ions (H+). This is more obtainable in the carbonate forms. Changes in the redox conditions, usually in conjunction with a decrease in oxygen potential due to advanced eutropolication iron and manganese hydroxides are partly or completely dissolved, whereby part of the incorporated or adsorbed heavy metal load is being released. This is observed for the reducible fraction. Increased use of natural and synthetic complexing agents, which can form soluble complexes sometimes of high stability with heavy metals that are otherwise adsorbed to solid particles.
However, in addition to these four processes, there are other biochemical transformation processes by means of which the heavy metals are either transferred from sediments to animals or plant organisms. The percentage bioavailability followed the trend Cr>Ni>Cu>Zn>Pb>Mn>Co>Fe>Cd. From the trend, it is evident that the results revealed that iron though with the highest concentration at both locations, is the second to the least bioavailable metal in the locations. Other metals with increased concentration, like Mn, Pb and Cu, showed significant bioavailability, thus pose environmental threat due to its readiness to leach into water. This draws an alarming attention. The situation was near critical due to significant concentration of these two most considered metals, Cd and Pb, in the water soluble fraction of their bioavailability; or more so the concentration of the metals exceeded the permissible level for soils.
Conclusion
It was observed that Cr was the most readily bioavailable heavy metal in the Victoria Island. Cr being one of the most dangerous heavy metals is discovered to be at an alarming stage in Victoria Island and serious steps will have to be taken right away to curtail its release into the environment. Lagos is a highly industrialized state and so many anthropogenic activities takes place which introduces the heavy metals into the soil. Heavy metals are important in many aspects to man, especially in the manufacturing of certain important products of human use, such as accumulators (Pb), mercury-arch lamps and thermometers (Hg), Battery (Ni-Cd, Pb), Electroplating (Cu, Cr), Medicine, (Co), utensils and light packages (Al) and a wide range of other products [9]. But the bio-toxic effects, when unduly exposed to them could be potentially life threatening hence, cannot be neglected. While these metals are in many ways indispensable, good precaution and adequate occupational hygiene should be ensured while handling them. Although heavy metal poisoning could be clinically diagnosed and medically treated, the best option is to prevent heavy metal pollution and the subsequent human poisoning. I believe if these recommendations are properly implemented it will reduce the level of heavy metal concentration in the environment.
References
- Jianlong W, Chen C (2006) Biosorption of heavy metals by Saccharomyces cerevisiae: A review. Biotechnology Advances 24: 427-451.
- USEPA (1989) Risk Assessment Guidance for Superfund, Human Health Evaluation Manual, Office of Emergency and Remedial Response.US Environmental Protection Agency, Washington DC, 20450.
- Wikipedia (2011) http://en.wikipedia.org/wiki/soil pollution. Accessed on: 09/12/11.
- Cottenie A, Verloo M (1984) Analytical diagnosis of soil pollution with heavy metals. Fresenius' Zeitschrift für analytischeChemie317: 389-393.
- Tamunobereton-ariI, Omubo-Pepple VB, Tamunobereton-ari NA (2010) Speciation of heavy metals (Cu, Pb, Ni) pollutants and the vulnerability of groundwater resource in Okrika of Rivers State, Nigeria.American Journal of Scientific and Industrial Research.pp: 1-9.
- Nwankwo DI, Akinsoji A (1992) Epiphyte community on water hyacinthEichhorniacrassipes(Mart.) Solms in coastal waters of Souther-Western Nigeria. Arch. Hydrobiol 124: 501-511.
- Portmann J, Biney C, ChidiIbe A, Zabi S (1989) State of the Marine environment West and Central AfricanRegion. UNEP Regional seas - Rep and Stud No. 108.
- Tessier A, Campbell PGC, Bisson M (1979) Sequential Extraction Procedure for Speciation of Particular Trace Metals. Anal Chem 51: 844-851.
- McCluggage D (1991) Heavy Metal Poisoning. NCS Magazine. Published by The Bird Hospital, USA.
Relevant Topics
Recommended Journals
Article Tools
Article Usage
- Total views: 11358
- [From(publication date):
December-2015 - Jul 12, 2025] - Breakdown by view type
- HTML page views : 9997
- PDF downloads : 1361
