Research Article Open Access
Evaluation of the Effect of Tooth Surface Wetting and Bond Strength of Composite-an In vitro Study
Singh Yashpal* and Saini Monika
Qassim Private College, Saudi Arabia
- Corresponding Author:
- Dr. Yashpal Singh
Associate professor
Head of Oral and maxillofacial rehabilitation
Qassim private college, Saudi Arabia
Tel: 966-538921650
E-mail: dryashpal.singh@gmail.com
Received Date: November 30, 2013; Accepted Date: January 24, 2014; Published Date: January 27, 2014
Citation: Yashpal S, Monika S (2014) Evaluation of the Effect of Tooth Surface Wetting and Bond Strength of Composite-an In vitro Study. J Interdiscipl Med Dent Sci 2:111. doi: 10.4172/2376-032X.1000111
Copyright: © 2014 Yashpal S, et al. This is an open-access article distributed under the terms of the Creative Commons Attribution License, which permits unrestricted use, distribution, and reproduction in any medium, provided the original author and source are credited
Visit for more related articles at JBR Journal of Interdisciplinary Medicine and Dental Science
Abstract
Adhesive restorations have become integral part of routine dental treatment. To achieve clinical success with such restorations, it is of clinical importance to ensure good bonding between this restoration and tooth surface. Bonding to dentin is far more challenging. Bond between dentin and dentin bonding adhesives is greatly influenced by: (1) Surface condition of dentin (moist/dry); (2) Chemical nature of dentin bonding agents. The present study has been designed: (i) to study the effect of various conditions (moist/dry) of dentin on bonding with dentin bonding agents; (ii) to compare the strength achieved by dentin, bonding agent of different systems (water/acetone based). This study was conducted to evaluate the effect of tooth surface wetting on shear bond strength of composite. Freshly extracted central incisors were taken. Cavities were prepared in middle 1/3 of teeth. Teeth were divided in groups A,B,C depending on their surface treatment (wet, semi dry, dry surface) and again in to sub groups depending on whether they are treated water based or acetone based dentin bonding agents(scotch bond, prime bond NT, clear fil SE) . All the cavities in samples were filled with composite and light cured. Composite was debonded from teeth by Instron machine. Debonded samples were scanned and micro graphed under SEM. From the observations made, statistically analyzed and duly discussed, following conclusions are drawn: 1. Optimal water content is necessary for achieving good bonding between dentin and composite. 2. Water based dentin bonding agents, show maximum shear bond strength with dentin in dry conditions. 3. Acetone based dentin bonding agents show maximum shear bond strength with dentin in wet conditions. Overview of the results shows that moisture plays a vital role in bonding of composite with dentin. Optimal water should be present for better bonding of dentin with composite. If dentin is in dry stage, then water based dentin-bonding agents should be used as they produce best results in dry conditions and if dentin is in wet state then acetone based dentin-bonding agents should be used as they produce best results in wet conditions.
Introduction
Adhesive restorations become a very important part while doing full mouth rehabilitation case. To achieve clinical success with such restorations, it is of clinical importance to ensure good bonding between this restoration and tooth surface.
Speaking about adhesion to tooth substances, we need to distinguish the difference between enamel and dentin. Enamel is mainly composed of hydroxyapatite crystals and bond between enamel and resin has been one of the strongest bonds achieved within tooth substance.
Bonding to dentin is far more challenging as it is composed of apatite crystals embedded in collagen matrix. Lower bond strengths to dentin are the result of a number of factors:
1. Dentin contains less mineralized tooth structure and more water than does the enamel.
2. The presence of smear layer makes wetting of dentin by the adhesive more difficult. Even when good wetting occur, stress cause by polymerisation shrinkage of resin can pull the resin away from tooth structure causing microporosity1. Bonding between dentin and composite resin is not strong enough to overcome the stress of polymerization shrinkage.
3. Fluid in dentin tubules reduces the stability of composite resin to dentin bond.
It is widely accepted that bonding to dentin relies on penetration of adhesives in to the collagen fibers and encapsulation of irregular hydroxyapatite crystals at the bottom of decalcified area, which created the resin reinforced interdiffusion zone called hybrid layer [1,2].
Bond between dentin and dentin bonding adhesives is greatly influenced by:
(1) Surface condition of dentin (moist/dry) [3,4].
(2) Chemical nature of dentin bonding agents [5,6].
The present study was designed: (i) to study the effect of various conditions (moist/dry) of dentin on bonding with dentin bonding agents; (ii) to compare the strength achieved by dentin bonding agent of different systems (water/acetone based) under different conditions of dentin. Structure of samples was also studied under SEM after it was debonded from composite.
Materials and Methods
Materials used for holding sample
1. Freshly extracted non carious central incisors1
2. Physiologic saline → was taken to store the teeth.
3. Brassdie of 15 mm × 20 mm → was prepared to hold the sample in self polymerising resin.
4. Self polymerising resin2 Dappen Dish
5. Mixing spatula
Equipment used for preparing the cavity
1. Airotor hand piece3
2. 3 No. 245 bur4 III- Etchant and different Bonding agents used
3. [35% Phosphoric acid] Etchant [7]
4. Prime bond NT
5. Scotch bond
6. Clearfil SE bond
Material and Equipment used for application of bonding agent, etchant and drying the cavity
1. Paint brush – was used to apply bonding agent on cavity in sample tooth
2. Three way syringe
3. Timer5
Composite used and material used for its application and curing
1. Z-100 composite2
2. Teflon coated spatula
3. Visible light curing unit3
Instruments used for testing the bond strength of composite
Instron4: An instron machine was used for testing the bond strength of composite to the sample tooth sample. Instron machine had different calibrations. Cross head speed of the machine was 1140mm/minute.
Instrument used for Micrography
1. Supper coater: Used to deposit a uniform gold coat on sample.
2. Scanning electron microscope was used to take pictures of sample after debonding.
Methodology
I. Non carious upper/lower central/lateral incisors were selected and stored in physiologic saline solution
II. Each tooth was held in 15 mm x 20 mm mold of acrylic resin
III. A cavity was prepared on middle third of labial surface of tooth to reach sound dentin structure
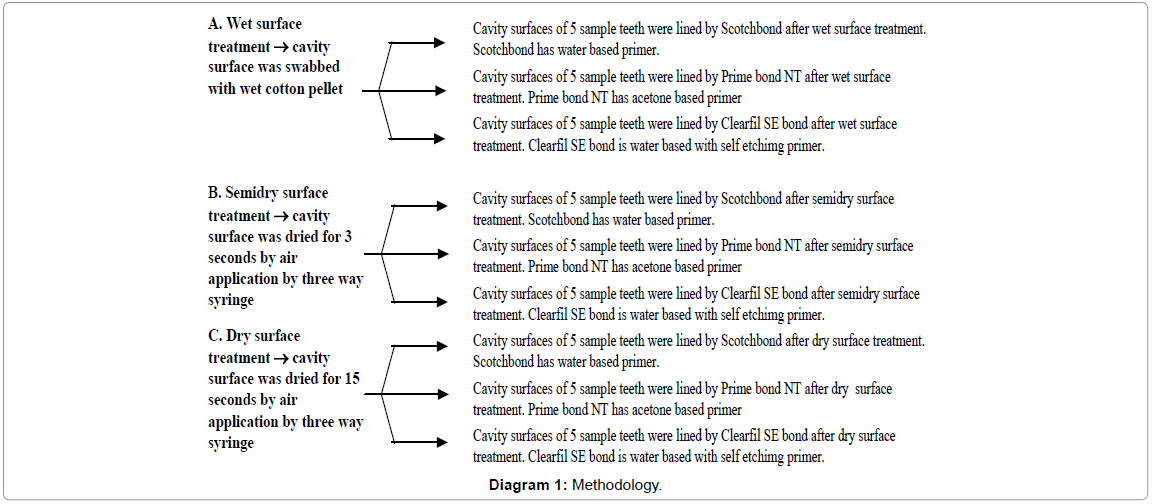
IV. Samples were divided in three major groups on the basis of treatment of cavity surface Diagram 1 [8].
V. Cavity in each sample was filled with composite (Z100) and cured for 40 seconds with visible light curing unit
VI. Shear bond strength of composite in each sample was measured with the help of the Instron machine.
VII. All samples were scanned under and then photographed.
One-way ANOVA and level of significance at p<0.05 were used for Statistical analysis (Table 1).
| Group A Wet Surface | Group B Semidry Surface | Group C Dry Surface | ||||||
|---|---|---|---|---|---|---|---|---|
| Treated with Scotch Bond (Subgroup A1) |
Treated with Prime Bond NT (Subgroup A2) |
Treated with Clearfil SE Bond (Subgroup A3) |
Treated with Scotch Bond (Subgroup B1) |
Treated with Prime Bond NT (Subgroup B2) |
Treated with Clearfil SE Bond (Subgroup B3) |
Treated with Scotch Bond (Subgroup C1) |
Treated with Prime Bond NT (Subgroup C2) |
Treated with Clearfil SE Bond (Subgroup C3) |
Table 1: Showing Groupwise Distribution of Samples.
Table 2 shows that mean shear bond strength of subgroup A1 is 11.518 MPa with a standard deviation of 1.9228. Mean shear bond strength of subgroup A2 is 12.064 MPa with standard deviation of 1.19. Mean shear bond strength of subgroup A3 is 25.10 MPa with standard deviation of 3.7108. Mean shear bond strength of subgroup B1 is 13.378 MPa with standard deviation of 1.8175. Mean shear bond strength of subgroup B2 is 10.226 MPa with standard deviation of 0.7162. Mean shear bond strength of subgroup B3 is 30.966 MPa with standard deviation of 1.0805. Mean shear bond strength of subgroup C1 is 20.92 MPa with standard deviation of 0.9550. Mean shear bond strength of subgroup C2 is 6.13 MPa with standard deviation of 0.7418. Mean shear bond strength of C3 is 31.06 MPa with standard deviation 1.5962.
| Group A | Group B | Group C | |||||||
|---|---|---|---|---|---|---|---|---|---|
| A1 | A2 | A3 | B1 | B2 | B3 | C1 | C2 | C3 | |
| Shear bond strength in MPa |
10.32 | 10.31 | 19.0 | 11.22 | 10.6 | 30.6 | 19.5 | 6.02 | 32.0 |
| 12.54 | 11.81 | 24.2 | 14.8 | 4.2 | 29.42 | 20.8 | 5.8 | 31.4 | |
| 9.1 | 13.60 | 28.0 | 13.65 | 9.81 | 31.5 | 20.4 | 7.15 | 29.8 | |
| 14.06 | 12.14 | 26.8 | 12.3 | 11.0 | 30.98 | 22.0 | 5.18 | 29.1 | |
| 11.57 | 11.90 | 27.5 | 12.92 | 10.52 | 32.33 | 21.0 | 6.5 | 33.0 | |
| Mean | 11.518 | 12.064 | 25.10 | 13.378 | 10.226 | 30.966 | 20.82 | 6.13 | 31.06 |
| S.D. | 1.9228 | 1.19 | 3.7108 | 1.8175 | 0.7162 | 1.0805 | 0.9550 | 0.7418 | 1.5962 |
| S.E. | 0.8600 | 0.59 | 1.6595 | 0.8179 | 0.3222 | 0.4862 | 0.4298 | 0.3317 | 0.2302 |
| n | 5 | 5 | 5 | 5 | 5 | 5 | 5 | 5 | 5 |
Table 2: Showing mean shear bond strength with standard deviation and standard error of samples of Group A, B and C.
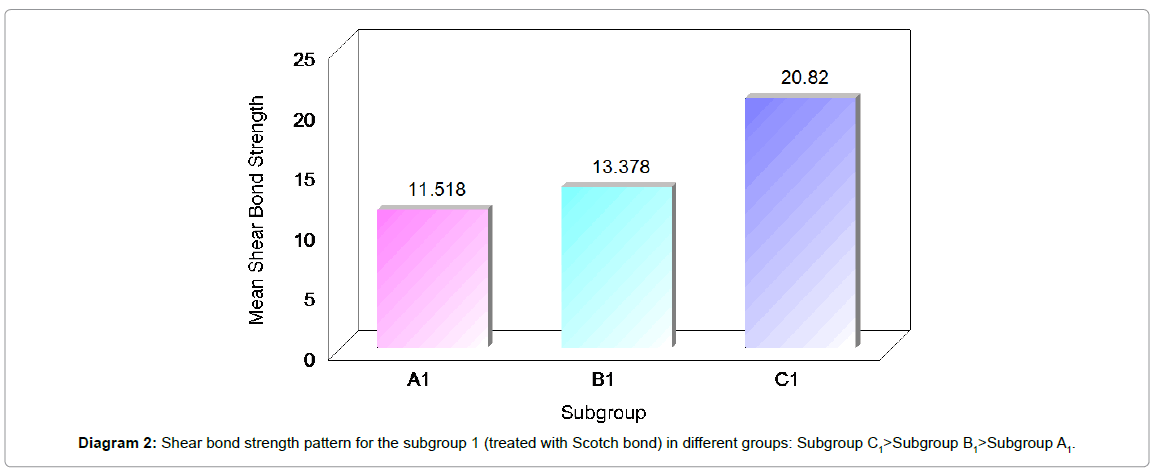
Table 3 shows the intergroup comparison of mean shear bond strength, standard deviation and standard error for Subgroup 1 (samples treated with Scotch Bond). It was seen that the mean shear bond strength was highest for Subgroup C1 followed by Subgroup B1 and then Subgroup A1 (Diagram 2). The standard deviation was maximum in Subgroup A1 followed by Subgroup B1 and then Subgroup C1. The standard error was maximum in Subgroup A1 followed by Subgroup B1 and then Subgroup C1.
| A1 | B1 | C1 | |
|---|---|---|---|
| Number of samples | 5 | 5 | 5 |
| Mean | 11.518 | 13.3780 | 20.82 |
| Standard deviation | 1.9229 | 1.8175 | 0.9550 |
| Standard error | 0.8600 | 0.8179 | 0.4298 |
Table 3: Showing Intergroup Comparison of Shear Bond Strength in Subgroup 1 (Treated with Scotch Bond).
Since ‘F’ is significant, hence shear bond strength differs significantly in subgroups. It is maximum in Subgroup C1 and minimum in A1 (Tables 4 and 5)
| Source of variation | Degree of freedom | Sum of squares | Mean sum of squares | F | ‘p’ |
|---|---|---|---|---|---|
| Between the groups | 2 | 242.284 | 121.142 | 45.928 | <0.001 |
| Within the groups | 12 | 31.652 | 2.638 | ||
| Total | 14 | 273.935 |
Table 4: Showing Analysis of Variance of Shear Bond Strength in Subgroup 1 (Treated with Scotch Bond).
| Comparison | ‘t’ | ‘p’ |
|---|---|---|
| A1 vs B1 | 1.57 | 0.15 (NS) |
| A1 vs C1 | 9.69 | <0.001 |
| B1 vs C1 | 8.11 | <0.001 |
Subgroup C1>Subgroup B1>Subgroup A1
Table 5: Showing Intergroup Comparison of Shear Bond Strength in Subgroup 1 (Treated with Scotch Bond).
On comparing the mean shear bond strength of subgroup A1 to subgroup B1, the mean shear bond strength was higher in subgroup B1 but it was not significant statistically (p=0.15, NS). However, when subgroup A1 was compared with subgroup C1, the mean shear bond strength for subgroup C1 was found to be significantly higher than subgroup A1 (p<0.001). On comparing the subgroup B1 with subgroup C1, once again the mean shear bond strength for subgroup C1 was found to be significantly higher than subgroup B1 (p<0.001).
The above analysis shows the following shear bond strength pattern for the subgroup 1 (treated with Scotch bond) in different groups (Diagram 2):
Subgroup C1>Subgroup B1>Subgroup A1
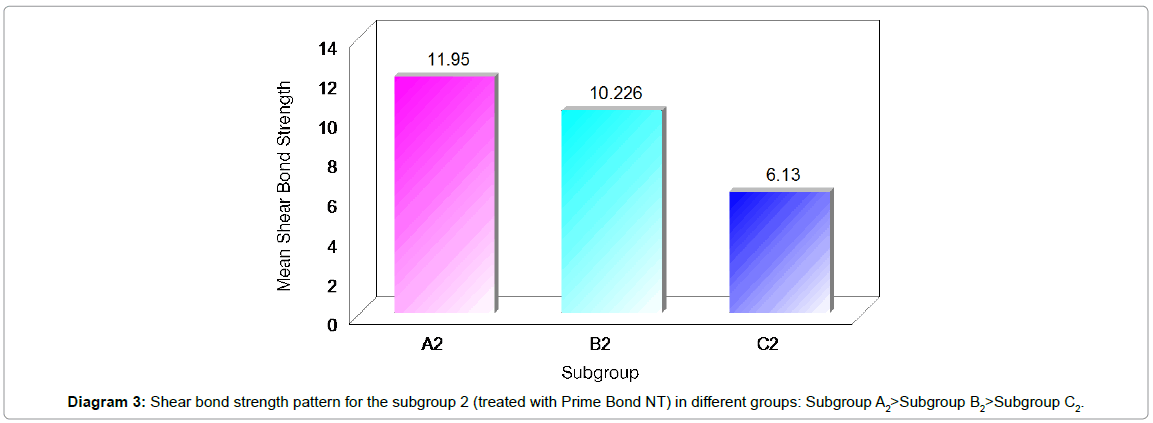
Table 6 shows the intergroup comparison of mean shear bond strength, standard deviation and standard error for Subgroup 2 (samples treated with Prime Bond NT). It was seen that the mean shear bond strength was highest for Subgroup A2 followed by Subgroup B2 and then Subgroup C2 (Diagram 3). The standard deviation was maximum in Subgroup A2 followed by Subgroup C2 and then Subgroup B1/2. The standard error was maximum in Subgroup A2 followed by Subgroup C2 and then Subgroup B2.
| A2 | B2 | C2 | |
|---|---|---|---|
| Number of samples | 5 | 5 | 5 |
| Mean | 11.95 | 10.2260 | 6.1300 |
| Standard deviation | 1.1729 | 0.7161 | 0.7458 |
| Standard error | 0.5245 | 0.3222 | 0.3317 |
Table 6: Showing Intergroup Comparison of Shear Bond Strength in Subgroup 2 (Treated with Prime Bond NT).
Since ‘F’ is significant, hence shear bond strength differs significantly in subgroups. It is maximum in Subgroup A2 and minimum in C2 (Table 7).
| Source of variation | Degree of freedom | Sum of squares | Mean sum of squares | F | ‘p’ |
|---|---|---|---|---|---|
| Between the groups | 2 | 89.370 | 44.685 | 54.968 | <0.001 |
| Within the groups | 12 | 9.755 | 0.813 | ||
| Total | 14 | 99.125 |
Table 7: Showing Analysis of Variance of Shear Bond Strength in Subgroup 2 (Treated with Prime Bond NT).
On comparing the mean shear bond strength of subgroup A2 to subgroup B2, the mean shear bond strength was significantly higher in subgroup A2 (p<0.01). When subgroup A2 was compared with subgroup C2, once again the mean shear bond strength for subgroup A2 was found to be significantly higher than subgroup C2 (p<0.01). On comparing the subgroup B2 with subgroup C2, the mean shear bond strength for subgroup B2 was found to be significantly higher than subgroup C2 (p<0.001) (Table 8).
| Comparison | ‘t’ | ‘p’ |
|---|---|---|
| A2 vs B2 | 2.81 | <0.01 |
| A2 vs C2 | 9.38 | <0.01 |
| B2 vs C2 | 8.88 | 0.001 |
Table 8: Showing Intergroup Comparison of Shear Bond Strength in Subgroup 2 (Treated with Prime Bond NT).
The above analysis shows the following shear bond strength pattern for the subgroup 2 (treated with Prime Bond NT) in different groups (Diagram 3):
Subgroup A2>Subgroup B2>Subgroup C2
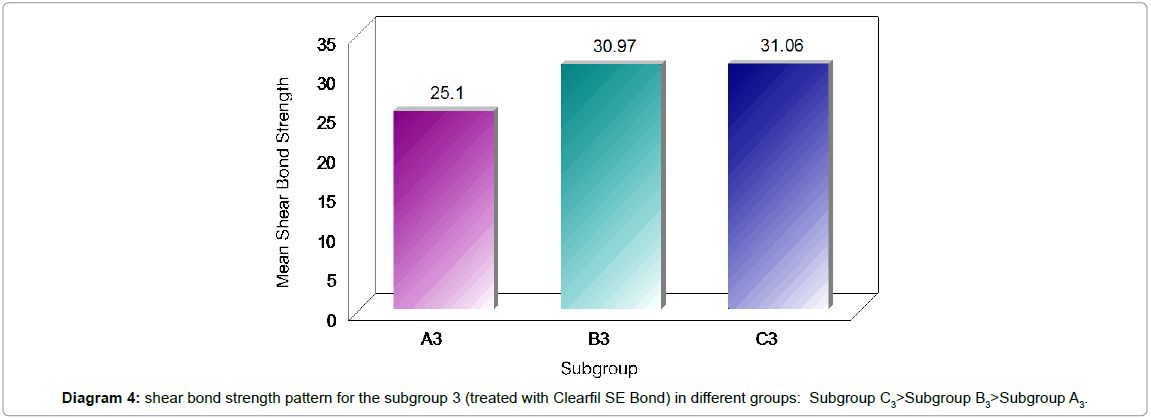
Table 9 shows the intergroup comparison of mean shear bond strength, standard deviation and standard error for Subgroup 3 (samples treated with Clearfil SE Bond). It was seen that the mean shear bond strength was highest for Subgroup C3 followed by Subgroup B3 and then Subgroup A3 (Diagram 4). The standard deviation was maximum in Subgroup A3 followed by Subgroup C3 and then Subgroup B3. The standard error was maximum in Subgroup A3 followed by Subgroup C3 and then Subgroup B3.
| A3 | B3 | C3 | |
|---|---|---|---|
| Number of samples | 5 | 5 | 5 |
| Mean | 25.10 | 30.97 | 31.06 |
| Standard deviation | 3.7107 | 1.0800 | 1.5662 |
| Standard error | 1.6595 | 0.4862 | 0.7002 |
Table 9: Intergroup Comparison of Shear Bond Strength in Subgroup 3 (Treated with Clearfil SE Bond).
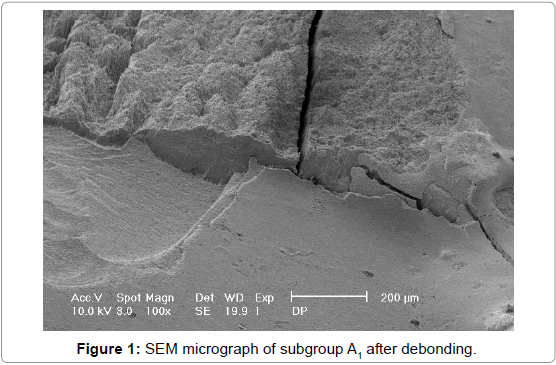
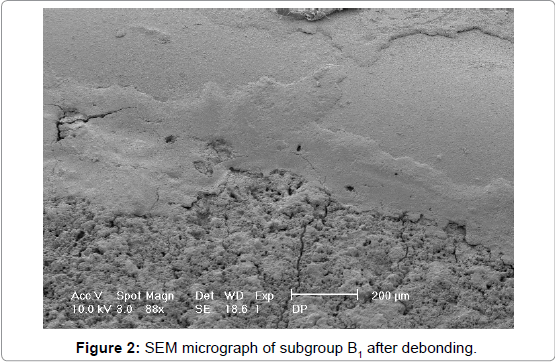
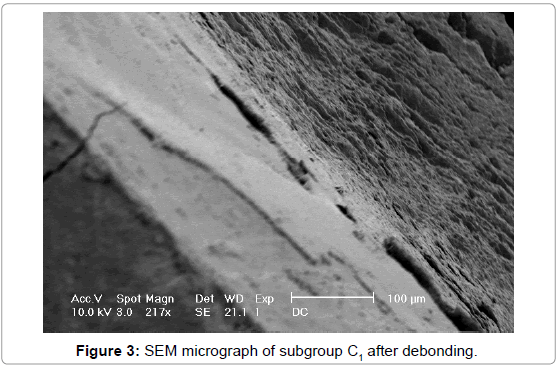
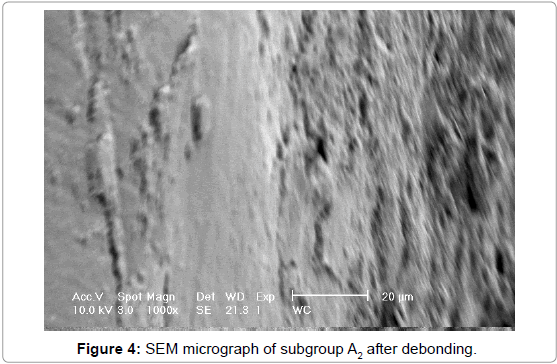
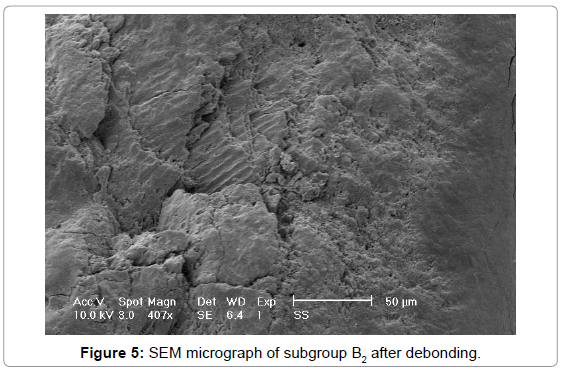
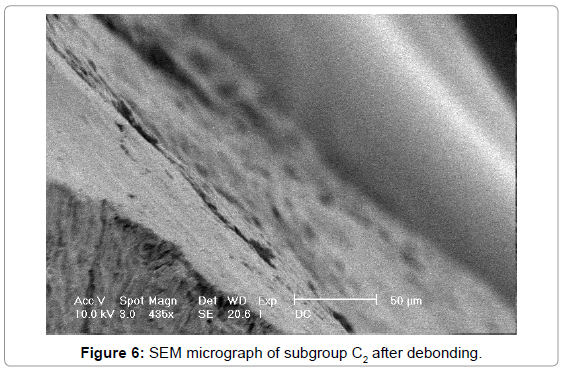
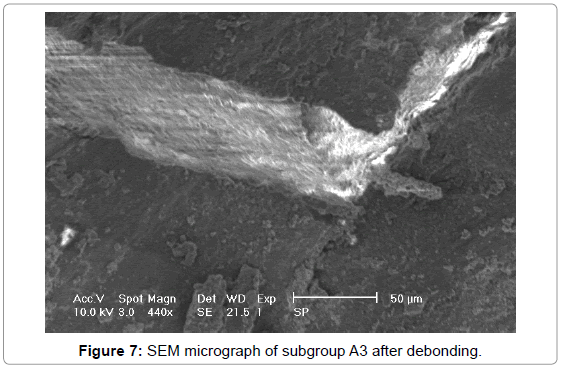
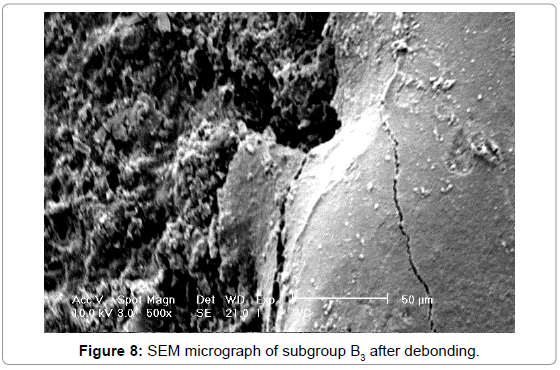
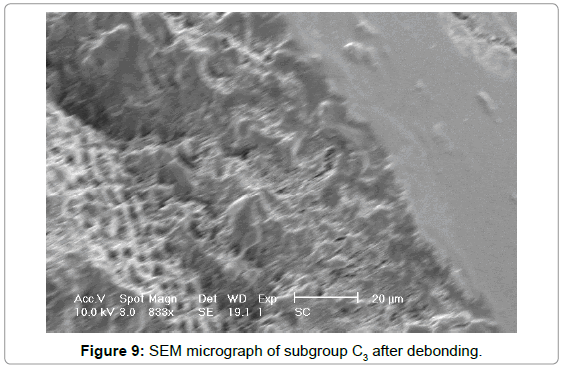
It was observed in SEM of debonded samples that subgroups A3, B3, C3 show cohesive failure in composite. Micrograph of A3, B3, C3 show presence of some composite in debonded area. None of the sample in A1, B1, C1 and A2, B2, C2 show times of cohesive failure. They show adhesive failure. There is no sign of composite in debonded area.
Since ‘F’ is significant, hence shear bond strength differs significantly in subgroups. It is maximum in Subgroup C3 and minimum in A3 (Table 10).
| Source of variation | Degree of freedom | Sum of squares | Mean sum of squares | F | ‘p’ |
|---|---|---|---|---|---|
| Between the groups | 2 | 116.567 | 58.284 | 10.00 | <0.01 |
| Within the groups | 12 | 69.942 | 5.828 | ||
| Total | 14 | 186.509 |
Table 10: Showing Analysis of Variance of Shear Bond Strength in Subgroup 3 (Treated with Clearfil SE Bond).
On comparing the mean shear bond strength of subgroup A3 to subgroup B3, the mean shear bond strength was significantly higher in subgroup B3 (p<0.01). When subgroup A3 was compared with subgroup C3, the mean shear bond strength for subgroup C3 was found to be significantly higher than subgroup A3 (p<0.01). On comparing the subgroup B3 with subgroup C3, the mean shear bond strength for subgroup B3 was found to be higher than subgroup C3 but it was not significant statistically (p=0.91, NS) (Tables 11-13).
| Comparison | ‘t’ | ‘p’ |
|---|---|---|
| A3 vs B3 | 3.39 | <0.01 |
| A3 vs C3 | 3.30 | <0.01 |
| B3 vs C3 | 0.10 | 0.91 (NS) |
Table 11: Showing Intergroup Comparison of Shear Bond Strength in Subgroup 3 (Treated with Clearfil SE Bond).
| A1 | A2 | A3 | |
|---|---|---|---|
| Number of samples | 5 | 5 | 5 |
| Mean | 11.518 | 12.064 | 25.10 |
| Standard deviation | 1.9228 | 1.19 | 3.7108 |
| Standard error | 0.8600 | 0.53 | 1.6595 |
Table 12: Showing Comparison of Shear Bond Strength in Group A.
| Source of variation | Degree of freedom | Sum of squares | Mean sum of squares | F | ‘p’ |
|---|---|---|---|---|---|
| Between the groups | 2 | 593.687 | 296.843 | 47.159 | <0.001 |
| Within the groups | 12 | 75.535 | 6.295 | ||
| Total | 14 | 669.222 |
Table 13: Showing Analysis of Variance of Shear Bond Strength in Group A.
The above analysis shows the following shear bond strength pattern for the subgroup 3 (treated with Clearfil SE Bond) in different groups (Diagram 4):
Subgroup C3>Subgroup B3>Subgroup A3
Table 14 shows the comparison between mean shear bond strength, standard deviation and standard error for Group A. It was seen that the mean shear bond strength was highest for Subgroup A3 followed by Subgroup A2 and then Subgroup A1. The standard deviation was also maximum in Subgroup A3 followed by Subgroup A1 and then Subgroup A2. The standard error was maximum in Subgroup A3 followed by Subgroup A2 and then Subgroup A2.
| Comparison | ‘t’ | ‘p’ |
|---|---|---|
| A1 vs A2 | 0.48 | NS |
| A1 vs A3 | 7.27 | <0.001 |
| A2 vs A3 | 7.51 | <0.001 |
Table 14: Showing Comparison of Shear Bond Strength among the three subgroups of Group A.
Since ‘F’ is significant, hence shear bond strength differs significantly in subgroups. It is maximum in Subgroup A2 and minimum in A2.
On comparing the mean shear bond strength of subgroup A1 to subgroup A2, the differences were found to be statistically nonsignificant. However, when subgroup A2 was compared with subgroup A3, the mean shear bond strength for subgroup A3 was found to be significantly higher than subgroup A1 (p<0.001). On comparing the subgroup A2 with subgroup A3, once again the mean shear bond strength for subgroup A3 was found to be significantly higher than subgroup A2 (p<0.001) (Tables 15 and 16).
| B1 | B2 | B3 | |
|---|---|---|---|
| Number of samples | 5 | 5 | 5 |
| Mean | 13.378 | 10.2260 | 30.9660 |
| Standard deviation | 1.8175 | 0.7161 | 1.0805 |
| Standard error | 0.8179 | 0.3222 | 0.4862 |
Table 15: Showing Comparison of Shear Bond Strength in Group B.
| Source of variation | Degree of freedom | Sum of squares | Mean sum of squares | F | ‘p’ |
|---|---|---|---|---|---|
| Between the groups | 2 | 1249.034 | 624.517 | 375.952 | <0.001 |
| Within the groups | 12 | 19.934 | 1.667 | ||
| Total | 14 | 1268.968 |
Table 16: Showing Analysis of Variance of Shear Bond Strength in Group B.
The above analysis shows the following shear bond strength pattern for the three subgroups of Group A:
Subgroup A3>Subgroup A2>Subgroup A1
Table 15 shows the comparison between mean shear bond strength, standard deviation and standard error for Group B. It was seen that the mean shear bond strength was highest for Subgroup B3 followed by Subgroup B1 and then Subgroup B2. The standard deviation was maximum in Subgroup B1 followed by Subgroup B3 and then Subgroup B2. The standard error was maximum in Subgroup B1 followed by Subgroup B3 and then Subgroup B2.
Since ‘F’ is significant, hence shear bond strength differs significantly in subgroups. It is maximum in Subgroup B3 and minimum in B2.
On comparing the mean shear bond strength of subgroup B1 to subgroup B2, the mean shear bond strength was significantly higher in subgroup B1 at 99% level of confidence (p<0.01). However, when subgroup B1 was compared with subgroup B3, the mean shear bond strength for subgroup B3 was found to be significantly higher than subgroup B1 (p<0.001). On comparing the subgroup B2 with subgroup B3, once again the mean shear bond strength for subgroup B3 was found to be significantly higher than subgroup B2 (p<0.001) (Tables 17-19).
| Comparison | ‘t’ | ‘p’ |
|---|---|---|
| B1 vs B2 | 3.61 | <0.01 |
| B1 vs B3 | 18.60 | <0.001 |
| B2 vs B3 | 35.78 | <0.001 |
Table 17: Showing Comparison of Shear Bond Strength among the three subgroups of Group B.
| C1 | C2 | C3 | |
|---|---|---|---|
| Number of samples | 5 | 5 | 5 |
| Mean | 20.82 | 6.13 | 31.06 |
| Standard deviation | 0.9550 | 0.7418 | 1.5962 |
| Standard error | 0.4298 | 0.3317 | 0.7002 |
| Source of variation | Degree of freedom | Sum of squares | Mean sum of squares | F | ‘p’ |
|---|---|---|---|---|---|
| Between the groups | 2 | 1570.264 | 785.132 | 587.351 | <0.001 |
| Within the groups | 12 | 16.041 | 1.337 | ||
| Total | 14 | 1586.305 |
Table 19: Analysis of Variance of Shear Bond Strength in Group C.
The above analysis shows the following shear bond strength pattern for the three subgroups of Group B:
Subgroup B3>Subgroup B1>Subgroup B2
Table 20 shows the comparison between mean shear bond strength, standard deviation and standard error for Group C. It was seen that the mean shear bond strength was highest for Subgroup C3 followed by Subgroup C1 and then Subgroup C2. The standard deviation was maximum in Subgroup C3 followed by Subgroup C1 and then Subgroup C2. The standard error was maximum in Subgroup C3 followed by Subgroup C1 and then Subgroup C2.
| Comparison | ‘t’ | ‘p’ |
|---|---|---|
| C1 vs C2 | 27.16 | <0.001 |
| C1 vs C3 | 12.31 | <0.001 |
| C2 vs C3 | 31.67 | <0.001 |
Table 20: Comparison of Shear Bond Strength among the three subgroups of Group C.
Since ‘F’ is significant, hence shear bond strength differs significantly in subgroups. It is maximum in Subgroup C3 and minimum in C2.
Table 20 Comparison of Shear Bond Strength among the three subgroups of Group C.
On comparing the mean shear bond strength of subgroup C1 to subgroup C2, the mean shear bond strength was significantly higher in subgroup C1 (p<0.001). However, when subgroup C1 was compared with subgroup C3, the mean shear bond strength for subgroup C3 was found to be significantly higher than subgroup C1 (p<0.001). On comparing the subgroup C2 with subgroup C3, once again the mean shear bond strength for subgroup C3 was found to be significantly higher than subgroup C2 (p<0.001).
The above analysis shows the following shear bond strength pattern for the three subgroups of Group C:
Subgroup C3>Subgroup C1>Subgroup C2
Debonded samples were studied under SEM. It was observed in SEM of debonded samples that a few samples in subgroups A3, B3, C3 show cohesive failure in composite. Micrograph of A3, B3, C3 show presence of some composite in debonded area.
None of the sample in A1, B1 C1 and A2, B2, C2 show signs of cohesive failure. They show adhesive failure. There is no sign of composite in debonded area.
Discussion
Adhesive restorations have become the inseparable part of dentistry. For, success of these restorations bonding between restoration and tooth surface is of utmost importance. Bonding with dentin is far more complex process. The dynamic variable nature of dentin poses significant challenges to bonding between adhesive restoration and dentin.
The purpose of this study was to evaluate the effect of various conditions (moist/ dry) of dentin on bonding with dentin bonding agent and to compare the strength achieved by dentin bonding agent of various systems (acetone/water) under different conditions of dentin (moist/dry). Structure of dentin was also studied under SEM after it was debonded from composite.
Several factors complicate the process of bonding of adhesive resins to dentin. Brannstrom in 1993 showed dentinal fluid under positive pressure from pulp may affect diffusion of monomers in to etched dentin. Structural variability of dentin must also be considered. Intertubular dentin which is ideal for formation of Hybrid layer occupies 96% of dentin surface at DEJ and only 12% near pulp [4,9]. Thickness and tenacity of smear layer attachment to underlying dentin surface also affects bonding. Role of moisture is of utmost importance in dentin bonding with adhesive resins [5].
The central incisors were selected for the study as the use of composite restorations is largely done for esthetically purposes. So it will be relevant to study the behavior of dentin-bonding under various conditions (wet, semi-dry, dry) in central incisors which bear utmost esthetic value.
Teeth were held in resin mold of 15 mm x 20 mm [as specified for Instron machine]. A cavity was prepared in middle third of labial surface of tooth for the ease of testing shear bond strength with Instron machine.
No. 245 bur was used to prepare the cavity and was penetrated till 1/3rd to 1/2 of the length of the bur head. This will place the cavity margins within 0.2 mm of dentin and the chances of pulp exposure were minimized.
Now the samples were divided in three groups. Cavities in group A samples were treated by wet surface treatment before applying dentin bonding agent by swabbing the cavity with wet cotton pellet. It was done to observe the effect of bonding of dentin with dentin bonding agent in wet conditions.
Cavities in Group B samples were treated by semi-dried surface treatment before applying dentin bonding agent by drying the cavity for 3 seconds. It was done to observe the effect of bonding of dentin with dentin bonding agent in semi-dried conditions.
Similarly, cavities in Group C samples were treated by dry surface treatment by drying the cavities by 15 minutes to observe the effect of bonding of dentin with dentin bonding agent in dried condition. Cavities in Group C were dried for 15 seconds because when several teeth were dried and time for complete drying of the teeth was observed then the mean time of the drying of the teeth was found to be 15 seconds.
Now Groups A, B and C were further subdivided into subgroups A1, A2, A3, B1, B2, B3, C1, C2 and C3.
In subgroups A1, B1, C1 Scotch bond was used to line the cavity surface as it has water-based primer so it could be observed that in what conditions of dentin, dentin-bonding agents with water based primers show maximum shear bond strength 2, 3, 4.
In Subgroups A2, B2, C2 Prime-bond NT was used to line the cavity surface as it is acetone based. So it could be observed that in what conditions of dentin acetone-based dentin-bonding agents show maximum shear bond strength.
In Subgroups A3 A3, B3, C3 Clearfil-SE was used to line the cavity surface. Clearfil-SE is also water based but has self-etching primer. Clearfil-SE is placed in sixth generation of dentin-bonding agents. So it can be observed what effect does self-etching primer containing dentin-bonding agent has on shear bond strength with dentin under various conditions.
The choice of dentin-bonding agents served the purpose of the study as it was aimed to observe the effect of various conditions (wet, dry and semi-dry) of dentin on bonding with dentin-bonding agents and comparisons of strengths achieved by various dentin-bonding agents of different systems (water/acetone based) under different conditions of dentin.
After treating the samples by wet, semi-dry or dry surface treatments cavity was filled with Z-100 composite and was light cured. Shear bond strength of all samples were tested using Instron machine.
As shown in Table 5, mean shear bond strength of C1 was highest followed by B1 and A1. It can be explained by the study of Iwami et al. proved that when the water on the dentin surface is less before application of dentin bonding agent, collagen fibers in dentin surface might shrink [8]. Shrinkage of collagen fibers inhibits the infiltration of resin monomers in to dentin and optimal amount of water is necessary to inhibit the shrinkage of collagen fibers. In contrast, excessive water on dentin surface prevents infiltration of resin monomers into the dentin because the concentration of resin monomer in dentin bonding agent decreases. Therefore, optimal water on dentin surface is necessary for the formation of adequate bond strength between resin composite and dentin.
Scotch-bond has water based primer. In wet conditions, it actually over wets the dentin that in turn prevents the infiltration of resin monomers in dentin because the concentration of resin monomers in primer decreases.
In dry condition, Scotch-bond wets the dentin and prevents the shrinkage of collagen fibers, thus helping in better infiltration of resin monomers in dentin.
Table 8 shows that mean shear bond strength of A2 was highest followed by B2 and then C2. It can be explained by the study of Kanca et al. [10,11], which showed that acetone containing dentin bonding agents work well in wet conditions. Acetone present in primer apparently acts as water chasers. Acetone spreads the primer over water coated dentin surface in carried the resin monomer present in primer in to dentin. In addition acetone containing primer on contact with wet dentin surface raise the boiling point of acetone and lower the boiling point of water such that this may enhance removing water in the collagen matrix which in turn exchanges for acetone and finally for the adhesive resins.
Prime-bond NT is acetone based. In wet conditions acetone spreads the dentin bonding agent over water coated dentin surface in carrying resin monomer in dentin.
In dry condition acetone in Prime bond dentin over dries the dentin as acetone is water chaser. So, it causes shrinkage of collagen fibers in dentin and thus minimizes the infiltration of resin monomer in dentin which in turn causes weak bond between dentin and composite.
Table 11 shows that mean shear bond of C3 was highest followed by B3 and A3. It can be explained, as in case of Table 5, as Clearfil-SE is also water-based dentin bonding agent.
High mean shear bond strength [12-14] of A3, B3, C3 as compared to A1, B1, C1 and A2, B2, C2 can be explained by the fact that Clearfil-SE is sixth generation dentin bonding agent whereas Scotch-bond is placed in fourth generation and Prime-bond NT is placed in fifth generation.
These results were in confirmation of earlier studies which prove that optimal amount of water is necessary for dentin for good bonding with composite. Over wetting or over drying both decreases the strength of bond between dentin and composite.
It could be observed from the study that out of subgroups A1, B1, C1, subgroup C1 showed maximum shear bond strength followed by B1 and A1 as Scotch-bond has water based primer and worked best in dry conditions. Of subgroups A2, B2, C2 mean shear bond strength of A2 was highest followed by B2 and C2 as Prime-bond NT is acetone based bonding agent and worked best in wet conditions. Of subgroups A3, B3, C3 mean shear bond strength of C3 was highest followed by B3 B3 and A3 as Clearfil SE is water-based bonding agent and worked best in dry conditions.
So the water-based dentin-bonding agents work well in dry conditions and acetone based dentin-bonding agents work well in wet conditions.
All the bonded samples were scanned under SEM. A few samples of subgroups A3, B3, C3 showed cohesive failure in composite (Figures 7-9). This shows that the fracture occurred within the composite which proves good bonding between dentin and composite. None of the sample showed cohesive failure in composite in subgroups A1, B1, C1 (Figure 1-3) and A2, B2, C2 (Figures 4-6) which show adhesive failures.
This can be explained as the greater strength of the bond formed in sixth generation dentin bonding agent as compared to fourth and fifth generation dentin bonding agents.
Overview of the results shows that moisture plays a vital role in bonding of composite with dentin. Optimal water should be present for better bonding of dentin with composite. If dentin is in dry stage, then water based dentin-bonding agents should be used as they produce best results in dry conditions and if dentin is in wet state then acetone based dentin-bonding agents should be used as they produce best results in wet condition.
Conclusion
From the observations made, statistically analyzed and duly discussed, following conclusions are drawn:
1 Optimal water content is necessary for achieving good bonding between dentin and composite.
2 Water based dentin bonding agents, show maximum shear bond strength with dentin in dry conditions.
3 Acetone based dentin bonding agents show maximum shear bond strength with dentin in wet conditions.
Acknowledgements
This original work is attributed to Department of Prosthodontics, U.P. King George's University of Dental Sciences, Lucknow in collaboration with Central Drug Research Institute, Lucknow.
References
- Benderli Y, Yücel T (1999) The effect of surface treatment on the bond strength of resin composite to dentin. Oper Dent 24: 96-102.
- Berry EA 3rd, von der Lehr WN, Herrin HK (1987) Dentin surface treatments for the removal of the smear layer: an SEM study. J Am Dent Assoc 115: 65-67.
- Gwinnett AJ (1992) Moist versus dry dentin: its effect on shear bond strength. Am J Dent 5: 127-129.
- Gwinnett AJ (1993) Quantitative contribution of resin infiltration/hybridization to dentin bonding. Am J Dent 6: 7-9.
- Solomon A and Beech DR (1983) Bond strengths of composite to dentine using primers. J Dent Res.
- Swift EJ Jr, Triolo PT Jr (1992) Bond strengths of Scotchbond Multi-Purpose to moist dentin and enamel. Am J Dent 5: 318-320.
- Barghi N, Knight GT, Berry TG (1991) Comparing two methods of moisture control in bonding to enamel: a clinical study. Oper Dent 16: 130-135.
- Iwami Y, Yamamoto H, Kawai K, Ebisu S (1998) Effect of enamel and dentin surface wetness on shear bond strength of composites. J Prosthet Dent 80: 20-26.
- Nakabayashi N, Kojima K, Masuhara E (1982) The promotion of adhesion by the infiltration of monomers into tooth substrates. J Biomed Mater Res 16: 265-273.
- Kanca J 3rd (1992) Effect of resin primer solvents and surface wetness on resin composite bond strength to dentin. Am J Dent 5: 213-215.
- Kanca J 3rd (1992) Resin bonding to wet substrate. II. Bonding to enamel. Quintessence Int 23: 625-627.
- Los SA, Barkmeier WW (1994) Shear bond strengths of composite to dentin using newer generation dental adhesive systems. Esthetic Dentistry Update 5: 46-49.
- McGuckin RS, Powers JM, Li L (1994) Bond strengths of dentinal bonding systems to enamel and dentin. Quintessence Int 25: 791-796.
- Mitchem JC, Terkla LG, Gronas DG (1988) Bonding of resin dentin adhesives under simulated physiological conditions. Dent Mater 4: 351-353.
Relevant Topics
- Cementogenesis
- Coronal Fractures
- Dental Debonding
- Dental Fear
- Dental Implant
- Dental Malocclusion
- Dental Pulp Capping
- Dental Radiography
- Dental Science
- Dental Surgery
- Dental Trauma
- Dentistry
- Emergency Dental Care
- Forensic Dentistry
- Laser Dentistry
- Leukoplakia
- Occlusion
- Oral Cancer
- Oral Precancer
- Osseointegration
- Pulpotomy
- Tooth Replantation
Recommended Journals
Article Tools
Article Usage
- Total views: 14443
- [From(publication date):
February-2014 - Apr 03, 2025] - Breakdown by view type
- HTML page views : 9793
- PDF downloads : 4650
