Research Letter Open Access
Evaluation of Environmental Hazards Resulted from Human Activities and Natural Radioactivity in Tuban Delta in Yemen
Emran Eisa Saleh1*, Hesham Ibrahim El Kassas2, Soad Abed Elmenem El Fiki3, Hanan Ahmed Diab4 and Ahmed Ali Saeed Al Nagashee5
1Radiation Physics, Physics Department, Faculty of Science, University of Aden, Yemen
2Soil and Water Environment, Institute of Environmental Studies and Research, Ain Shams University, Egypt
3Radiation Physics, Physics Department, Faculty of Science, Ain Shams University, Egypt
4Nuclear and Radiological Regulatory Authority, Egypt
5Biological Chemistry Department, Faculty of Education Toor-El Baha, University of Aden, Yemen
- *Corresponding Author:
- Emran Eisa Saleh
Radiation Physics, Physics Department
Faculty of Science, University of Aden, Yemen
Tel: +967774701985/+9672269876
E-mail: eesas2009@yahoo.com
Received Date: July 17, 2017 Accepted Date: July 20, 2017 Published Date: July 25, 2017
Citation: Saleh EE, El Kassas HI, El Fiki SAE, Diab HA, Al Nagashee AAS (2017) Evaluation of Environmental Hazards Resulted from Human Activities and Natural Radioactivity in Tuban Delta in Yemen. J Anal Bioanal Tech 8: 374. doi: 10.4172/2155-9872.1000374
Copyright: © 2017 Saleh EE, et al. This is an open-access article distributed under the terms of the Creative Commons Attribution License, which permits unrestricted use, distribution, and reproduction in any medium, provided the original author and source are credited.
Visit for more related articles at Journal of Analytical & Bioanalytical Techniques
Abstract
The knowledge of environmental hazards resulted from natural radioactivity and human activities is very important for monitoring of environmental contamination. In this study, the environmental hazards due to the natural radioactivity and human activities in Tuban delta in Yemen were discussed and evaluated using gamma ray spectroscopy. Thirty soil samples were collected from the study area. The results showed that the mean activity concentrations of 238U series (226Ra), 232Th, and 40K were 16.83 ± 2.3, 24.76 ± 2.3, 646.48 ± 13 Bq kg-1 and 15.22 ± 1.5, 21.99 ± 2.1, 472.58 ± 10 Bq kg-1 for farm soil samples treated with organic and urea fertilizer and farm soil samples treated with urea fertilizer, respectively. The corresponding values were 19.53 ± 1.5, 24.46 ± 3, and 500.76 ± 17 Bq kg-1 for uncultivated soil samples. The activity concentrations of 137Cs showed a significant value in some uncultivated soil samples. Also, physical and chemical properties of some soil samples were discussed and evaluated. A Radiological parameter, an absorbed dose rate in air, and an annual effective dose were calculated and evaluated. The results were compared with those of literature.
Keywords
Environmental hazards; Natural radioactivity; Human activities; Tuban delta
Introduction
The natural background radiation comes from three main sources: cosmic radiation, radiation from terrestrial sources and radioactivity in the body. Most of the background terrestrial radiation a raises from Uranium and Thorium series and 40K. In addition to the natural background radiation, there are several other sources of human exposure, these sources are: diagnostic radiology, therapeutic radiology, use of isotopes in medicine, radioactive waste, fallout from nuclear weapon tests, and occupational exposures from nuclear reactors and accelerations.
Factors influencing the behavior of radionuclides in soils are mainly the chemical properties of the radioelement and the characteristics of the soil, including mineral composition, organic matter content, and chemical reaction milieu [1]. Other factors also affecting the behavior of radionuclides in soil are rainfall amounts, temperature, and soil management. Finally, the pH value is an important parameter controlling the kinetics of elements in soil and the kinetics of radionuclides as well. In order to understand the mobility of radionuclides in soil, it is important to study the inorganic and organic composition of soils. The presence of an inorganic matter (clay minerals and oxides) can cause processes of sorption and complexation. On the other hand, the biological activity can increase radioelement mobility.
This paper deals with the evaluation of environmental hazards resulted from human activities and natural radioactivity in soil samples collected from Tuban Delta, Yemen.
Materials and Methods
Study area
The Republic of Yemen is located in the southern sector of the Arabian Peninsula. Yemen’s land is covered with rocks whose ages date back to an era prior to the Cambrian. Some Cambrian rocks even date to a time before that era (that is, about 3 billion years ago). Geologically speaking, Yemen composes part of the Arabian Shield [2]. Tuban Delta is located in the southern part of Yemen. It extends along Lehg and Aden Governorates, the study areas shown in Figure 1.

Figure 1: Base map of the Tuban Delta, Republic of Yemen.
The Yemen Trap series and flood basalts occur through the Upper Cretaceous and Lower Tertiary in the northwest part of the study area to the north of the study area, the Yemen Trap series is very extensive and thick [3]. It associated with the flood basalts which are a swarm of granitic and pegmatitic dikes that strike NW-SE. Several individual dikes with lengths exceeding 50 km [4].
Climate
The study area climate is hot and arid, becoming semi-arid further inland over the Tuban catchment. Rainfall amounts are low and are highly variable, both really and temporally. Both study area and catchment lie south of the northern tropic and are subjected to monsoonal and Mediterranean weather influences. As will be seen 1ater, most study area, and catchment rainfall occur from March to May, and in larger amounts from June to September. The underlying weather systems are different during each of these two seasons [5].
Table 1 shows some records of temperature and relative humidity. It also displays the mean of sunshine and run of the wind for months in the year 2004. These data are obtained from Saber station in Lehg governorate. Temperatures reach their lowest values in January and the greatest values in September. Somewhat surprisingly, the mean of sunshine is greatest in October during the latter part of the Summer flood season. Low values are in January.
| Jan | Feb | Mar | Apr | May | Jun | Jul | Aug | Sept | Oct | Nov | Dec | |
|---|---|---|---|---|---|---|---|---|---|---|---|---|
| Rainfall, mm | 0 | 0 | 1 | 14 | 5 | 1 | 9 | 4 | 16 | 0 | 0 | 0 |
| Mean air temp, ºC | 24.5 | 25.2 | 26.6 | 28.6 | 29.3 | 30.7 | 30.5 | 29.7 | 29.6 | 28.7 | 25.9 | 24.3 |
| Daily max temp, ºC | 28.0 | 28.6 | 30.0 | 31.8 | 34.1 | 35.7 | 34.9 | 34.4 | 34.4 | 32.5 | 30.8 | 28.8 |
| Daily min temp, ºC | 19.4 | 20.3 | 21.4 | 23.0 | 24.4 | 25.6 | 26.2 | 25.2 | 24.7 | 20.9 | 19.8 | 19.8 |
| Mean sunshine, W/m2 | 124.7 | 232.3 | 247.8 | 293.9 | - | - | - | - | 249.1 | 281.7 | 255.8 | 177.8 |
| Wind run, m/s | 2.28 | 6.2 | 7.3 | 2.0 | 1.78 | 1.77 | 2.08 | 2.04 | 2.9 | 7.9 | 5.8 | 7.1 |
| Relative humidity, % | 78.4 | 73.5 | 74.2 | 69 | 74 | 70 | 71 | 70 | 73 | 70 | 69 | 73 |
Note: All values are average except rainfall, for which median values are quoted.
Table 1: Study area monthly climate summary.
Chemical analysis
• A particle size distribution was carried out by the international Pipette method [6] by using sodium hexametaphosphate as a dispersing agent.
• A calcium carbonate content was measured by using Collin's Calcimeter method [7].
• A saturation soil paste extract was analyzed for determining Ece and soluble ions, as well as, soil pH was measured in the soil water suspension 1:2.5 [8].
• An organic matter content was determined by using the modified Walkley and the black method as described by Jackson [8].
• The cation exchange capacity (CEC) and the exchangeable sodium % (ESP) were determined by using sodium acetate and ammonium acetate of pH 7, respectively [7].
Sampling and sample preparation for gamma spectrometry
A total of 30 surface soils samples were collected from the study area. After collecting the stones, the inorganic materials were removed, then the samples were dried in low- temperature oven at 105°C for 48 hours to ensure that moisture is completely removed. The samples were crushed and grounded to a fine grain size of about 1 mm and sieved in order to remove the big sizes. The samples were sealed in polyethylene containers of 100 cm3 and left for one month, before measuring them by gamma spectrometer, to allow secular equilibrium between 226Ra and its decay products.
Radioactivity measurements
One of the most valuable techniques for low-level radioactivity measurements is gamma ray spectrometer. The various systems, consisting of semiconductor detectors coupled to multichannel analyzers, provide for a rapid simultaneous measurement of many radionuclides in the same sample.
In this study, each sample was measured by using HPGe with 35% efficiency and 1.9 keV resolution. The spectrum was collected and analyzed by using computer software called Maestro software. These measurements processes were carried out in Egyptian atomic Energy Authority Laboratory. The spectrometer was calibrated for efficiency and energy.
Calculation of the radiological parameters
The most widely used to evaluate the activity concentration of materials containing 226Ra, 232Th, and 40K is the radium equivalent activity (Raeq). Radium equivalent activity can be calculated from the following relation [9].
Raeq=ARa+(ATh × 1.43)+(AK × 0.077) (1)
where ARa, ATh and AK are the activity concentration of 226Ra, 232Th and 40K in Bq kg-1 respectively.
The external hazard index, Hex, is calculated by using mathematical expression for the purpose of estimating hazards caused by gamma radiation that naturally occurs. The external hazard index, Hex, is defined by some scientist [9] as:
Hex=ARa/370+ATh/259+Ak/4810 ≤ 1 (2)
where ARa, ATh and AK are the activity concentrations of 226Ra, 232Th and 40K in Bq kg-1 respectively. The value of this index must be less than unity for the radiation risk from building material to be negligible. The internal exposure to radon and its daughter products is quantified by the internal hazard index, Hin, which is defined by Beretka and Mathew [9] as follows:
Hin=ARa/185+ATh/259+AK/4810 ≤ 1 (3)
where ARa, ATh and AK are the activity concentrations of 226Ra, 232Th and 40K, respectively.
The representative level index, Iγ, is defined by the following equation:
Hin=ARa/185+ATh/259+AK/4810=1 (4)
where ARa, ATh and AK are the activity concentration of 226Ra, 232Th and 40K, in Bq kg-1, respectively.
The restriction on building materials for gamma radiation is based on a dose range of 0.3-1 mSv year-1 [10]. For the representative level index Iɤr ≤ 2 corresponds to a dose criterion of 0.3 mSv year-1, while Iɤr ≤ 6 corresponds to 1 mSv year-1 in the report of the European Commission [11]. The total absorbed dose rates D, at 1 m above the ground level, to the population, can be calculated from activities of terrestrial radionuclides according to the following formula [12].
D=0.462 ARa+0.604 ATh+0.042 AK (5)
where: ARa, ATh and AK are activity concentrations of 226Ra, 232Th and 40K, in Bq kg-1, respectively.
In addition, the annual effective dose rates indoors (E) (measured in mSv y-1) was calculated assuming a value of 0.7 Sv/Gy for the conversion factor from absorbed dose in air to the annual effective dose received by adults and a 0.8 factor for the indoor occupancy [13]. The formula used is:
E (μSv y-1)=d (nGy h-1) × 24 h × 365.25 d × 0.8 × 0.7 Sv/G y × 10-6 (6)
The annual effective dose of a member of the public by 0.3 mSv y-1 at the most, which is the excess gamma dose to that received outdoors. Within the European Union, doses exceeding 1 mSv y-1 should be taken into account from the radiation point of view (EC 2000).
Results and Discussion
Physicochemical properties of soil samples
Textural classes of the studied soil samples: Textural analysis has been performed to classify the studied soils into their main types [14]. Table 2 shows the textural analysis of some soil samples collected from the study area. These types are the clay loam, silt clay, loam and silty clay loam. The clay loam is the main soil type in the investigated area, which occupies most Tuban delta.
| S. No. | Particle size distribution | Texture | Gypsum (%) | |||
|---|---|---|---|---|---|---|
| C. Sand | F.Sand | Silt | Clay | |||
| 1 | 3.24 | 12.39 | 50.62 | 31.75 | SCL | 0.42 |
| 2 | 3.97 | 15.29 | 45.37 | 35.09 | CL | 0.54 |
| 3 | 8.78 | 20.35 | 39.40 | 31.47 | CL | 0.18 |
| 4 | 11.05 | 27.80 | 37.99 | 23.35 | L | 0.64 |
| 11 | 3.16 | 25.93 | 38.13 | 32.78 | CL | 0.72 |
| 12 | 9.4 | 22.73 | 35.46 | 32.40 | CL | 0.78 |
| 13 | 8.37 | 10.41 | 45.9 | 35.27 | SC | 0.27 |
| 21 | 6.62 | 15.39 | 50.26 | 27.73 | CL | 0.98 |
| 22 | 7.64 | 20.56 | 46.03 | 28.77 | CL | 0.99 |
| 23 | 7.36 | 18.20 | 36.93 | 37.52 | CL | 0.68 |
where; SCL=Silty clay loam; CL=Clay loam; L=Loam; SC=Silty clay.
Table 2: Particle size distribution of the soil representing the studied area.
Total salinity: Several classification systems were elaborated to set up an adequate standard for covering the measured EC of the soil saturation extract into salinity classes. The approximate limits of salinity classes were defined in the [14], as in Table 2. As shown in the Table 3, three samples fall in the slightly saline class, and seven samples fall in strongly saline class.
| Soil class | Class Name | EC dSm-1 at 25°C |
|---|---|---|
| 0 | Salt free | 0-4 |
| 1 | Slightly saline | 4-8 |
| 2 | Moderately saline | 8-15 |
| 3 | Stroungly saline | >15 |
Table 3: Classification of saline soils, from Ref [14].
Organic matter and calcium carbonate contents: The organic matter content in samples under study is extremely high (exceeding 6.1 g/kg) in all of the studied samples. The organic matter ranges from 1.40 to 2.75%. Also, data in the Table 3 illustrate that calcium carbonate (CaCO3) values range from 3.85% to 15.93%, these results reveals that these soil samples are calcareous.
Sodium Adsorption Ratio (SAR): Sodium Adsorption Ratio (SAR), is defined by:
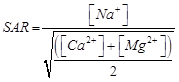
where the concentration of the cations is in meq/l. It indicates that the degree to which cation exchange reactions occur in the soil. As sodium replaces Ca and Mg on clays and colloids, it causes the expansion or "swelling" of clay particles and leads to a reduction in permeability and hardening of the soil. SAR should remain low enough so that Na occupies a low portion of the exchange complex. The structure and drainage properties of most soils remain good when SAR values remain below 10 [15]. The quality classification of soil samples, based on SAR value is given in Table 3.
Table 3 shows that the soil samples from the Tuban delta are as follows: 4 samples were low sodium hazard, 3 samples were medium, and 3 samples were high sodium hazard.
Cationic and anionic composition: Table 3 shows the cationic and anionic composition of some soil and rocks samples, the soluble cations are often dominated at the studied samples with Ca2+, Mg2+, and Na+, while K+ is the least soluble cation. For the study soil Na+>Ca2+>Mg2+. The predominance of Na+, Ca2+, and Mg2+ is a true reflection of the involvement of a marine origin in soils formation.
Regarding the anionic distribution, CO32- is absent in all of the studied samples. The distribution of the other anionic followed the descending order: Cl->SO42->HCO3- for all studied samples.
Radioactivity concentrations
The activity concentrations (Bq kg-1) of the natural radioactivity due to 238U series (226Ra), 232Th, and 40K of soil samples are given in Table 4. From the table, the activity concentrations of 238U series (226Ra) ranged from 17.34 ± 2.1 to 21.6 ± 1.3 with an average value 19.53 ± 1.5 Bq kg-1 in uncultivated soil samples. The corresponding values are from 12.18 ± 2.37 to 20.96 ± 1.6 with an average value 16.83 ± 2.3 Bq kg-1, for farm soil samples treated with organic and urea fertilizer. The activity concentrations of 238U series (226Ra) for farm soil samples treated with urea fertilizer ranged from 11.1 ± 1.87 to 19.64 ± 2.16 with an average value 15.22 ± 1.5 Bq kg-1. 232Th activity concentrations in uncultivated soil samples ranged from 20.18 ± 1.7 to 31.2 ± 1.9 with an average value 24.46 ± 3 Bq kg-1. The corresponding values for farm soil treated with an organic and urea fertilizer are from 17.8 ± 1.9 to 28.79 ± 2.38 with an average value 24.67 ± 2.25 Bq kg-1. The activity concentrations of 232Th for farm soil samples treated with urea ranged from 16.63 ± 1.38 to 25.88 ± 2.28 with an average value 21.99 ± 2.1 Bq kg-1. 40K values ranged from 465.75 ± 10.66 to 544.04 ± 9.89 with average value 500.76 ± 17 Bq kg-1 for uncultivated soil samples, whereas the corresponding values for farm soil samples treated with organic and urea fertilizer are from 515.68 ± 14.4 to 787.06 ± 11.08 with an average value 646.48 ± 13 Bq kg-1. The activity concentrations of 40K for soil samples treated with urea ranged from 308.51 ± 15.21 to 538.0 ± 13.76 with average value 472.58 ± 10 Bq kg-1. From the Table 4, it can be concluded that the mean activity concentrations of 238U(226Ra) for uncultivated soil samples are higher than the mean activity concentrations of the farm soil samples. This may be due to human activities such as using oil, and natural gas to produce electric energy in this area [16]. These activities can enhance the local activity concentrations. On the other hand, farm soils have been cultivated and irrigated, water helps to remove the radionuclides and minerals from the surface soil and transports them to the underground level. Also, in the farm soil, plants have been taken up radionuclide from soil, and this is expressed as soil-to-plant transfer factors.
| Type of sample | pH | EC (dS/m) | CaCO3 % | Organic matter % | SAR % | ESP % | Soluble cations (m molel-1) | Soluble anions (m molel-1) | ||||||
|---|---|---|---|---|---|---|---|---|---|---|---|---|---|---|
| Ca2+ | Mg2+ | Na+ | K+ | CO32- | HCO3- | Cl- | SO42- | |||||||
| 21 | 7.73 | 38.64 | 8.60 | 1.69 | 24.88 | 26.15 | 252 | 102 | 331 | 4.20 | * | 3.00 | 330.0 | 356.2 |
| 2 | 8.09 | 6.14 | 4.22 | 1.85 | 6.46 | 7.6 | 15.8 | 30.30 | 31.0 | 0.52 | * | 3.0 | 30.0 | 44.62 |
| 3 | 8.53 | 5.82 | 15.93 | 2.25 | 9.43 | 11.23 | 16.10 | 19.80 | 40.00 | 0.51 | * | 3.00 | 40.0 | 33.41 |
| 4 | 7.49 | 8.56 | 12.84 | 1.46 | 12.65 | 14.82 | 20.80 | 24.20 | 60.0 | 0.81 | * | 1.50 | 59.0 | 45.31 |
| 11 | 7.26 | 66.30 | 8.46 | 1.88 | 57.20 | 45.39 | 305.0 | 200.0 | 909.0 | 6.40 | * | 2.00 | 905.0 | 513.4 |
| 12 | 6.94 | 95.50 | 11.50 | 1.68 | 9.33 | 11.11 | 321.0 | 149.0 | 1430.0 | 10.10 | * | 0.50 | 1418.0 | 491.0 |
| 13 | 7.70 | 27.1 | 7.5 | 2.75 | 2.38 | 2.21 | 91.0 | 79.10 | 220.0 | 2.90 | * | 2.0 | 218.0 | 173.0 |
| 21 | 7.67 | 50.41 | 9.85 | 1.95 | 58.61 | 46.00 | 156.0 | 92.00 | 653.0 | 5.90 | * | 2.50 | 650.0 | 254.4 |
| 22 | 7.64 | 124.46 | 7.64 | 1.40 | 21.79 | 23.40 | 173.0 | 83.0 | 2465.0 | 11.0 | * | 2.50 | 2462.0 | 267.05 |
| 23 | 7.54 | 105.43 | 3.85 | 1.75 | 216.22 | 27.30 | 163.0 | 77.80 | 2372.0 | 11.80 | * | 1.50 | 2370.0 | 253.0 |
Where, *Fail
Table 4: Physical and chemical analysis of the studied soils samples.
The mean values of activity concentrations of 40K and 232Th in the farm soil samples treated with an organic and urea fertilizer are higher than the mean values of activity concentrations of 40K and 232Th in the uncultivated soil samples and the farm soil samples treated with urea fertilizer. This is may be due to using an organic fertilizer which contains a high percentage of K element, which leads to enhance the activity concentrations of 40K in the soil.
From the Table 5, we noticed that the activity concentrations of 137Cs showed in some uncultivated soil samples (2, 3, 4, 8 and 9). Anthropogenic radionuclide 137Cs transport from one place to another on the earth with air and the rainwater helps to remove radioactivity from the troposphere and transport it to the earth’s surface [1].
| S. No. | Site | Type of soil | U-238 series (Ra-226) | Th-232 series (Ra-228) | K-40 | Cs-137 |
|---|---|---|---|---|---|---|
| 1 | Al Khudad | A | 19.46 ± 1.71 | 23.14 ± 1.87 | 544.04 ± 9.89 | <DL |
| 2 | Al Husainy | A | 18.2 ± 0.9 | 24.2 ± 2.1 | 490 ± 17 | 2.4 ± 0.3 |
| 3 | Wadi Sagheer | A | 21.1 ± 1.5 | 25.4 ± 2.7 | 511.2 ± 18 | 1.05 ± 0.3 |
| 4 | Al Shutaif | A | 19.7 ± 1.4 | 24.8 ± 4.4 | 489 ± 17 | 4.1 ± 0.4 |
| 5 | Ubr Luslom | A | 19.85 ± 1.4 | 23.3 ± 1.7 | 513.1 ± 10.3 | <DL |
| 6 | Um Garba | A | 17.34 ± 2.10 | 20.18 ± 1.69 | 465.75 ± 10.66 | <DL |
| 7 | Beet Eyad | A | 20.5 ± 1.1 | 24.3 ± 2.9 | 491.8 ± 16.8 | <DL |
| 8 | Al Hamra | A | 19.5 ± 1.5 | 26.1 ± 2.6 | 500 ± 17 | 7.05 ± 0.5 |
| 9 | Wadi kabeer | A | 21.6 ± 1.3 | 31.2 ± 1.9 | 521 ± 18 | 7.9 ± 0.5 |
| 10 | Beet Eyad | A | 18.07 ± 1.65 | 21.95 ± 1.86 | 481.66 ± 9.22 | <DL |
| Mean | 19.53 ± 1.5 | 24.46 ± 3 | 500.76 ± 17 | 2.3 ± 0.4 | ||
| 11 | Al Khudad | B | 17.66 ± 1.72 | 26.71 ± 1.95 | 787.06 ± 11.08 | <DL |
| 12 | Al Husainy | B | 15.21 ± 2.18 | 25.04 ± 2.60 | 735.57 ± 17.51 | <DL |
| 13 | Wadi Sagheer | B | 18.9 ± 1.6 | 25.06 ± 2.12 | 646.4 ± 13.2 | <DL |
| 14 | Al Shutaif | B | 20.96 ± 1.60 | 28.37 ± 1.66 | 650.89 ± 9.51 | <DL |
| 15 | Ubr Luslom | B | 12.18 ± 2.37 | 23.30 ± 2.71 | 629.73 ± 19.92 | <DL |
| 16 | Um Garba | B | 17.03 ± 1.65 | 27.17 ± 1.89 | 635.00 ± 9.98 | <DL |
| 17 | Beet Eyad | B | 16.29 ± 2.25 | 19.61 ± 1.89 | 616.59 ± 12.49 | <DL |
| 18 | Al Hamra | B | 13.83 ± 1.41 | 24.81 ± 2.29 | 515.68 ± 14.40 | <DL |
| 19 | Wadi kabeer | B | 20.5 ± 2.1 | 28.79 ± 2.38 | 632.9 ± 13.6 | <DL |
| 20 | Al Huta | B | 15.7 ± 0.95 | 1.9 ± 17.8 | 615 ± 13.9 | <DL |
| Mean | 16.83 ± 2.3 | 24.67 ± 2.25 | 646.48 ± 13 | |||
| 21 | Al Khudad | C | 12.43 ± 1.99 | 23.55 ± 2.36 | 308.51 ± 15.21 | <DL |
| 22 | Al Husainy | C | 15.75 ± 2.17 | 25.88 ± 2.28 | 538.00 ± 13.76 | <DL |
| 23 | Wadi Sagheer | C | 14.02 ± 2.04 | 19.5 ± 1.8 | 510.60 ± 13.77 | <DL |
| 24 | Al Shutaif | C | 13.68 ± 1.34 | 16.63 ± 1.38 | 448.42 ± 9.68 | <DL |
| 25 | Ubr Luslom | C | 15.89 ± 1.16 | 23.54 ± 2.07 | 536.73 ± 12.81 | <DL |
| 26 | Um Garba | C | 19.64 ± 2.16 | 22.21 ± 1.68 | 477.57 ± 10.17 | <DL |
| 27 | Beet Eyad | C | 16.63 ± 2.24 | 25.50 ± 2.07 | 435.51 ± 13.08 | <DL |
| 28 | Al Hamra | C | 11.10 ± 1.87 | 19.43 ± 1.76 | 435.74 ± 10.52 | <DL |
| 29 | Wadi kabeer | C | 14.29 ± 1.90 | 21.5 ± 1.7 | 522.21 ± 14.42 | <DL |
| 30 | Al Huta | C | 18.77 ± 1.68 | 22.15 ± 1.78 | 512.54 ± 9.50 | <DL |
| Mean | 15.22 ± 1.5 | 21.99 ± 2.1 | 472.58 ± 10 | <DL |
where, A: Uncultivated soil; B: farm soil treated with organic and urea fertilizer; C: farm soil treated with urea.
Table 5: The Activity concentrations of 226Ra, 232Th, 40K, and 137Cs for soil samples under study.
From the Tables 2 and 5 we noticed the increase of activity concentrations of series (226Ra) and 232Th with the increase of the percentage of clay in the soil. This is may be due to the increase of clay minerals, montmorillonite, and kaolinite. Also, clay soil helps to catch the soluble minerals and radionuclides from water higher than another type of soils like sand and silt. The clay particles are smaller than 2 μm in diameter when sand and silt soils have a particle size, from 50 μm to about 2 mm, from 2 to 50 μm, respectively.
The results for the radiological parameters such as the radium equivalent activity, the external and internal hazard index, gamma index, the absorbed dose rate in air, and the annual effective dose of the studied samples are presented in Tables 3-5. All results of radiological parameters and calculation doses were lower than the allowed maximum value reported in UNSCEAR [17].
To compare the natural radioactivity of soil under study with the Yemeni soils in other areas, [18] study the natural radioactivity of 40K, 226Ra, 232Th in soil samples collected from Abyan Delta in Yemen, who found the activity concentrations of 226Ra, 232Th, and 40K for soil irrigation by the flood water samples were 34.9, 84.5, and 1232.7 Bq kg-1, respectively, and for the soil samples irrigation by groundwater were 30.24, 63.64, and 1096 Bq kg-1, respectively, which reveals that the activity concentrations of the soil samples from Abyan delta are nearly twice higher than the activity concentrations of the soil samples under the study.
Geologically, this means that the origin of soil for delta Tuban and delta Abyan is different. El-Mageed et al. [19] study the activity concentrations of 40K, 226Ra, and 232Th in soil samples collected from around Juban town in Yemen, the study shows that the average activity concentrations of these radionuclides were higher than the activity concentrations of the soil samples under the study. Also, El-kamel et al. [20] study the activity concentrations of 40K, 226Ra, and 232Th in the soil samples collected from Alsalamia-Al-Homira area in Abyan governorate. The study shows that the activity concentrations of 40K, 226Ra, and 232Th for clay and sandy soil were much higher than the activity concentrations of the soil samples under study.
Also, the mean activity concentrations of 226Ra, 232Th, and 40K for the samples under study were compared with similar studies in other countries and the results are given in Table 6. From Table 7, the average activity concentration of 232Th for the samples under the study are lower than that reported by other countries except in case of Egypt reported by (Ahmed and El-Arabi [21], Jordan (ma'an) reported by Saleh and Shayeb [22], and Saudi Arabia (Taif) reported by Al Aydaraus [23]. 226Ra values from the present work are lower than that reported by other countries except in case of Egypt (Qena) reported by Ahmed and El- Arabi [21]. The average activity concentration of 40K for the samples under the study are higher than values in other countries except in cases of Bangladesh [24] and Malaysia [25].
| S. No. | Raeq (Bq kg-1) | Iɤ | Hex | Hin | Dose rate (nGy h-1) | E (mSvy-1) |
|---|---|---|---|---|---|---|
| 1 | 94.4 | 0.36 | 0.26 | 0.31 | 45.7 | 0.31 |
| 2 | 90.5 | 0.35 | 0.24 | 0.29 | 43.4 | 0.30 |
| 3 | 96.8 | 0.37 | 0.26 | 0.32 | 46.4 | 0.32 |
| 4 | 92.8 | 0.35 | 0.25 | 0.30 | 44.4 | 0.31 |
| 5 | 92.7 | 0.35 | 0.25 | 0.30 | 44.6 | 0.31 |
| 6 | 82.1 | 0.31 | 0.22 | 0.27 | 39.6 | 0.27 |
| 7 | 93.1 | 0.35 | 0.25 | 0.31 | 44.6 | 0.31 |
| 8 | 95.3 | 0.36 | 0.26 | 0.31 | 45.6 | 0.31 |
| 9 | 106.3 | 0.40 | 0.29 | 0.35 | 50.4 | 0.35 |
| 10 | 86.5 | 0.33 | 0.23 | 0.28 | 41.7 | 0.29 |
| Mean | 93.06 | 0.35 | 0.25 | 0.30 | 44.64 | 0.31 |
| 11 | 116.5 | 0.45 | 0.31 | 0.36 | 57.4 | 0.39 |
| 12 | 107.7 | 0.42 | 0.29 | 0.33 | 53.1 | 0.36 |
| 13 | 104.5 | 0.40 | 0.28 | 0.33 | 51.0 | 0.35 |
| 14 | 111.6 | 0.43 | 0.30 | 0.36 | 54.0 | 0.37 |
| 15 | 94.0 | 0.37 | 0.25 | 0.29 | 46.2 | 0.32 |
| 16 | 104.8 | 0.40 | 0.28 | 0.33 | 50.8 | 0.35 |
| 17 | 91.8 | 0.36 | 0.25 | 0.29 | 45.3 | 0.31 |
| 18 | 89.0 | 0.34 | 0.24 | 0.28 | 42.9 | 0.29 |
| 19 | 110.4 | 0.42 | 0.30 | 0.35 | 53.3 | 0.37 |
| 20 | 88.5 | 0.35 | 0.24 | 0.28 | 43.9 | 0.30 |
| Mean | 101.88 | 0.39 | 0.28 | 0.32 | 49.78 | 0.34 |
| 21 | 69.9 | 0.26 | 0.19 | 0.22 | 32.6 | 0.22 |
| 22 | 94.2 | 0.36 | 0.25 | 0.30 | 45.3 | 0.31 |
| 23 | 81.2 | 0.31 | 0.22 | 0.26 | 39.7 | 0.27 |
| 24 | 72.0 | 0.28 | 0.19 | 0.23 | 35.2 | 0.24 |
| 25 | 90.9 | 0.35 | 0.25 | 0.29 | 44.0 | 0.30 |
| 26 | 88.2 | 0.34 | 0.24 | 0.29 | 42.4 | 0.29 |
| 27 | 86.6 | 0.33 | 0.23 | 0.28 | 41.1 | 0.28 |
| 28 | 72.4 | 0.28 | 0.20 | 0.23 | 35.1 | 0.24 |
| 29 | 85.2 | 0.33 | 0.23 | 0.27 | 41.5 | 0.28 |
| 30 | 89.9 | 0.34 | 0.24 | 0.29 | 43.5 | 0.30 |
| Mean | 83.05 | 0.32 | 0.22 | 0.27 | 40.03 | 0.27 |
Table 6: The calculated values of radium equivalent, gamma index, (external, internal) hazard index, total absorbed dose and annual effective dose in samples under investigation.
| Country | 226Ra (Bq kg-1) |
232Th (Bq kg-1) |
40K (Bq kg-1) |
References |
|---|---|---|---|---|
| Bangladesh | 84 | 141 | 1944 | [24] |
| Egypt (Qena) | 13.7 | 12.3 | 162.8 | [21] |
| India | 44.97 | 59.7 | 217 | [30] |
| Jordan (Northern Jordan) | 42.5 | 26.7 | 291.1 | [26] |
| Jordan (Ma’an) | 57.7 | 18.1 | 138.1 | [18] |
| Lebanon | 4-73 | 5-50 | 57-554 | [27] |
| Malaysia | 12-968 | 11-1210 | 12-2450 | [25] |
| Saudi Arabia (Taif) | 23.8 | 18.6 | 162.8 | [28] |
| Yemen (Juban) | 44.4 | 58.2 | 822.7 | [19] |
| Yemen (Assalamia-Al- Homira) clay | 41.46 | 68.68 | 1224.7 | [20] |
| Yemen (Abyan delta) Farm soil* Farm soil** |
34.9 30.24 |
84.5 63.64 |
1232.7 1096 |
[18] |
| Uncultivated Soil | 19.53 ± 1.5 | 24.46 ± 3 | 500.7 ± 17 | |
| Farm soil1 | 16.83 ± 2.3 | 24.67 ± 2.3 | 646.5 ± 13 | Present work |
| Farm soil2 | 15.22 ± 1.5 | 21.99 ± 2.1 | 472.6 ± 10 | [29-39] |
| World wide | 32 | 45 | 412 | [17] |
where: *farm surface soil irrigation by flood water; **farm surface soil irrigation by groundwater; 1farm soil treated with organic and urea fertilizer; 2Farm soil treated with urea
Table 7: Comparison of mean activity concentrations (Bq kg-1) in soil with other countries of the world.
Conclusion
1. Physical and chemical properties for some soil samples were discussed. The soil under this study is characterized by a texture mainly clay loam. The organic matter content in the samples under the study is extremely high (exceeding 6.1 g/kg) in all of the studied samples, also, calcium carbonate (CaCO3) values in samples were high. These means that the soil samples under our study are calcareous.
2. The cationic and anionic composition of samples under our study were dominated at the studied samples with Ca2+, Mg2+, and Na+, while K+ is the least soluble cation. For the soil Na+>Ca2+>Mg2+, The predominance of Na+, Ca2+, and Mg2+ is a true reflection of the involvement of marine origin in soils formation.
3. The results of activity concentrations of 238U series (226Ra), 232Th, and 40K in the farm soil samples treated with organic and urea fertilizer and farm soil samples treated with urea were (16.83, 24.67, and 646.48 Bq kg-1), and (15.22, 21.99, and 472.58 Bq kg-1), respectively, while that of the uncultivated soil samples were 19.53, 24.46, 500.76 Bq kg- 1, respectively. These results are below the recommended levels by (UNSCEAR 2008) [17] report.
4. The average values of the radium equivalent activity (Raeq), the external hazard index and the internal hazard index, gamma index (Iɤ), the absorbed dose rate, annually effective dose for farm soil treated with an organic and urea fertilizer and farm soil treated with urea under investigation are 101.88, and 83.05 Bq kg-1 for Raeq, and 0.39, 0.32 for Iɤ and 0.28, 0.22 for Hex, 0.32, 0.27 for Hin, and 49.78, 40.03 nGy y-1 for the absorbed dose rate in air and 0.34, 0.27 mSv y-1 for the annual effective dose. These values are below the recommended value reported by UNSCEAR.
5. These results will be as a reference for any changes in the environmental radioactivity to study area in the future.
References
- Koch-Steindl H, Pröhl G (2001) Considerations on the behaviour of long-lived radionuclides in the soil. Radiation and Environmental Biophysics 40: 93.
- Al-Khirbash S, Takla MA, Abdulwahad M, Sakran SH (2001) Tectonic evaluation of the Southeast Precambrian Complex. Yemen Sana'a Univ Sci Bull 14: 67-83.
- Kruck K (1996) Explanatory Notes on the Geological Map of the Republic of Yemen – Western Part (Former Yemen Arab Rupublic). Geologisches Jahrbuch, B87.
- KOMEX (2002) Water resources management studies in the Tuban-Abyan region. Sana'a: National Water Resources Authority.
- Atkins W, Binnie C (1982) Feasibility study for Wadi Bana and Abyan Delta. Hydrology and water resources, Annex A.
- Piper CS (1953) Soil and plant analysis. Agric Research Inst, Ocland University, Australia.
- Richard LA (1954) Diagnosis and improvement of saline and alkalie soils: US Dept. of agriculture. Handbook 60: 160.
- Jackson ML (1973) Soil chemical analysis. Prentice Hall Inc., Englewood Cliffs, MJ, USA.
- Beretka J, Mathew P (1985) Natural radioactivity of Australian building materials, wastes, and byproducts. Health Physics 48: 287-293.
- NEA-OECD (1979) Nuclear Energy Agency. Exposure to Radiation from Natural Radioactivity in Building Materials. NEA Group of Experts, OECD, Paris.
- EC (1999) European Commission Report on Radiological Protection Principles Concerning the Natural Radioactivity of Building Materials. Radiation Protection, p: 112.
- UNSCEAR (1988) United Nations Scientific Committee on the Effect of Atomic Radiation. Sources, Effects and Ionizing Radiation, New York: United Nation.
- UNSCEAR (2000) United Nations Scientific Committee on the Effect of Atomic Radiation. Sources, Effects and Ionizing Radiation, New York: United Nation.
- Sinyakova SI, Klassova NS (1951) Soil Survey Staff Manual, Soil survey Manual. US Dept Agric Handbook 18: 503.
- Hem JD (1985) Study and Interpretation of the Chemical Characteristics of Natural Water. US Geol Survey Water supply paper 2254.
- Bolivar J, García-Tenorio R, García-León M (1995) Enhancement of natural radioactivity in soils and salt-marshes surrounding a non-nuclear industrial complex. Science of the Total Environment 25: 137-174.
- UNSCEAR (2008) United Nations Scientific Committee on the Effect of Atomic Radiation. Sources, Effects and Ionizing Radiation, New York: United Nation.
- Saleh (2015) Enhancement of natural radioactivity in farm surface soils from Abyan Delta in Yemen. Int J Low Radiation 10: 1.
- El-Mageed AI (2010) Assessment of Natural and Anthropogenic Radioactivity Levels in Rocks and Soil in The Environments of Juban Town in Yemen. Radiation Physics and Chemistry 80: 710-715.
- El-Kamel AEH (2012) Natural Radioactivity of Environmental Samples and their Impact on the Population at Assalamia-Alhomira Area in Yemen. Geosciences 2: 125-132.
- Ahmed NK, El-Arabi AGM (2005) Natural radioactivity in farm soil and phosphate fertilizer and its environmental implications in Qena governorate Upper Egypt. Environmental Radioactivity 84: 51-64.
- Saleh H, Abu Shayeb M (2009) Natural radioactivity distribution of southern part of Jordan (Ma'an) Soil. Annals of Nuclear Energy 65: 184-189.
- El-Aydarous A (2007) Gamma Radioactivity levels and Their Corresponding External Exposure of Some Soil Samples from Taif Governorate, Saudi Arabia. Global journal of Environmental Research 12: 49-53.
- Hamid B, Chowdhury MI, Aslam MN, Islam MN (2002) Study of Natural radionuclides concentration in area of elevated radiation background in the northern districts of Bangladesh. Rdiation Protection Dosimetry 98: 227-230.
- Saleh MA, Ramli AT, Alajerami Y, Aliyu AS (2013) Assessment of environmental 226Ra, 232Th and 40K concentrations inthe region of elevated radiation background in Segamat District, Johor, Malaysia. Environmental Radioactivity 124: 130-140.
- Al-Hamarneh IF, Awadallah MI (2009) Soil radioactivity levels and radiation hazard assessment in the highlands of northern Jordan. Radiation Measurements 44: 102-110.
- El Samad O, Baydoun R, Nsouli B, Darwish T (2013) Determination of natural and artificial radioactivity in soil at North Lebanon province. Environmental Radioactivity 125: 36-39.
- Bakr WF, Ebaid YY (2011) Quantification of uncertainties in Gamma ray spectrometric measurements: A case study. Journal of Nuclear and Radiation Physics 6: 55-67.
- Beck H, Decombo J, Gologak J (1972) In situ Ge(Li) and Nai(Tl) gamma ray spectrometry. New York: Health and Safety laboratory AEC.
- Dhawal MR (2013) Natural radioactivity study in soil samples of south Konkan. Maharashtra, India, Radiation Protection Dosimetry 157: 225-233.
- Ewea HARSA (2007) Assessment of Potential Water Resources in Abyan Area- Southern Yemen. Civil Engineering Research Magazine 23: 5.
- Heikal M, Lebda ELM, Al-Kotba AM, Feras SY (2007) Petrochemical characteristics and radioactivity potential on the Precambrian rocks of Juban- nawah area, se sana'a Yemen Republic. Assiut, Egypt, The fifth international conference on the geology of Africa.
- IAEA (1989) Measurement of radionuclides in food and the environment., Vienna: International Atomic Energy Agency. Technical Reports Series, 229.
- KOMEX (1999) Approved Inception Report, Tuban-Abyan Deltas Water Resources Study. Report to UNDESA. Komex file KI-5290.
- Krisiuk E (1971) A study of radioactivity in building materials. Leningrad: Research Institute for Radiation Hygiene.
- Malanca ADG (1996) Distribution of 226Ra, 232Th and 40K in soils of Rio Grande do Norte (Brazil). Environmental Radioactivity 30: 55-67.
- Nicholas T (1987) Measurement and detection of radiation. Hemisphere Publishing Corporation, Washington, New York, London 15: 467-476.
- Pöschl M, Leo Nollet ML (2007) Radionuclides concentrations in food and the environment. Boca Raton London, New York, Taylor & Francis Group.
- Ramli A (1997) Environmental terrestrial gamma radiation dose and its relationship with soil type and underlying geological formation in Pontian District, Malaysia. Applied Radiation and Isotopes 48: 407-412.
Relevant Topics
Recommended Journals
Article Tools
Article Usage
- Total views: 3929
- [From(publication date):
August-2017 - Jul 06, 2025] - Breakdown by view type
- HTML page views : 3048
- PDF downloads : 881