Evaluation of ENSO Impact on Surface Water Storage of Awash River Basin in Ethiopia
Received: 30-Dec-2022 / Manuscript No. JESCC-23-85145 / Editor assigned: 02-Jan-2023 / PreQC No. JESCC-23-85145 (PQ) / Reviewed: 16-Jan-2023 / QC No. JESCC-23-85145 / Revised: 31-Mar-2023 / Manuscript No. JESCC-23-85145 (R) / Published Date: 07-Apr-2023
Abstract
El Nino/Southern Oscillation (ENSO) is one of the most important and best characterized mechanisms of global climatic variations impact on the surface water. It has tremendous impacts on local, regional and global climatic conditions by disordering the normal patterns. Tropical water resource is very sensitive to climatic anomalies that jeopardize the performance of power generation capacity by generating water shortage during El Nino years. Ethiopia is confined within the tropics and hydroelectric power generation was depending on water, but this condition same time unpredictable due to climate extremes i.e. flooding and drought that was related in ENSO phenomena. The koka dam hydropower project site is confined in Ethiopia. Climate of this region is highly influenced by global circulation patterns that govern the local climate. Therefore, during El Nino years the stream flow and runoff fluctuation of Awash river shows strong reduction. The study results revealed that ENSO has played a great role in modulating the seasonal rainfall over the upper, middle and lower Awash river which in turn influences both the stream flow and runoff. In particular, it has induced power fluctuation problem over the Awash river that significantly affect the quality and quantity of hydroelectric power generation as well as the user of this river for cultivation and other purpose. In view of this, we propose that skillful early warning can be well practiced by acquiring appropriate lead time climate based forecasting of on the possible occurrence of extremes weather events stream flow and runoff fluctuation.
Keywords: ENSO; Runoff; Stream flow; Awash basin; Fluctuation
Introduction
Ethiopia is located between 3°N-15°N to 33° E-48°E within the tropical region of Africa. The country’s topography is composed of massive highland complex of mountains and dissected plateaus divided by Great Rift Valley running generally Southwest to Northeast [1]. The Awash river basin, which was also confined in central rift valley of Ethiopia, is divided into upper, middle and lower Awash basin. The source of Awash river is the central plateau in the west of Addis Ababa and flows into Lake Abbe near Djibouti. Awash rivers starts at an elevation of about 3,000 m in the central Ethiopian high lands, west of Addis Ababa and flows Northeast wards along the rift valley in to the Afar triangle where it terminates in lake Abe at an elevation of 250 m above sea level. The main river length is about 1,200 kilometers (EVDSA 1989). The Awash basin covers a total area of 110,000 km2 and comprises three regions Oromia, Afar, Amhara, Addis Ababa city administration and Dire Dawa council. A number of tributaries of Awash river originate from the western escarpment of the rift valley. The climate of Awash river varies from humid to arid climate over central Ethiopia and arid climate over Afar low lands. Thus predictability of rainfall over the catchment is quite difficult particularly along the arid area the kiremt season, the season rain contributes about three fourth of rains to the annual rain fall budget. The interannual variability of rainfall is generally attributed to the slowing varying boundary conditions of sea surface temperature and other atmospheric parameters. Studies in the past have established a link between the inter annual variability of rainfall and the ENSO phenomenon [2]. The interannual variability in Belg as well as Kiremt rainfall occasionally lead to large scale droughts and flood over the catchment, resulting in a serious reduction in the capacity of power production, water for irrigation and drinking over the downstream.
Due to the high climate variability and climate extremes there were limited number of observations over the large area of a basin, it is always difficult to precisely determine the degree of influence of the anomaly of climate on the flow regimes. The current study mainly deals with the interaction between same climatic parameters with river Awash basin; more specifically the study intended to investigate in depth whether there are climate variability/extremes over the region by considering same regional and global climatic factors and identify their effects on stream flow in relation to water storage of Awash river basin. This paper responds the question of how one can use historic time series data to present a formal way of predicting the response of water level and stream flow to climate variability [3]. Moreover, the study aims to underpin the response of water level to climate variability and predict the stream flow of Awash river basin. The study also intended to identify which climate indices (ENSO conditions), affecting the water storage of Awash river basin by using climatic factors as inputs to strengthen the existing early warning system. Stream flow simulation and prediction have been widely used in water resources management, particularly for flood and drought analysis and for the determination of optimal operational rules for reservoir systems used for water supply and energy production. Here we include climate information in a Multiple Linear Regression predictive (MLR) model in order to provide monthly as well as seasonal stream flow for Koka hydropower sites in Ethiopia. Large scale climate information is included in the MLR model using climate indices obtained from the sea surface temperature field of the tropical Pacific. The outcome of this study would help the policy makers and hydrologists in order to predict the overall stream flow fluctuation and water storage of the Awash dam based on the climatic factors that might be minimize the intended poor water resource management and poor hydroelectric generation capacity in Ethiopia [4]. The use of such information would also be helpful for strengthening early warning systems in the processes of applying proper electric power utilization.
Materials and Methods
Description of study area
The Awash basin is part of the Great Rift Valley in Ethiopia located from 8.5°N to 12°N. It covers a total area of 110,000 km2 of which 64,000 km2 comprises the Western catchment, drains to the main river or its tributaries. The remaining 46,000 km2, most of which comprises the so called eastern catchment, drains into a desert area and does not contribute to the main river course. The Awash basin has been traditionally divided into four distinct zones as given in the Table 1. These are; upper basin, upper valley, middle valley and lower valley [5]. The Awash basin covers the central and Northern part of the rift valley and is bounded to the West, Southeast and South by the Blue Nile, the rift lakes and the Wabi Shebele basins respectively. The main highway from Addis Ababa to Assab traverses the entire length of the Awash valley. The other highway runs up to Awash where it continues eastward to Dire Dawa and further across the Wabi Shebele atershed to Harar and on to Jijiga. An alternative route linking with the Assab road at mile runs along the western escarpment from Addis Ababa, serving the larger industrial centers of Kombolcha and Desse. Furthermore, the main railway links Addis Ababa and the port of Djibouti.
| Designation | From | To |
|---|---|---|
| Upper basin | Headwaters | Koka dam |
| Upper valley | Koka dam | Awash station |
| Middle valley | Awash station | Gewane (d/s) |
| Lower valley | Gewane (d/s) | Lake Abe |
Table1: The Awash basin has been traditionally divided into four distinct zones.
Climate condition of the study area seasonal rainfall distribution over the Awash basin
The climate of the Awash basin comes under the influence of the Inter Tropical Convergence Zone (ITCZ). This zone of low pressure marks the convergence of dry tropical easterlies and the moist equatorial westerlies [6]. The seasonal rainfall distribution within the basin results from the annual migration of the ITCZ. In March, the ITCZ advances across the Basin from the South, bringing the small or spring rains. In June and July it reaches its most northerly location beyond the basin, which then experiences the heavy or summer rains. It then returns southwards during August to October, restoring the drier easterly airstreams which prevails until the cycle repeats itself in March. The annual rainfall distribution resulting from this cycle is exhibited most clearly in the two distinct rainy periods, which are characteristic of the northern plains of the basin. Moving southwards the more prolonged exposure to the moist air stream is evident in the tendency for the two dominant rainy periods to merge into a contiguous distribution. On the high plateau to the west of Addis Ababa, the rainfall distribution shows a continuous increase from the Belg rains to the Kiremt peak rainfall. The distribution of rainfall over the highland areas is modified by orographic effects and is significantly correlated with altitude. The mean annual rainfall varies from about 1,600 mm at Ankober, in the highlands Northeast of Addis Ababa to 160 mm at Asayita on the northern limit of the basin. Addis Ababa receives 90% of its annual rainfall during the rainy period March (Belg season) to September (Kiremt season) as shown in the figure [7]. At Dubti, the same overall proportion is received during the two rainy periods, distributed 30% and 60% respectively. The mean annual rainfall over the entire western catchment is 850 mm and over the headwaters of the Awash, as gauged at Melka Hombole it is 1216 mm. Over the eastern catchment, the mean annual rainfall is estimated to be 456 mm. The annual and monthly rainfalls are characterized by high variability.
Potential Evapotranspiration (PET) of the Awash basin
Potential Evapotranspiration (PET) is also significantly correlated with altitude. At Wonji, in the upper valley, the mean annual PET is 1,810 mm, over twice the mean annual rainfall, with average monthly rainfall exceeding average monthly evapotranspiration only in July and August. At Dubti, in the lower valley the mean annual PET is 2,348 mm, which is over ten times the mean annual rainfall.
Temperature and wind condition of Awash basin
Mean annual temperatures range from 20.8°C at Koka to 29°C at Dubti, with the highest mean monthly temperatures at these stations occurring in June, at 23.8°C and 33.6°C respectively as shown in Figures. Mean annual wind speeds at Koka averages 1.2 m/s, the windiest months being June and July with mean monthly values of 1.9 m/s and 1.6 m/s respectively. At Amibara, the mean monthly wind speed values in June and July are over 2 m/s.
Surface water resources of Awash river basin
The Awash river rises on the high plateau to the West of Addis Ababa, at an altitude of about 2,500 m. It then flows Eastwards, through the Becho plains area and is joined by several small tributaries before entering Koka reservoir, created by a dam, commissioned in 1,960. At the outlet to Koka the total catchment area is some 11,500 km2. The Awash then descends into the rift valley and flows northeastwards to Awash station, being joined by smaller tributaries draining from the eastern section of the watershed. Beyond Awash station, the river trends northwards receiving contributions from a number of sub catchments from the western escarpments, most notably the Kesem and Kebena. The large expanse of catchment to the East of the river, accounting for some 40% of the total basin area, does not contribute any surface runoff to the river [8]. This area, of some 47000 km2 extent, known as the eastern catchment, loses all runoff into the vast expanse of desert plains, which stretches from the escarpment northwards to the terminal lakes. The main river channel passes adjacent to the Gedebassa swamp in a low flow channel with the main river floods passing into the swamp and partially returning, attenuated and reduced in amount, into the river channel downstream, which has a much reduced capacity. The main contributing sub-catchments in the lower part of the river are the Mile and Logiya rivers. After this, the Awash turns abruptly eastwards and flows through a series of fresh water lakes, terminating in the salt lake Abe, at an elevation of 250 m. The total length of the main river course is some 1,200 km.
Surface runoff into Koka reservoir
The mean annual runoff into Koka reservoir amounts to some 1,660 Mm3. About 90% of this runoff occurs in the period July to October. This decreases to 1,390 Mm3 at Awash station being depleted larger by losses from Koka and by upper valley irrigation diversions. Immediately upstream of Gedebassa swamp, the mean annual flow is around 2300 Mm3, given the level of irrigation abstraction. The mean annual flow is around 2200 Mm3 at Tendaho. At Tendaho, some 75%-80% of the mean annual runoff arrives during the periods March to May and July to October. The total mean annual water resource of the Awash basin amounts to some 4,900 Mm3 of which some 3,850 Mm3 is utilizable, the balance being largely lost to Gedebassa swamp and elsewhere in the river system. This equates to a runoff coefficient of approximately 15% from the upper basin. The total area of the western catchment is 63,850 km2 and the eastern catchment is 47,360 km2. Within the western catchment there are a series of hydrologically closed basins which total some 5,050 km2.
Problem statement
Ethiopia is endowed with abundant water resources distributed in many parts of the country however; this water resource highly vulnerable to the impact of climatic variability, which fluctuates the mean annual inflow, outflow, surface water resource and influences hydropower production, sites in the country. Among Ethiopian rivers Awash basin is intensively utilized river basin in Ethiopia due to its strategic location, access roads and available land and water resources. In particular, the exploitation of water resource potentials in relation to ENSO events was not noticeably successful in spite of being given priority as a major field of national development considering the substantial hydropower resources, irrigation and recreational use of water in Ethiopia. However, the climate information, which issued in real time may minimize risk and design proper water resource utilization system according to seasonal climate outlooks. In addition to the fluctuation of in rainfall amount in Kiremt and Belg, season due to ENSO events which also affects the stream flow, runoff and surface water resource from difference tributaries. Decision in water resource and hydrological sectors, globally renowned ENSO impacts have not yet fully documented and presented in useful manner. This current study is therefore, intended to fill the gabs on the weakening of surface water resource fluctuation due to the climate ongoing variability.
Objectives of the study
This study addresses the relationship exist between climate variability, stream flow and surface water resource of Awash river basin. The main objective of this study is, to assess the impact of climate variability on stream flow, runoff and surface water resource of river Awash and its hydropower production.
The specific objectives are:
• To formulate the relationship between climate variability indices
with stream flow, rainfall and runoff over river Awash sub-basin
stations.
• To identify the years in which the surface water resource and surface
runoff over Awash river attain maximum and minimum peaks.
• To develop a statistical model that enables to assess and predict the
surface water resource of river Awash from difference tributaries by
using climate factors as input.
• To design policy planning on ways to use climate information in the
process of proper water utilization system in hydro power
production and Irrigation.
Scope of the study
This study attempts to show which ENSO phase is highly associated with surface water resource of river Awash and their relationship in hydropower management, to provide insight into the preparation of an early warning system pertinent to hydrological sectors. This could be done by using station level rainfall and temperature data, ENSO indices (SST and SOI) data, runoff and stream flow data of river Awash. The SYSTAT software was used to perform appropriate analysis in determining the linear linkage between stream flow of river Awash and climate patterns. Multiple liner regression models are then used to demonstrate the pattern of climate variability and surface water resource response to climate variability impact. Finally by using the above statistical software and global climatic, stream flow and runoff data are used to develop multiple liner regression models that enable us to quantify (predict) the surface water resource of river Awash basin during Kiremt season.
Significance of the research
Hydrologist, electric power disseminators and governmental body they need to know the period of stream flow, runoff and rainfall fluctuation. Under various circumstances, it is very difficult and impractical to control these phenomena without proper make use of potential indicators on reasonable time lags. Thus, research helps the hydrologist, and electric power disseminators to predict the stream flow, rainfall and runoff fluctuation in seasonal basis, so that hydrologist and the governmental body can utilize this information within the reasonable lead period work. Hence, this study is expected to fill the knowledge gap on the understanding of relationship that might be existing between climate indices and stream flow, rainfall and runoff at upper, middle and lower Awash river. Moreover, the results will farther explicit opportunities related to the scope of stream flow over the wider ranges. Based on the skill of the designed predictive models the local community as well as cultivated area and hydropower managers could utilize information as primary input in designing early stage protective measure and minimize the adverse effect of climate related fluctuations of surface water resource of Awash river basin.
Data base
Monthly rainfall and temperature data used in this study are obtained from the Ethiopian national meteorological agency. The data series includes monthly stream flow and runoff for Awash river basin obtained from Ministry of Water Resources (MoWR). Besides all the above data, parameters used in this study are global Sea Surface Temperature (SST) obtained from the ERSST and extracted from the site. This data contains improved and time extended reconstructed global data based on COADS data. Which are available for 2° × 2° grids square covering the global ocean and other water bodies for our study period? Monthly and seasonal average SST is used to evaluate the relationship between the stream flow and runoff over Awash river with, rainfall fluctuation as well as surface water management both currently and with lead in time. Specifically, we investigate the strength relationship in which the SST leads the stream flow fluctuation in relation to rainfall over Awash river basin.
This study attempts to demonstrate the impact of climate variability on Awash river surface water storage and related damage due to the fluctuation of climate variability in this area as well as the cultivated by Awash river. To fulfill these aims, various statistical techniques are employed. Based on stations data and global indices long term mean and standard deviation is computed by using SYSTAT software. Standardized Rainfall Anomalies (SRAi), computed by subtracting the long term mean from all of the rainfalls and dividing the result by the standard deviation. The generated standardized rainfall anomalies help us to compare rainfall anomalies over Awash river stations in terms of their year to year means fluctuation back into 1975, in relation to ENSO indices. It also enables us to assess systematic relationship of rainfall, SOI/SST, climate variability impact over surface water storage of Awash river. Standard rainfall anomalies, is statistically expressed as;

Where X̄ is long term mean of rainfall in given months.


SDi=Standard deviation rainfall given months or years.
SRAi=Standardized rainfall anomalies of Awash river basin stations.
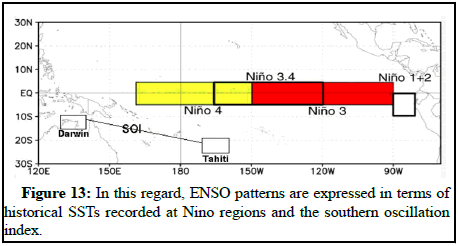
We also show the result of ENSO signal on year to year fluctuation of surface water resource over Awash river basin. In this case monthly rainfall amount (mm) is computed for years having El Nino, La Nina or neutral episodes. The ENSO phase is assigned using the classification by NOAA, based on ERSST.v3b SST anomalies in the Niño3.4 region (5°N-5°S, 120°W-170°W) and SOI given on Web page: For the analysis of climate variability data, 4 months averages of SOI and SST where calculated for February to May and June to September for each year. The degree to which the surface water resource fluctuation happens over Kiremt, during this period is important in determining the stream flow fluctuation exposed for climate variability problems over Awash river boundary. During Belg, the analysis is done using lead/lag relationship. We used simple linear correlation analysis to establish the relationship between upper, middle, lower Awash river and SOI/SST records over range of temporal scale. The correlation analysis also used to calculate the correlation between stream flow and runoff and monthly and seasonal maximum, minimum and average temperatures, total rainfall and relative humidity recorded at different time. Cross correlation analysis and autocorrelation analyses that enable us, to detect any lag/lead relationship between various variables.
Correlation coefficient (r) is denoted:

Where;
xi and yi are climate stream flow, runoff data ith periods.
i=1,2 ……… n, in number of a years.
Finally, by using SYSTAT software, Multiple Linear Regression model (MLR) is constructed in order to quantify surface water resource and its projection based on number of regional and global climatic factors. In addition to this, we employed SYSTAT software in extracting, analyzing and performing appropriate analysis in determining the linear linkage between stream flow and runoff and climate patterns.
The designed MLR model is expressed as;

Where;
γ=It is the response variable.
β=It is intercept.
B1=It is the slope coefficient for the ith explanatory variables, i= 1,2….k.
εi=It is ith remaining unexplained noise in the data (ith error term).
Missing data
In filling missing climatic data, number of statistical and meteorological techniques can be used. Among these, the following methods are widely applied: Arithmetic mean, mean ratio method, isohyetal and correlation method. Among these techniques we employed mean ratio method as it usually attains better skill and suitable for computation. Mean ratio method, is generally acceptable and suitable to fill missing data for regions with large number of rain gauge network that are evenly spaced over the homogenous climatic zone. The method that all stations within the zone are highly correlated which may not be the case. The mean ratio is mathematically expressed as:

Test of consistency
Consistency of rainfall records is tested by double mass curve method. This method deals with the comparison between accumulated annual or seasonal rainfall of the station with the concurrent accumulated mean annual or seasonal rainfall of the group of surrounding rain gauge stations. In order to apply the cumulative test: First, calculate the cumulative rainfall of the inconsistent station after arranging in descending order. Secondly, calculate the cumulative of mean rainfall of the base station after arranging in descending order. Thirdly, prepare double mass curve by plotting the cumulative of mean rainfall of the base station on X-axis and the cumulative rainfall of inconsistent station on Y-axis as shown in the Figure 1 and for individual stations the double mass curve given under appendix of figure. Finally, find out the regime, which is under inconsistency. It is demarked by getting the change in the slope of the double mass curve. Data related to this regime are needed for correction, which is done by multiplying a factor known as correction factor. The correction factor is the ratio of the slope of straight line of consistent and inconsistent data regime, which is expressed as:

Fc= Correction factor, dimensionless.
Sb=Slope of the straight line of consistent data regime.
Sa=Slope of straight line of inconsistent regime.
Results and Discussion
Evaluation of the Kiremt and Belg seasonal rains over Awash sub basin stations based on ENSO events
The ENSO state modulates the rainy seasons in some regions, particularly in the tropics. For instance, over Awash sub basin stations ENSO can lead to seasonal shifting of the normal rainy season resulting in shorting or lengthening (i.e. by late starting and late withdraw of Kiremt season) Kiremt (June to September, JJAS) rainy season. Even though JJAS is a major rainy season over Awash sub basin the ENSO events have thought to be shifting the normality of rain and apparently the water storage of the Awash basin. Besides, it changes the mean monthly rainfall, which disturbs the normal stream flow of Awash sub basin and resulted in the fluctuation of mean monthly inflow (QIN) into the hydropower networking systems of koka hydropower.
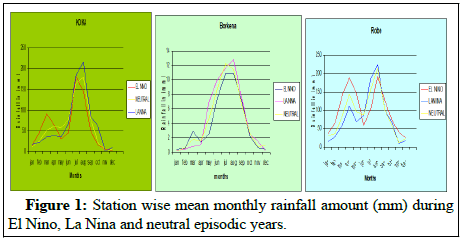
The overall results shows that the mean monthly Kiremt rainfall amounts over Borkena, Robe and Koka significantly increased during La Nina events over the aforementioned stations of Awash sub basin. However; during El Nino events Kiremt rainfall is weakened and decreases (suppressed), which was found below the La Nina and Neutral episodes (Figure 1). The results also showed that La Nina events favored a further temporal extension of Kiremt season beyond its normal cessation. The presence of anomalous wet season and its extension most of the time resulted in increasing of stream flow and runoff into the reservoir of Awash basin, therefore; during this episodic year somewhat lower water reserves might be carried into this wet season and somewhat higher water use might be appropriate in the early weeks of a wet season. Similarly during El Nino episodic year the converse would be true in order to balance our inflow (Qin) and outflow (Qout) into hydropower networking systems of Koka hydropower.
These stations are characterized by bimodal type rainy seasons with high rains prevail during July-September rainy season (Figure 2).
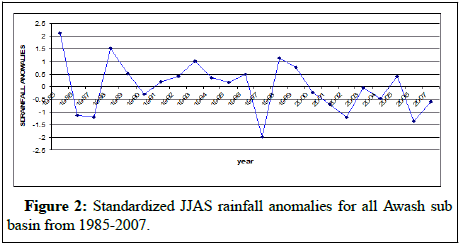
Generally, analyses have shown that the Kiremt rainy season is hardly affected by ENSO events. In contrast, the results revealed the shift in Kiremt season over Awash basin is evident due to the changes in the strength and position of synoptic systems that govern the Kiremt and Belg seasons during ENSO events. In order to examine the overall impact of ENSO on regional rains, all Awash sub basin station Kiremt rainy season averages were computed based on nine stations distributed over the region for the periods 1985-2007. Then the seasonal rainfall averages were standardized by computing the long term mean and standard deviation from 1985-2007. The standardized rainfall anomalies are then represented as time series as shown in Figure 2. Korecha and Barnston indicated that the threshold values for the categorization of the Kiremt season as deficient and excessive rains for Ethiopia during JJAS rainy seasons. As it has been depicted in Figure 2, the rainfall deficient occurred in, 1987, 1989, 1997 and 2002. Excessive wet conditions occurred in, 1994 and 1998. In fact, most of these years are coincided with El Nino episodes while excessive rains matched quite well with La Nina events. The impact of La Nina events appears stronger than those of El Nino cases for instance, only same strong El Nino events (1987, 1997 and 2002), with moderate El Nino events in 1986, 1990 which falls by one standard deviation of all Awash sub basin station rainfall during Kiremt season and result into poor Awash sub basin and Kiremt season rainfall. On the other hand, the strong La Nina events that occurred in 1988 produced wet season during Kiremt to over Awash sub basin station. However, the excessive rainfall amount that recorded in 1985 was so exceptional that might be influenced by local factors than global systems as shown in Figure 2. The low Kiremt seasonal rainfall totals, with relatively few rainy months (i.e. 1997) and prolonged dry spells within the month, the high Kiremt seasonal rainfall amount totals, with high rainy days (i.e. 1986) persistent wet spells caused the rainfall and stream flow fluctuations over Awash sub basin during the two ENSO extreme conditions. These abnormal conditions would affect decisions about the use of hydroelectric generation capacity by fluctuating inflow (Qin) of water into hydropower networking systems of Koka hydropower.
Inter-annual fluctuation of stream flow over Awash sub basin in relation to Southern Oscillation Index (SOI)
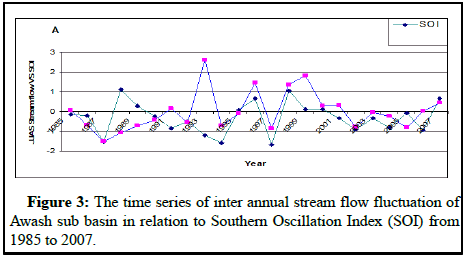
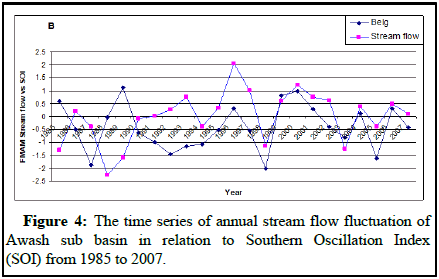
The series of seasonal stream flow fluctuation over the Awash sub basin revealed inter annual fluctuations that more or less resembled with the patterns of Southern Oscillation Index (SOI) as shown in Figure 3. This analysis showed that there was a similar in phase between Awash sub basin stream flow fluctuation and SOI during kiremt. However, the that depicted in Figure 3 showed that the stream flow fluctuation of Awash sub basin, were more or less coherent with SOI pattern sin1, 1989, 1992, 1994, 2000 and 2006 (exceptional years) (Figure 4). Here, in the figure SOI and the stream flow fluctuation of lake Awash sub basin was averaged value for June, July, August and September. The analysis was based on the correlation between the stream flow and SOI with Kiremt seasons in order to see the coherence relation between them and in the figure below the stream flow fluctuation value is represented in solid blue line and SOI is represented solid green line.
Inter annual fluctuation of stream flow over Awash sub basin in relation to Nino 3.4 sea surface temperature anomalies
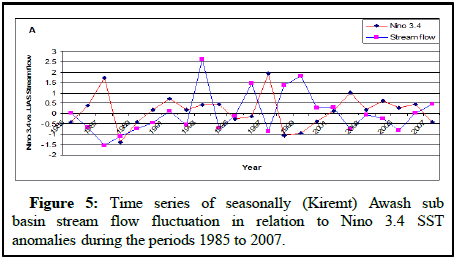
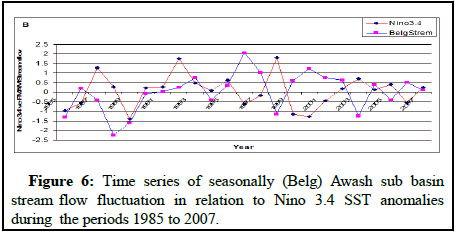
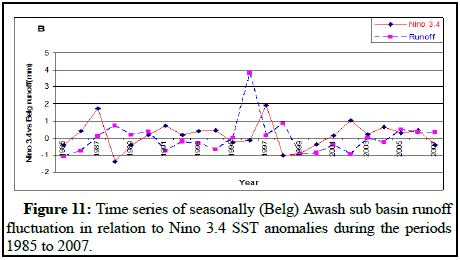
As shown in Figure 5 the kiremt stream flow of Awash sub basin fluctuated because of Nino 3.4 regions that found over equatorial Pacific ocean. The annual stream flow fluctuation of Awash sub basin has shown strong inverse inter annual fluctuation, without visually apparent except in 1996, 2002 and 2004, however in Belg it reveals similar relation with Nino 3.4. Similar patterns have depicted in the case of Nino 3.4, except in 1997, 1999, 2000, 2001, 2004, 2006 and 2007 also reveals inverse relation with Nino 3.4. However the inter annual fluctuation of Awash basin the stream flow shows high fluctuation in relation to 3.4 regions as shown in the Figures 5 and 6. Stream flow fluctuation is represented by blue solid line; with Nino 3.4 SST anomalies are represented by solid relines. Nino 3.4 SST anomalies values are the average of June, July, August and September months.
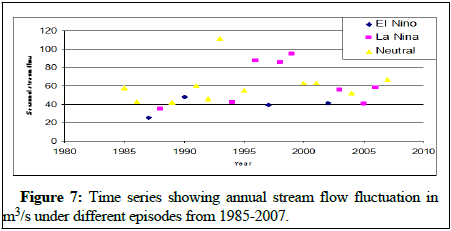
Nevertheless, the stream flow storage of Awash reservoir is getting high during La. Nina and neutral years than in El Nino years as depicted in Figure 7. In contrast to this during the El Nino years the stream flow storage of lake Tana reservoir is getting more or less low as compared with the two episodic years. However, hydroelectric management body should overcame this problem by storing lower water during the wet season (La Nina) and higher increasing the inflow (Qin) into hydropower networking systems use of water might be the appropriate solution. Similarly during El Nino year also high amount of water should store and less amount of water.
Inter annual fluctuation of runoff over Awash sub basin in relation to Southern Oscillation Index (SOI)
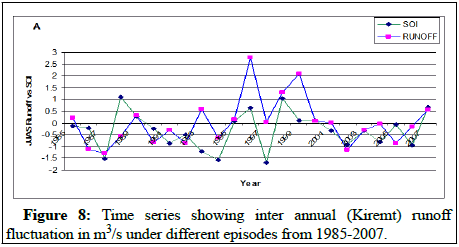
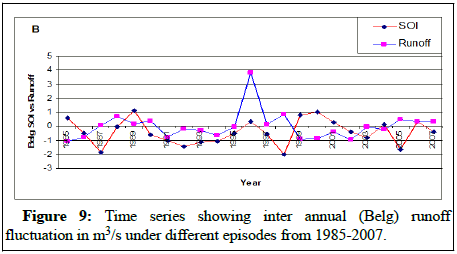
The series of seasonal runoff fluctuation over the Awash sub basin revealed inter annual fluctuations that more or less resembled with the patterns of Southern Oscillation Index (SOI) as shown in Figure 8. This analysis showed that there was a similarity in phase between Awash sub basin runoff fluctuation and SOI in kiremt season where as opposite in Belg season. However, the analysis that depicted the kiremt runoff in Figure 9 showed that the runoff fluctuation of Awash sub basin, were weakly coherent with SOI pattern show, 1986, 1991, 2004 and 2007 (exceptional years). Here, in the figure SOI and the runoff fluctuation of lake Awash sub basin was averaged value for June, July, August and September. The analysis was based on the correlation between the runoff and SOI with Kiremt seasons in order to see the coherence relation between them and in the figure bellow the runoff fluctuation value is represented in solid blue line and SOI is represented solid green line.
Inter annual fluctuation of runoff over Awash sub basin in relation to Nino 3.4 sea surface temperature anomalies
It is showing in the Figures 10-12.
Generally as shown in figure below in around Awash basin it get higher rain fall in kiremt due to La Nina effect whereas in Belg season relatively lower than that of kiremt season due to effect of El Nino.
Correlation and regression for prediction of Awash basin rain fall, stream flow and Runoff fluctuation during inter seasonally by using El Nino/Southern Oscillation (ENSO)
Statistical models that are used to predict the rainfall, stream flow and runoff fluctuation of Awash sub basin is developed by employing global climatic data as input. Three stages are applied in the development of seasonal rain fall, stream flow and runoff prediction model. These includes; selection of predictors, formulation of a statistical model and evaluation of the performance of the model. As elaborated in the earlier topics, the rainfall, stream flow, runoff, fluctuation of awash sub basin shows relatively strong association El Nino/Southern Oscillation (ENSO). This relatively strong association occurs as integrated consequence of global atmospheric and oceanic processes. This topic thus deals with the prediction of Awash rainfall, stream flow, runoff fluctuation during Kiremt season, the type of techniques used and their predictive scale including, the lag time relationship between ENSO and Kiremt seasonal rain fall, stream flow, run off fluctuation. The low seasonal rainfall totals lead into drought and lowering the rain fall, stream flow and run off enter into the reservoir of awash sub basin. The prediction mechanism enables the assimilation and dissemination of information throughout Awash sub basin (koka) hydroelectric management body in order to mitigate the power fluctuation as result of excessive or deficiency of rainfall, which responsible to the variation of stream flow over the Awash sub basin.
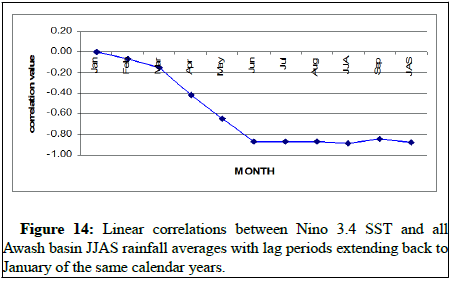
The prediction of Awash sub basin rainfall, stream flow and runoff is moderately possible based on ENSO pattern and semi-permanent and seasonal oscillatory circulation system. In this regard, ENSO patterns are expressed in terms of historical SSTs recorded at Nino regions and the southern oscillation index as shown in Figure 13. For the sake of simplicity, the SST recorded in Nino 3.4 index region is selected to represent the ENSO conditions because of the stability and it demonstrates relevance to the ENSO phenomena. Statistical manipulations revealed that the linear correlation between the ENSO states in the pre summer month (Belg) and Kiremt season rainfall, stream flow and runoff average changes as the time of ENSO approaches the beginning of the rainfall season. Moreover, the strength of the correlation between Kiremt season stream flow and Nino 3.4 SSTs and SOI of pre-season seemed to be relatively significant.
Therefore, this implies that using April and May Nino 3.4 and April and May SOI states can be used to predict the rainfall, stream flow and run off fluctuation of Awash sub basin with modest skills (Table 2).
| Nino indices | Correlation value with Awash JJASRF | Corr. values with Awash stream flow | Corr. values with Awash JJAS runoff |
|---|---|---|---|
| Nino 3.4 Feb | -0.06 | -0.1 | -0.2 |
| Nino 3.4 Mar | -0.15 | -0.1 | -0.3 |
| Nino 3.4 Apr | -0.42 | 0.0 | -0.3 |
| Nino 3.4 May | -0.65 | 0.0 | -0.2 |
| Nino 3.4 Jun | -0.87 | -0.2 | -0.4 |
| Nino 3.4 Jul | -0.87 | -0.3 | -0.4 |
| Nino 3.4 Aug | -0.88 | -0.4 | -0.4 |
| Nino 3.4 Sep | -0.84 | -0.4 | -0.4 |
| Nino 3 Feb | 0.10 | 0.03 | -0.11 |
| Nino 3 Mar | -0.01 | 0.07 | -0.12 |
| Nino 3 Apr | -0.21 | 0.08 | -0.24 |
| Nino 3 May | -0.53 | 0.04 | -0.22 |
| Nino 3 Jun | -0.81 | -0.2 | -0.34 |
| Nino 3 Jul | -0.72 | -0.24 | -0.27 |
| Nino 3 Aug | -0.73 | -0.33 | -0.31 |
| Nino 3 Sep | -0.75 | -0.38 | -0.37 |
| SOI Feb | -0.17 | 0.06 | 0.25 |
| SOI Mar | 0.25 | 0.10 | 0.27 |
| SOI Apr | 0.41 | 0.12 | 0.33 |
| SOI May | 0.60 | 0.16 | 0.29 |
| SOI Jun | 0.72 | 0.24 | 0.40 |
| SOI Jul | 0.84 | 0.22 | 0.41 |
| SOI Aug | 0.87 | 0.26 | 0.42 |
| SOI Sep | 0.91 | 0.15 | 0.32 |
Table 2: Simple linear correlation coefficient (r) as computed based on Awash basin.
Seasonal rain fall stream flow runoff average and global ocean indices from 1966-2009. The strength of linear relationship between all Awash basin JJAS rainfall and Nino 3.4 indexes or the three months average (JAS) for individual month running from January to September were shown in Figure 14.
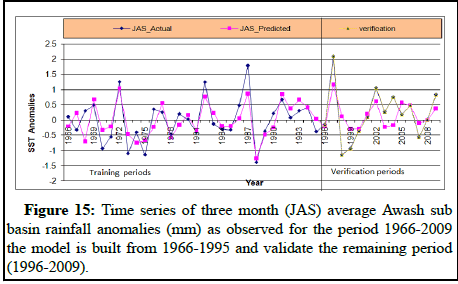
Now we attempt to develop Multiple Linear Regression (MLR) models to predict rain fall the stream flow and runoff fluctuation of Awash basin during Kiremt season. The models are developed based on historical record of SOI and Nino 3.4 SSTs as predictors. The models are first trained based on 1966-1995 and then validated for 1996-2009. A Stepwise regression technique is applied to select potential predictors for the model fitting. Finally, Multiple Linear Regression model (MLR) is developed by using 30 years rain fall stream flow and runoff data of Awash sub basin. The model relies on (1) April Nino 3.4 (2) May Nino 3.4 (3) April SOI and (4) May SOI to rainfall. (1) Feb Nino 3.4 (2) March Nino 3.4 (3) April SOI and (4) May SOI stream flow and (1) March Nino 3.4 (2) April Nino 3.4 (3) April SOI and (4) May SOI runoff these four predictors resulted in a multiple R-squared off in the model. The strength of relationship between the rainfall of Awash sub basin and predictors is statistically significant at 67.8% confidence level and well explained by ENSO and other potential factors. These four predictors resulted in multiple R-squared 0.631, 0.662, 0.552 for rainfall, stream flow and run of respectively in the model the strength of predictor with rainfall, stream flow and runoff Awash sub basin and predictors is significant 98% confident level (Table 3).
Awash basin JAS-SST=0.0-0.464 April-SST+0.904 May-SST+0.042 April-SOI-0.333 May-SOI multiple R2=0.631, adjusted R2=0572.
| Source | Sum of squares | df | Mean square | F-ratio | P |
|---|---|---|---|---|---|
| Regression | 9.219 | 4 | 2.305 | 10.671 | 0.000 |
| Residual | 5.400 | 25 | 0.216 |
Table 3: The Analysis of Variance (ANOVA) as generating using SYSTAT develop rainfall prediction over awash basin.
MLR model validations and verification
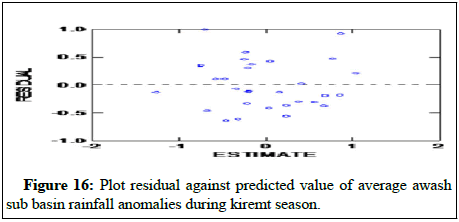
As shown in the above Table 3 P value and F ratio developed MLR model is predictor and predict and the value P increase the model become insignificant and as the value F ratio increase the regression relationship in the model is more statically significant whereas the value of adjusted R2=0.572 is determine the degree of freedom in the model (Figures 15 and 16).
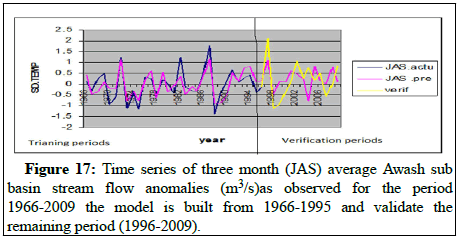
Awash basin stream flow=-0.068-1.343 Feb-SST+1.628 March-SST+0.031 Apr-SOI- 0.483 May-SOI multiple R2=0.663, adjusted R=0.603 (Table 4).
| Source | Sum of squares | df | Mean square | F-ratio | P |
|---|---|---|---|---|---|
| Regression | 9.684 | 4 | 2.421 | 12.264 | 0 |
| Residual | 4.935 | 25 | 0.197 |
Table 4: The ANOVA as generating using SYSTAT develop stream flow prediction.
As shown in the above Table 4 P value and F ratio developed MLR model is predictor and predict and the value P increase the model become insignificant and as the value F ratio increase the regression relationship in the model is more statically significant whereas the value of adjusted R2=0.603 IS determine the degree of freedom in the model (Figures 17 and 18).
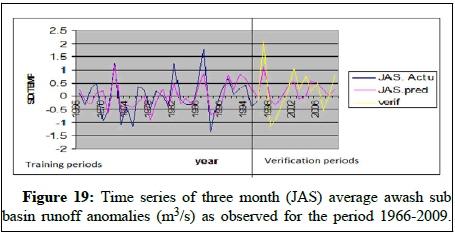
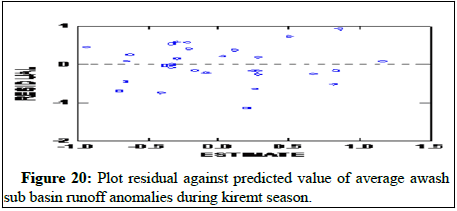
Awash basin runoff=-0.007-0.701 March-SST+0.858 April-SST-0.131 April-SOI-0.346 May-SOI. Multiple R2=0.552, Adjusted R2=0.481 (Table 5).
| Source | Sum of squares | df | Mean square | F-ratio | P |
|---|---|---|---|---|---|
| Regression | 9.684 | 4 | 2.421 | 12.264 | 0.000 |
| Residual | 4.935 | 25 | 0.197 |
Table 5: The ANOVA as generating using SYSTAT develops runoff prediction.
As shown in the above Table 5 P value and F ratio developed MLR model is predictor and predicted the value P increase the model become insignificant and as the value F ratio increase the regression relationship in the model is more statically significant whereas the value of adjusted R2=0.481 is determine the degree of freedom in the model (Figures 19 and 20).
The overall results revealed that from the above developed (MLR) model the awash sub basin rainfall, stream flow and runoff are associated with global oceanic indices recorded on Pacific Ocean. So the developed (MLR) model over predicts the awash sub basin rainfall, stream flow and runoff during kiremt season (JAS) have better relation to global indices.
Conclusion
The aim of this paper was to investigate the impact of ENSO on climate variability and extremes on Awash river surface water storage irrigations under this catchment’s. This study also attempted to determine the impact ENSO events, stream flow runoff fluctuation during Kiremt season. Using station level rainfall, global climatic data and their impacts on stream flow and runoff fluctuation were assessed for nine stations. The overall analyses are used to provide useful insight into the preparation of an early warning system over Koka dam hydropower projection sites. Time series analysis techniques were done by using SYSTAT to see the relationship exist between ENSO events and the response of stream flow and hydroelectric generation capacity of the networking system and cultivated area to ENSO. The results of this study showed that year to year fluctuation of the stream flow and surface water resource of Awash river determined by fluctuation of rainfall, mainly during Kiremt season because of ENSO events. Results from the analysis of the time series of annual stream flow fluctuation of Awash river in relation to Southern Oscillation Index (SOI) and the analysis the fluctuation of stream flow and runoff in relation to Nino 3.4 SST anomalies showed that the current levels of stream flow widely responding to both SOI and Nino values of eastern equatorial pacific Sea Surface Temperature Anomalies (SSTA). The studies made on the relationship between short term climatic variations, stream flow fluctuation and runoff as well as their impact on hydroelectric generation capacity of Awash river hydropower has not yet well assessed. Such studies could be used for predicting stream flow and runoff fluctuation and its impact on hydroelectric generation capacity during the two seasons. In order to complete the knowledge gap, we also employed statistical techniques that might qualify and consistent to the actual data. Over Awash river, the stream flow and runoff as well as surface water resource are increased during La Nina and neutral years than in El Nino years. For instance, the high rainfall amount occurring in kiremt due to La Nina impact are highly increases stream flow and runoff to Awash river and this condition increases water inside the reservoir in turn increase the overall electric power generation capacity of Awash river. Generally, stream flow and runoff fluctuation showed that similar phase with SOI and inverse phase with Nino values of eastern equatorial pacific Sea Surface Temperature Anomalies (SSTA). Once the associations between global climatic variables from eastern equatorial pacific 34 and stream flow fluctuation performance, reveals appropriate linear models were developed and tested whether they can fulfill the statistical significant test. Then the developed models were employed to predict the stream flow and runoff fluctuation and its impact on water inflow (Qin). Moreover, these models used to monitor the stream flow fluctuation of Awash river during the pre-season. The stream flow and runoff fluctuation could also be monitored based on the skill of developed models so that the hydroelectric generation capacity can be estimated before the onset of Kiremt season.
Recommendations
As stated above, we identified some climatic factors as precursor indicators for the stream flow and runoff fluctuation over Awash river. Nevertheless, further study should be undertaken by considering the effect of sedimentation, by calculating ground water balance and other unidentified factors in order to evaluate the performance of water storage capacity of Awash river dam. ENSO events are found to affect the local rainfall and stream flow patterns, which in turn create electric power fluctuation over Awash river. Thus, ENSO related information and associated implications to stream flow and rainfall variation to be given for the hydrologist, hydroelectric management body and agricultural communities so that early planning can be undertaken in advance. Such information in deed can provide policymakers with useful information to guide electric power disseminators in order to rearrange their total power and patterns of disseminating the electric to the communities. In view of the above, it is clear that improved forecasts of precipitation would affect decisions about the use of hydroelectric generation capacity. Besides, during La Nina episodes high surface water resource, runoff and stream flow are observed and the converse is true during El Nino years over Awash river were witnessed. Therefore, the hydrologist, and hydroelectric management body should use and disseminate the following adaptation option during the two episodic (El Nino and La Nana) years.
• If an upcoming wet season is reliably predicted to be wetter (La
Nina phase) than normal somewhat lower water reserves might be
carried into the wet season and somewhat higher water use might be
appropriate in the early weeks of a wet season.
• If an upcoming dry season is reliably predicted to be drier (El Nino
phase) than normal somewhat higher water reserves might be
carried into the dry season and somewhat lower water use might be
appropriate through the dry season.
In this study, it has been shown that ENSO events have strong associations with stream flow fluctuation. Thus, there should be government support in the direction of power failure insurance and the appropriate use of power and recognition of other source of power systems to the communities that may reduce vulnerability of energy system from climate variability and weather extremes. Finally, there is a need to design and expand multi sectoral researches particularly focusing on microclimates, climate changes and stream flow that are responsible for year to year rainfall variation, which in turn creates shortage in surface water resource this leads into hydroelectric power generation and soil moisture deficit problem in agriculture in Ethiopia.
Limitations
This study deals mainly with climate variability in developing countries where the available information is not adequate to address some of the issues. One of the major concerns in looking into the relationship between climate variability and stream flow of Awash river might be due to other factors rather than climate variability. These factors might be the availability infrastructure, strength of the reservoir and geological nature of the area. It is believed that except climate variability, most of the above factors can be or manipulated by Engineers or government in the short or long term. Thus, it is difficult to incorporate these factors in the model, because these parameters are not available quantitatively.
References
- Getahun YS, Li MH, Chen YY, Yate TA (2023) Drought characterization and severity analysis using GRACE-TWS and MODIS datasets: A case study from the Awash River Basin (ARB), Ethiopia. J Water Clim Change 14: 516-542.
- Adane GB, Hirpa BA, Lim CH, Lee WK (2020) Spatial and temporal analysis of dry and wet spells in upper Awash river basin, Ethiopia. Water 12: 3051.
- Tessema N, Kebede A, Yadeta D (2021) Modelling the effects of climate change on stream flow using climate and hydrological models: The case of the Kesem sub basin of the Awash river basin, Ethiopia. Int J River Basin Manag 19: 469-480.
- Adane GB, Hirpa BA, Song C, Lee WK (2020) Rainfall characterization and trend analysis of wet spell length across varied landscapes of the upper Awash river basin, Ethiopia. Sustainability 12: 9221.
- Tareke KA, Awoke AG (2022) Comparing surface water supply index and stream flow drought index for hydrological drought analysis in Ethiopia. Heliyon 8: e12000.
[Crossref] [Google Scholar] [PubMed]
- Emiru NC, Recha JW, Thompson JR, Belay A, Aynekulu E, et al. (2022) Impact of climate change on the hydrology of the upper Awash river basin, Ethiopia. Hydrol 9: 3.
- Sahoo S, Dhar A, Debsarkar A, Pradhan B, Alamri AM (2020) Future water use planning by water evaluation and planning system model. Water Resour Manag 34: 4649-4664.
- Murendo C, Keil A, Zeller M (2011) Drought impacts and related risk management by smallholder farmers in developing countries: Evidence from Awash river basin, Ethiopia. Risk Manag 13: 247-263.
Citation: Tufa ZD, Goshel CC (2023) Evaluation of ENSO Impact on Surface Water Storage of Awash River Basin in Ethiopia. J Earth Sci Clim Change 14: 683.
Copyright: © 2023 Tufa ZD, et al. This is an open-access article distributed under the terms of the Creative Commons Attribution License, which permits unrestricted use, distribution and reproduction in any medium, provided the original author and source are credited.
Select your language of interest to view the total content in your interested language
Share This Article
Recommended Journals
Open Access Journals
Article Usage
- Total views: 1485
- [From(publication date): 0-2023 - Jul 15, 2025]
- Breakdown by view type
- HTML page views: 1162
- PDF downloads: 323

