Research Article Open Access
Evaluation of Climate Change Impacts on Run-Off in the Gidabo River Basin: Southern Ethiopia
Amba Shalishe Shanka*Meteorology and Hydrology Department, Arba Minch University, Ethiopia
- Corresponding Author:
- Amba Shalishe Shanka
Meteorology and Hydrology Department
Arba Minch University, Ethiopia
Tel: +251-916-186-582
E-mail: Amba.shalishe@amu.edu.et
Received date: May 18, 2017; Accepted date: June 13, 2017; Published date: June 20, 2017
Citation: Shanka AS (2017) Evaluation of Climate Change Impacts on Run-Off in the Gidabo River Basin: Southern Ethiopia. Environ Pollut Climate Change 1:129.
Copyright: © 2017 Shanka AS. This is an open-access article distributed under the terms of the Creative Commons Attribution License, which permits unrestricted use, distribution, and reproduction in any medium, provided the original author and source are credited.
Visit for more related articles at Environment Pollution and Climate Change
Abstract
Climate change meaningfully affects the runoff, flooding and the riverfow in Gidabo river basin. Thus, this research study deals with the climate change impacts on the runoff in the Gidabo River basin. Statistical Downscaling Model version 5.1 has been used to downscale the daily precipitation and temperature in the Gelana river basin. The output of HadCM3 coupled atmosphere-ocean GCM model for A2a and B2a scenarios obtained from the Hadley Centre Coupled Model version 3 were used to show future climate change. Climate change scenarios for precipitation and temperature were developed for three future periods: 2011–2040 (2050s), 2041–2070 (2050s) and 2071–2099 (2080s). The meteorological variables were used as input to the SWAT hydrological model which was calibrated (R2=0.77) and validated (R2=0.81) with meteorological and hydrological historical data from the year 1980-2006. The results obtained from this study indicate that there is significant variation in the monthly, seasonal and annual runoff. The climate change impacts might causes increases in average monthly runoff in the 2020’s, 2050’s and 2080’s for both A2a and B2a scenario. The result of this study is based on a single climate model (HadCM3) output under A2a and B2a scenarios. Therefore, multiple climate models and scenario which may provide a detail climate change impact studies for comparison on hydrology in the Gidabo river basin.
Keywords
Climate change impacts; Statistical downscaling; Arc SWAT run-off
Introduction
The effect of climate change is a major issue in the Environmental and social discussion on both global and regional scale [1]. The impacts of runoff due to changes in precipitation, Evapo-transpiration and temperature, is an important factor in environmental, agricultural and economical applications [2].Therefore, good estimation of future runoff is an important input to the discussion of the impacts of climate change.
Modeling the effect of climate change on river runoff is usually achieved either by direct use of climate model data in hydrological models or by changing existing climate data series with expected changes.
Accepting the climate change impact on the hydrologic cycle is one of the major challenges in the context of water resources management [3]. GCMs have become a main tool in present the climate change impact studies in environmental and water resources and are coupled with atmospheric, oceanic, land surface and sea ice models [3]. The use of GCM’s in hydrologic models is a reasonable approach to assess possible future hydrologic changes in the basin [4]. However, there have been some limitations due to coarse spatial resolution of GCMs particularly estimating the hydrological runoff in the watershed scale. Many studies conducted downscaling methods to make a link between GCMs output and hydrologic models at watershed level [5].
The Intergovernmental Panel on Climate Change [6] stated that it is evident by now that recent climate changes have had serious impacts on the river runoff in many regions of the world. Precipitation is considered as an essential parameter in climate change through the studies and forecasting runoff trend might affect the developmental plan for an area due to changing energy demand and water consumption in different sectors [7]. Runoff forecasting is one of the significant components in hydrological models, which play an important role in water resources management [7]. SRES include six scenario groups like A1B, A2, B1, B2, A1T and A1F1 [8] However, SRES A2 and B2 scenario are widely used in climate change studies. These scenarios cover a range of approximately 60% of the full span of emission scenarios [8]. The A2 scenario family describes a heterogeneous world characterized as slow economic growth and rapid population growth rate as compared to A1 scenario. The B2 scenario family describes a world in which the emphasis is on local solutions to economic, social and environmental sustainability. Population increases at a lower rate than A2 but at a higher rate than A1 and B1. This scenario is oriented towards environmental protection and social equity [8].
Downscaling techniques have developed as useful tools to reduce the problem of disagreeing scales between coupled models. Therefore the objective of this study is to evaluate climate change impacts on runoff in Gidabo watershed for the future time, using SDSM and rainfall-runoff hydrological model SWAT [8].
Materials and Method
The Gidabo Basin is found in the Abaya-Chamo sub-basin of the Rift Valley Basin in Ethiopia. It is originated in the southern Main Ethiopian Rift valley System, Northeast of Lake Abaya in Southern Nations Nationalities and People’s Regional State (SNNPRS). More specifically, the Basin lies in Sidama and Gedeo Zones of the SNNPRS and the Borena Zone of Oromiya Regional State [9].
The Gidabo basin is bordered by the catchment of Lake Hawassa to the North, River Bilate to the West, River Gelana to the South and Genale-Dawa Rivers to the East. The absolute geographical location of the area is between 6.09° and 6.60° N latitude and 38.0° and 38.38° E longitudes with an area and perimeter of 3342.37 km2 and 305.25 km2, respectively [9] (Figure 1).

Figure 1: Location map of study area.
Research design, data collection and analysis
Data collection, homogeneity test, consistence test, bias correction, and data preparation for model input have been performed. The metrological data were collected from the Ethiopian National Meteorology Agency and hydrological data were collected from ministry of water irrigation energy and electricity of Ethiopia. Next to this, model run and calibration was done until it gives the best possible correspondence between observed and simulated run-off. And then model validation was examined. Finally, climate change impact on runoff in Gidabo river basin has been evaluated.
Homogeneity test
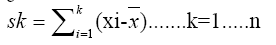
Non homogeneous data series for climate change impact assessment may amplify real climate variations. The collected data said to be homogenous, if the measurements have been consistently done by the same method, with the same instrumentation, at the same time and place, and in the same environment. The homogeneity test was evaluated using RAINBOW software for this study by means of frequency analysis. Since it one of the methods designed to study the homogeneity of hydro-meteorological datasets. The restriction of homogeneity assures that the observations are from the same population. One of the tests of homogeneity is based on the cumulative deviations from the mean using:
 (1)
(1)
Where; Xi is time series data records from x1, x2, x3; and X mean of the data. The initial value of S (k=0) and last value S (k=n) are equal to zero. For a homogenous record one may expect that the SK‟s fluctuate around zero since there is no systematic pattern in the deviations of the “s from their mean value. If the cumulative deviation crosses one of the horizontal lines the homogeneity of the data set is rejected with respectively 90,95 and 99% probability. The probabilities of rejecting the homogeneity of the datasets were evaluated for this study in the Homogeneity statistics menu.
Consistency test: Consistency of time series data analyzed based on theory that a plot of two cumulative quantities that are measured for the same time period should be straight line and their proportionality remain unchanged which is represented by the slope. To check the consistency of data, double mass curve was used to correct rain gauge data for the station.
Bias correction: Bias correction compensates for any tendency to over or under estimates the mean of the conditional process by the downscaling model. This parameter is set to 1 (default value) for maximum and minimum temperature since the process is nonconditional whereas for precipitation this parameter can be adjusted in order to match the mean of the conditional process and is set to 0.8.
Data preparation for model input
SWAT model requires observed daily input data of rainfall, air temperature, relative humidity, wind speed, sunshine hour, stream flow (for calibration) and catchment characteristics of the study area. The average areal rainfall was estimated by multiplying the rainfall amount of each station with its area of polygon and the sum of these products was divided by the total area of the basin (i.e., Thiessen polygon involves by assigning relative weights to the rainfall stations to compute the areal depth of rainfall over the basin).
The soil and water assessment tool hydrological model
For this study SWAT hydrological model was used. The Soil and Water Assessment Tool is a physically based semi-distributed geospatial hydrologic model. It operates as an extension within ArcGIS 10 and therefore it requires data in GIS formats. The model uses remote sensed and ground observation data (soil, land cover, rainfall and evaporation) and digital elevation data sets describing the land surface to calculate the basin hydrologic water cycle. It provides a continuous simulation of stream flow, on a daily time step. The model consists of two parts: a GIS-based component used for model data input and preparation and the rainfall-runoff processing component.
SWAT (soil and water assessment tools) simulates precipitation run-off and routing processes, both natural and controlled. This study currently focused on application of watershed model (SWAT) for Gidabo catchments to establish rainfall-runoff modeling for the determination of important hydrologic parameter runoff volume in order to use them for climate change impact quantification and for further water resource development works. It is designed to be applicable in a wide range of geographic areas for solving the widest possible range of problems. This includes large river basin water supply and flood hydrology and small urban or natural watershed runoff but all these are not included in this thesis.
Hydrologic response units
The Hydrologic Response Units (HRU) has been defined in Arc SWAT by overlaying soils, land use and slope classes. These overlay land use classes, soil units and slope classes in a sub-catchment were taken into account, which were larger than the respective threshold value. Threshold values of 20% for land use, 20% for soils and 10% for slope classes resulted in 217 HRU for the whole Gidabo catchment.
Surface runoff occurs, whenever the rate of water application to the ground surface exceeds the rate of infiltration, i.e., it is the excess water that cannot anymore infiltrate into the ground. Because of this process, the correct estimation of the infiltration is crucial for the subsequent evaluation of the surface runoff. SWAT provides two infiltration methods for estimating the surface runoff volume component from HRUs, namely, the SCS-curve number (CN) and the Green and Ampt infiltration method. While the CN-method uses daily rainfall rates, the Green & Ampt technique requires smaller time-steps to properly simulate the infiltration process. In the present study, SCS-curve number method was used to estimate runoff.
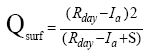
Here the surface runoff is modeled in SWAT using the SCS curve number method, i.e.,
 (2)
(2)
Where: Qsurf, accumulated runoff or rainfall excess (mm H20), Rday, rainfall depth for the day (mm H20), Ia, initial abstractions which includes surface storage, interception and infiltration, prior to runoff (mm H20) and which is usually taken as equal to 0.2S, with S, retention parameter (mm H20)
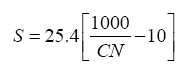
The retention parameter S is defined by:
 (3)
(3)
Where; CN is the SCS-curve number, which ranges from 0 to 100.
SWAT model calibration, validation and performance evaluation
Next to simulation; SWAT model calibration is followed for this study. The SWAT model calibration is a set of parameters adjustment to provide the best possible correspondence between recorded and simulated flow from a catchment. In the calibration procedure, parameter values are adjusted by changing one or two parameters at a time within the allowable ranges in the present study (i.e., by error and try). Curve number parameter, soil parameter, and slope parameters are used for calibration in SWAT model. The model performance should be evaluated before it receives any application. In this study the model performance was evaluate through visual inspection of the simulated and observed hydrographs and through a set of objective functions that measure the goodness-of-fit between simulated and observed hydrograph.
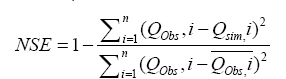
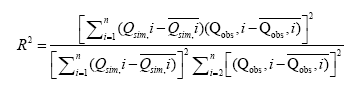
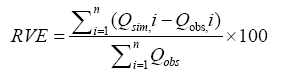
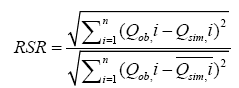
For this study, model simulation has been evaluated using efficiency criteria such as Nash and Sutcliffe simulation efficiency (NSE), coefficient of determination (R2), Relative Volumetric Error (RVE). In general; NSE and R2 are used to evaluate the model ability to reproduce the pattern of the observed hydrograph. The RVE function is used to quantify the volumetric error of the simulated stream flow.
The Nash-Sutcliffe coefficient of efficiency (NSE), Relative Volumetric Error (RVE), coefficient of determination R2 and Root mean square error observation standard deviation ratio (RSR) are estimated by:
 (4)
(4)
 (5)
(5)
 (6)
(6)
 (7)
(7)
Results and Discussion
Sensitivity analysis
The sensitivity analysis has been performed for 27 parameters that may have a potential to influence Gidabo river flow (Table 1). Even if 27 parameters were considered for the sensitivity analysis, only 6 of them are effective for flow simulation analysis. As shown in Table 1, the first six parameters showed a moderately advanced sensitivity, the curve number parameter being the most sensitive of all. The six most sensitive parameters controlling the surface runoff in the watershed are curve number (CN2), the soil evaporation compensation factor (ESCO), Soil depth (SOL_Z), the threshold water depth in the shallow aquifer for flow (GWQMN), the soil available water capacity (SOL_AWC) and Average slope steepness (SLOPE).The ranges of variation of these parameters are based on a listing provided in the SWAT2009 manual [10] and are sampled by considering a uniform distribution.
| Rank | Name | Description | Min | Max | Relative Sensitivity | Category of Sensitivity |
|---|---|---|---|---|---|---|
| 1 | CN2 | SCS runoff CN for moisture condition II | 35 | 98 | 64 | Very high |
| 2 | ESCO | Soil evaporation compensation factor | 0 | 1 | 0.4 | High |
| 3 | SOL_Z | Soil depth | 0 | 3000 | 1500 | High |
| 4 | GWQMN | Threshold depth of water in the shallow aquifer required for return flow to occur (mm) | 0 | 5000 | 300 | High |
| 5 | SOL_AWC | Available water capacity of the soil layer (mm/mm soil) | 0 | 1 | 0.8 | High |
| 6 | SLOPE | Average slope steepness (m/m) | 0.00001 | 0.6 | 0.5 | High |
Table 1: Parameters and parameter ranges used in sensitivity analysis using SWAT model.
Calibration and validation of SWAT model
The SWAT model has been calibrated and validated using measured stream flow data which is collected from stream gauging station located on the Gidabo River at Aposto. The coefficient of determination (R2) and Nash-Sutcliffe simulation efficiency (NSE) were used to evaluate the model performance for both calibration and validation time periods. Calibration was performed for five years period from 1999 to 2003. The R2 value indicates the strength of relationship between the observed and simulated values. The NSE value indicates how appropriate the plot of the observed versus the simulated values fitted [11]. If the R2 and NS E values are less than or very close to 0, the model prediction is considered unacceptable. If the value approaches to 1, the model predictions are considered perfect [11].
The calibration results below in Figure 2 show that there is a good agreement between the simulated and observed monthly flows at the out let of the watershed. This is verified by the correlation coefficient of R2=0.77 and the Nash-Sutcliffe simulation efficiency (NSE)=0.6 during calibration period. The results fulfilled the requirements suggested by Santhi et al. [11] for R2>0.6 and NSE>0.5. The value indicates good model performance in terms of capturing the observed stream flow volume (RVE=6.58%), relatively better agreement in between observed and simulated daily discharge (RSR=0.11).

Figure 2: Monthly observed vs. simulated discharge hydrograph of Gidabo River basin during calibration period (1999-2003).
As exemplary hydrographic, observed vs. simulated discharge at Gidabo gauging station are the model underestimates the peaks in most years of calibration period, in which the peak is nearly captured. The main reason for the underestimation of the peak may be due to many missed measured rainfall data used in calibration period (Figure 2).
Validation proves the performance of the model for simulated flows in periods different from the calibration periods, but without any further modification in the calibrated parameters [12]. Thus, validation was performed for three years period from 2004 to 2006. When analyzing the performance on a monthly time scale, the verification period shows that the model performed well. The correlation coefficient R2=0.81 and the Nash-Sutcliffe simulation efficiency (NSE=0.65) displays good agreement with observed and simulated values. Both values satisfied the requirement of R²>0.6 and NSE>0.5, which is commended by Santhi et al. [11]. And also Percentage error in total runoff volume( RVE) and Root mean square error observation standard deviation ratio (RSR) value indicates good model performance in terms of capturing the observed stream flow volume (RVE=5.78%) and discharge (RSR=0.41) relatively better agreement in between observed and simulated respectively.
The model over estimated some stream flow events during validation period, the high intensity, short duration rainfall events and rainfall variability over the precipitation gauging station might have caused the over estimation of the stream flow events.
In general most of stream flow events are well represented by the calibrated model. This may indicate that the spatial distribution of precipitation with in the watershed is accurately represented by the available rain gauge as model input (Figure 3).

Figure 3: Monthly observed vs. simulated discharge hydrograph of Gidabo River basin during validation period (2004-2006).
Therefore, the objective functions used to evaluate SWAT model performance result as presented above during both calibration and validation periods for this study show that well and within acceptable range to simulate the basin runoff for future projections in general.
Impact of climate change on run-off under future scenarios
The impacts of climate change was analyzed taking the 1980-2006 flow as the baseline flow compared with the future flows for the 2020s, 2050s and 2080s. Precipitation, minimum and maximum temperature were the climate change drivers considered for the impact assessment.
In the 2020s, 2050s and 2080s for the A2a and B2a scenarios shown in Figures 4 and 5, the run-off indicated a decreasing trend for the Months January, May, October, November and December; and increasing trend for the month February, March, April, Jun, July, August and September.

Figure 4: Percentage change in monthly run-off in respect to base line period for the Hadcm3 A2a scenario.

Figure 5: Percentage change in monthly runoff in respect to base line period for the Hadcm3 B2a scenario.
In 2050s for both scenarios a decrease in runoff exhibited, this might shows a monthly increase up to 15.5% and 13.4% and monthly decrease up to 20.3% and 12% for HadCM3 A2a and HadCM3 B2a scenarios, respectively.
In 2080s increasing trend will expect for both the scenarios in all the months except January, may, October, November and December. In monthly basis the A2a scenario will expect to increase up to 17% and decrease up to 13.9%. However, in 2080s B2a scenario, the pattern of monthly runoff change may be increase up to 9.5% and decrease up to 6.5% (Figures 4 and 5).
Climate change impact on seasonal and annual run-off under future scenarios
For this specific study, seasonal analysis was taken for three seasons, which are ONDJ (October, November, December and January), FMAM (February, March, April and May) and JJAS (June, July, August and September). During ONDJ season total average seasonal runoff showed decrease in all horizons both HadCM3A2a and HadCM3B2a scenarios. Furthermore Percentage decrement will be high displaying 8.8% in 2020s, 8% in 2050s and 11.2 in 2080s for HadCM3A2a scenario and 9.3% in 2020s, 9% in 2050s and 3.0% in 2080s for HadCM3B2a scenario during ONDJ season. This finding is similar with the findings of Kassa [13] (Figures 6 and 7).

Figure 6: Percentage change of average total seasonal and annual runoff at the out let of the watershed for the Hadcm3 A2a scenario.

Figure 7: Percentage change of average total seasonal and annual flow pattern at the out let of the watershed for the Hadcm3 B2a scenario.
In 2020s, 2050s and 2080s, the total average annual runoff in Gidabo river basin is increasing of up to 3.4%, 2.9 and 6.8% for HadCM3A2a and 5.1 %, 5.6% and 5.8% for HadCM3B2a scenarios, respectively.
Generally, Future average seasonal and annual runoff showed that, run-off increases in all future time periods, except season of ONDJ as compare to the base period 1980-2000. High amount of increase in average seasonal runoff exhibited during summer season (JJAS) and high amount of decrease in magnitude Bega season (ONDJ).
Conclusion and Recommendation
Soil and Water Assessment Tool was successfully used to simulate, the impact of climate change on the Runoff of Gidabo river basin were assessed based on projected climate conditions by using GCM out puts of HadCM3 A2a and B2a emissions scenarios with Statistical Downscaling (SDSM) model. This is proved during calibration and validation period of the model performance criterion such as regression coefficient was used to evaluate the model.
Future annual run-off comparison showed that, runoff increases in magnitude in all future periods High amount of increase in average seasonal runoff exhibited during summer season (JJAS) and decrease in magnitude Bega season (ONDJ) in both scenarios.
The result of this study is based on a single climate model (HadCm3) output under A2a and B2a scenarios. Therefore, multiple climate models and scenarios which may provide a detail climate impact studies for comparison on hydrology in the Gidabo river basin is recommended.
Land use changes were considered to be unchanged throughout the simulation period for this study; such assumption may influence runoff projection in basin. In addition to this, uncertainty of climate change was not investigated in this study. Therefore, further studies have been recommended taking in to account the relationship between land use land cover change as well as uncertainty of climate change in the Gidabo river basin.
References
- Houghton (2001) Climate change 2001: The scientific basis contribution of working group I to the third assessment report of the intergovernmental panel on climate change. IPCC. Cambridge University Press, p: 83.
- Burke J, Faurès JM, Turral H (2011) Climate change, water and food security. Food and Agriculture Organization of the United Nations, Rome, Italy.
- Trenberth KE (1992) Conceptual framework for changes of extremes of the hydrological cycle with climate change. Clim Change 42: 327-339.
- Fu C (2011) Hydrological impacts of climate change in the Yellow River basin.
- Fowler HJ, Blenkinsop S, Tebaldi C (2007) Linking climate change modeling to impacts studies: Recent advances in downscaling techniques for hydrological modeling. Int J Climatol 27: 1547-1578.
- IPCC (2007) Fourth assessment report: Climate change 2007; climate change, impacts, adaptation and vulnerability. Summary for policy makers, Cambridge, UK.
- Bolle HJ, Menenti M, Rasool I (2008) Assessment of climate change for the Baltic Sea basin. Regional Climate Studies. Springer-Verlag, Berlin/Heidelberg.
- Nakicenovic (2000) IPCC special report on emission scenarios, Cambridge University Press, Cambridge, United Kingdom and New York, NY, USA.
- Birhanu (2009) Groundwater resource assessment in the Gidabo River catchment.
- Neitsch SL, Arnold JG, Kiniry JR, Williams JR (2005). Soil and water assessment tool theoretical documentation - version 2005. Grassland, Soil and Water Research Laboratory, Agricultural Research Service and Blackland Agricultural Research Station, Temple, Texas.
- Santhi C, Arnold JG, Williams JR, Dugas WA, Srinivasan R, et al. (2001) Validation of the SWAT model on a large river basin with point and non-point sources. J Am Water Resour Assoc 37: 1169-1188.
- Yacob MS (2009) Climate change impact assessment on soil water availability and crop yield in Anjeni watershed blue Nile basin, Arba Minch, Ethiopia.
- Kassa T (2014) Assessment of climate change impacts on water availability in Gidabo River basin, Ethiopia.
Relevant Topics
Recommended Journals
Article Tools
Article Usage
- Total views: 4308
- [From(publication date):
July-2017 - Apr 03, 2025] - Breakdown by view type
- HTML page views : 3171
- PDF downloads : 1137