Research Article Open Access
Evaluation of Bio-Layer Interferometric Biosensors for Label-Free Rapid Detection of Norovirus Using Virus Like Particles
Xiuli Dong1, Jessica J. Broglie1, Yongan Tang2 and Liju Yang1*
1Biomanufacturing Research Institute and Technology Enterprise (BRITE) and Department of Pharmaceutical Sciences, North Carolina Central University, Durham, NC 27707, USA
2Department of Mathematics and Physics, North Carolina Central University, Durham, NC 27707, USA
- Corresponding Author:
- Liju Yang
Biomanufacturing Research Institute and
Technology Enterprise (BRITE) and Department of Pharmaceutical
Sciences, North Carolina Central University, Durham, NC 27707, USA
Tel: 1-919-530-6704
E-mail: lyang@nccu.edu
Received date: June 28, 2016; Accepted date: July 12, 2016; Published date: July 20, 2016
Citation: Dong X, Broglie JJ, Tang Y, Yang L (2016) Evaluation of Bio-Layer Interferometric Biosensors for Label-Free Rapid Detection of Norovirus Using Virus like Particles. J Anal Bioanal Tech 7:329. doi:10.4172/2155-9872.1000329
Copyright: © 2016 Dong X, et al. This is an open-access article distributed under the terms of the Creative Commons Attribution License, which permits unrestricted use, distribution, and reproduction in any medium, provided the original author and source are credited.
Visit for more related articles at Journal of Analytical & Bioanalytical Techniques
Abstract
This study evaluated the label-free bio-layer interferometric (BLI) biosensor for the detection of norovirus (NoV) using two types of virus like particles (VLPs) that represent human NoV GI.1 and GII.4. To construct biosensors for NoV GI.1 and GII.4 detection, the commercial AMC sensors, on which anti-mouse Fc-specific antibodies were preimmobilized on the surfaces, were further bound with the capture antibodies mAb3901 and mAb NS14, respectively, by using the Blitz system. The kinetics of immobilization of capture antibodies on the AMC sensors demonstrated that mAb3901 and mAb NS14 reached saturated binding phase almost at the same time (~415 s). The optimal concentration of capture antibodies for immobilization was 15 μg/mL for both mAb3901 and mAb NS14. The AMC sensors loaded more mAb NS14 than mAb3901 at the same binding condition. The biosensors constructed by immobilization of the capture antibodies at their optimal concentration showed tight binding interactions with their respective GI.1 VLPs and GII.4 VLPs, with the affinity constant of 6.01 × 10⁻⁷ M and 2.01 × 10⁻⁷ M, respectively. For both biosensors, the VLPs binding rates were linearly increased with the increase of VLP concentrations. These biosensors were able to detect GI.1 or GII.4 VLPs at the concentration of 5 μg/mL in PBS, and showed intense and stable binding interactions at VLP concentration of 10 μg/mL and above. The mAb NS14-immoblized biosensors for GII.4 VLP detection were more sensitive than the mAb3901-immoblized biosensors for GI.1 VLP detection. This detection technique was label-free, easy, rapid (2 min), and accurate, requiring a very small sample volume (4 μL).
Keywords
Bio-Layer interferometry; Biosensor; Rapid detection; Virus like particles; Novovirus
Introduction
Human Norovirus (NoV) is the most common cause of nonbacterial, acute gastroenteritis outbreaks worldwide [1,2], accounting for more than 21 million illnesses and hospitalizations, and at least 570 deaths in the United States each year (Centers for Disease control and Prevention, 2013). NoVs are a genetically diverse group of single-stranded RNA, non-enveloped viruses in the Calicivirdae family. NoVs are classified into six genogroups (GI to GIV) and further subclassified into genotypes based on their capsid sequence [2]. Most NoVs that infect humans belong to genogroups GI and GII [3]. NoV GI.1 is the first isolated genotype and is considered the prototype virus of the genus, whereas NoV GII.4 is currently the most frequently detected genotype in humans [4,5]. NoV is extremely contagious and affects people of all ages with a low infectious dose of 18 particles or less [5]. The transmission of NoV occurs directly through person to person (62-84% of all reported outbreaks) and indirectly via contaminated water and food [6]. NoV aerosols are formed during vomiting and toilet flushing when vomit or diarrhea is present. It is estimated that as many as 30 million virus particles are released in a single episode of vomiting Infection may develop after eating food or breathing air near an episode of vomiting, even if it is cleaned up. NoV shedding can be detected many weeks after infection symptoms have subsided [7].
The main challenges hindering work with human NoVs are that they cannot be cultivated in vitro and there is no animal model for their propagation. Consequently, surrogate viruses, which are morphologically similar and cultivable, are widely used to mimic human NoV behavior [8]. NoV virus-like particles (VLPs) are also used as model viral systems in research. VLPs are formed by the expression of the major capsid protein (ORF2) in baculovirus [9] and Venezuelan equine encephalitis virus [10]. Each VLP is ~38 nm in diameter and has repeating arch-like surface features. These arches are formed by 90 dimers of a single capsid protein and contain both a shell and protruding (P) domain. The former houses the capsid’s N-terminus, consisting of 225 residues of the 530 amino acid (aa) sequence [11], while the latter forms the top (P2 domain) and body (P1 domain) of each arch-like structure. The P1 and P2 domains contain the C-terminus and the central regions of the amino acid sequence, respectively [12]. These VLPs do not contain genomic RNA and are replication deficient, however their morphologies are nearly identical to native virus particles. Recent studies have proved that VLPs could be used to understand the role of immunological factors on the evolution and emergence of new strains [13,14]. NoV VLPs have been successfully expressed using several expression systems. The characteristics of NoV VLPs make them appropriate models for NoVs in biological assays to answer human NoV-specific questions, and for the development of detection and inactivation methods for human NoV [15-17].
Various technologies have been investigated for detection of NoVs in clinical and environmental samples. These technologies mainly include electron microscopy techniques, molecular detection techniques, and immunological techniques. Diagnostic electron microscopies (DEM) have been widely accepted as a diagnostic method since 1980s for being able to visualize virus particles and other pathogens including bacteria and parasites. However, the high costs of DEM equipment and the need of experienced staff for the operation are hampering its usage and timely renewal [17]. The molecular detection techniques, such as polymerase chain reaction (PCR) and nonisotopic detection methods, have had the greatest impact on the clinical virology laboratory. Their low detection limits are ideal for screening the low viral loads common to contaminated foods and environmental samples [18] but the detection sensitivity and specificity are largely affected by the efficacy of the concentration, purification, and reaction conditions. The typical immunological techniques, enzyme-linked immunosorbent assays (ELISAs), are generally easy to perform without the need for sophisticated equipment. However, their need for high viral loads limits the assays’ application mostly in clinical settings [15,17,19].
Biosensor technologies represent a class of analytical methods/ devices that combine the high selectivity from the bio-recognition molecules and the sensitivity for quantification measurement from the transducers, and offer rapid detection, easy to use, and the possibility of miniaturization advantages over typical instrumental analysis [20,21]. The label-free bio-layer interferometry (BLI) technologybased biosensors have gained popularity in recent years as a reliable method for analyzing biomolecular interactions such as proteinprotein interactions, protein-liposome interactions, and others [22,23]. BLI technology is based on the monitoring of the interference pattern of white light reflected from two surfaces: a layer of immobilized protein on the fiber optic biosensor tip and an internal reference layer [24]. The binding of specific molecules in sample solutions to the biosensor tip causes a shift in the interference pattern. This shift can be monitored in real time, and allows rapid identification, quantitation, and characterization of proteins and other biomolecules in a very small sample volume (4 μL). The BLI-based biosensor can be a disposable sensor made from a biocompatible matrix that is uniform, non-denaturing and minimizes non-specific binding. Only molecules that bind directly to the biosensor surface are detected, providing exceptional specificity for individual applications. In addition, this optical-based measurement can minimize interferences from colored samples and has the potential for testing clinical samples while overcoming the issues from difficult sample matrix [25]. The objective of this study was to evaluate a bio-layer interferometry (BLI)-based biosensor platform for the detection of NoV using GI.1 and GII.4 VLPs. In this study, anti-mouse IgG Fc Capture (AMC) sensors were used for immobilizing anti-GI.1 and anti-GII.4 VLP antibodies as the capturing antibodies for detection of NoV GI.1 and GII.4 VLPs, respectively. The binding kinetics between VLPs and the capture antibodies on the biosensors were examined in real time and the detection sensitivities of the biosensors to GI.1 and GII.4 VLPs were evaluated.
Materials and Methods
VLPs, antibodies and chemicals
Stock solutions of GI.1 VLPs, GII.4 VLPs, monoclonal anti-GI.1 VLP antibody 3901 (mAb 3901), and monoclonal anti-GII.4 antibody NS14 (mAb NS14) were obtained from Dr. Robert Atmar’s laboratory at the Baylor College of Medicine (Houston, TX). Phosphate buffered saline (PBS), pH 7.4, was prepared in-house from a 1X (0.01 M) PBS recipe (Cold Spring Harbor Protocols) using NaCl, KCl, Na2HPO4, and KH2PO4, which were all purchased from Fisher Scientific.
Biosensor construction and detection procedures
To construct the biosensors for VLP detection, anti-mouse IgG Fc capture (AMC) sensors were used (Pall FortéBio Corp., Menlo Park, CA). The AMC sensors were pre-immobilized with a layer of highaffinity antibody against the Fc portion of mouse IgG (mIgG) on their surfaces, which can be used for further immobilizing mIgG or other Fc-containing ligands to produce a stable surface for specific capturing of target molecules. Figure 1A shows the image of the AMC sensor and the illustration of antibody immobilization steps. The AMC sensor is a needle-shaped sensor with approximately 1 cm in length but with a flat tip of approximately 1 mm in diameter. The actual sensing surface is the surface of its flat tip. For detection of GI.1 and GII.4 VLPs, monoclonal antibodies mAb3901 (specific to GI.1) and mAb NS 14 (specific to GII.4) at various concentrations in 1 × PBS buffer were freshly prepared and used to immobilize on AMC sensors, respectively. The immobilization step was carried out using the BLItz instrument (Fortébio Inc., Menlo Park, CA) by immersing the AMC biosensors in 200 μL antibody solutions with constant shaking (1000 rpm) at room temperature for 420 s. The immobilization curves were recorded in real time using the BLItz instrument with software BLItz Pro (version 1.2.0.49, Fortébio Inc., Menlo Park, CA). To optimize the antibody concentration for immobilization, the sensors were immobilized with different concentrations of mAb3901 or mAb NS14. The binding rates of the resulting sensors to GI.1 or GII.4 VLPs at the concentration of 10 μg/mL were measured and compared.

Figure 1: (A) The image of the AMC sensor and the illustration of the steps for antibody immobilization and VLP capture onto the BLI biosensor. (B) The typical stepwise sensograms of the BLI biosensors to GI.1 and GII.4 VLPs during antibody immobilization and the detection of VLPs.
Once the optimal antibody concentration for immobilization was selected, the detection of GI.1 or GII.4 VLPs by the resulting biosensors was performed by measuring the binding rates of GI.1 or GII.4 VLPs at various concentrations in PBS buffer to the antibody-immobilized biosensors under constant shaking (1000 rpm) for 120 s. Binding affinity between the immobilized antibodies on the sensors and the target VLPs were determined by analyzing the binding kinetic curves using the software BLItz Pro. Linear response ranges of the biosensors to GI.1 and GII.4 VLPs were demonstrated.
Results and Discussion
The typical sensogram
The typical sensogram for the stepwise antibody immobilization and the detection of VLPs is shown in Figure 1B. The sensogram showed the real-time signal of the sensor in response to the binding of mAb3901 and mAb NS14 antibodies to the AMC sensor surfaces, which include a quick initial binding phase and a slow to non-increase phase toward the saturation of antibody binding. This was followed by the wash step in which free antibodies and non-specific bindings were washed away, and the final VLP binding step in which each strain of VLPs showed their individual characteristic binding curves. These binding curves can be analyzed to determine the kinetics of antibody immobilization and the VLP binding, and the binding affinities between mAb3901 or mAb NS14 to the AMC sensors, and between VLPs to mAb3901-immobilized sensor or mAb NS14-immobilized sensors. The binding rate extracted from these binding curves can be used as the detection signals for VLPs detection, as demonstrated in the following sections.
Kinetics of antibody immobilization on AMC biosensors
The first step to construct the biosensor was the immobilization of mouse anti-NoV VLP antibodies (mAb3901 or mAb NS14) onto the AMC sensors through the binding of their Fc region to the pre-existing anti-mouse IgG antibodies on the surface. Figure 2A and 2B shows the representative binding curves of antibody mAb3901 and mAb NS14 at two different concentrations (15 μg/mL and 25 μg/mL) onto the AMC sensors that resulted from three replicates, respectively. In both cases, 1 × PBS without antibody was used a control. As shown in both Figures 2A and 2B, a higher binding rate was observed at a higher antibody concentration (25 μg/mL) during the binding of mAb3901 or mAb NS14 to the AMC sensor than that at a lower antibody concentration (15 μg/mL), which is common as the binding event should follow the law of mass action. At higher concentrations, more antibody molecules diffuse to reach and bind to the anti-mouse IgG molecules on the surface of the AMC sensor. Looking at the entire binding processes for both mAb3901 and mAb NS14, the binding curves presented similar patterns, where at the first 20 s, the binding of both mAb3901 and mAb NS14 to the AMC sensors increased immediately and rapidly, showing exponential increasing binding rates, followed by a slower binding stage, and a final saturated stage. Closer examination of the individual binding curves provided detailed kinetics of mAb3901 and mAb NS14 immobilization onto the AMC sensor. For mAb 3901, the binding signal level at the first 20 s were 0.099 nm and 0.242 nm, at the concentration of 15 μg/mL and 25 μg/mL, respectively. From 20 s to 125 s, the binding of mAb3901 at both concentrations showed linear increasing trends, and from 125 s to 415 s, the binding event showed a slower increasing trend and started the stationary phase at 415s. Between 415 s to 420 s, the binding event reached the saturation stage and had the highest binding signal level of 0.795 nm and 1.22 nm at the concentration of 15 μg/mL and 25 μg/mL, respectively. The binding of mAb NS14 to the AMC sensors showed a similar overall trend as that of mAb3901, except that the binding of mAb NS14 antibody had a steeper increasing trend in the first stage. The binding signal levels for NS14 binding were higher than those of mAb3901 at the same concentrations in the entire binding process. At saturation, the mAb NS14 binding signal levels were 1.075 nm and 1.477 nm at the concentration of 15 μg/mL and 25 μg/mL, respectively.

Figure 2: (A) The binding curves of mAb3901 and mAb NS14 antibodies onto the AMC biosensors. Each line was for a representative sample selected from three replicates. (B) The effect antibody concentration during the antibody immobilization step on the binding of VLPs to the resulting antibody-immobilized sensors.
Looking into the binding process of mAb3901 or NS14 antibodies to anti-mouse IgG on the AMC sensor surface, it is a reversible reaction that can be expressed as reaction (1) and (2):
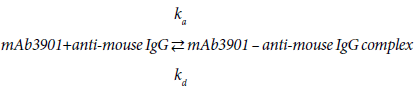 (1)
(1)
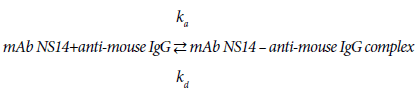 (2)
(2)
The kinetic patterns of mAb3901 or mAb NS14 binding follow the law of mass action. At the beginning, as the concentration of mAb3901 or NS14 antibody near the AMC surface was high, the reaction was predominant on the forward reaction to form the complex formation; As time elapsed, the concentration of complex on the AMC sensor surface increased and the available binding sites (anti-mouse IgG) for mAb3901 or mAb NS14 gradually decreased, leading to the gradual slowdown of the forward reaction until equilibrium was reached. The binding of molecules onto a biosensor surface might be characterized as a fractal system along with its different complexities, including heterogeneities on the surface and in solution, diffusion-coupled reactions, and time-varying adsorption (or binding), and even dissociation rate coefficient. In general, the molecule concentration in solution has a mild effect on the fractal dimension for binding compared to those reactions in solutions.
The kinetics of the antibody binding can be used for estimating the dissociation constants between mAb3901 or mAb NS14 antibodies and anti-mouse IgG antibodies on the AMC surfaces. According to reaction (1), the binding affinity constant between mAb3901 or NS14 antibody and the anti-mouse IgG antibody can be expressed by eq. (1):
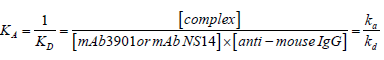 (1)
(1)
Whereas; ka, kd, KA, KD represent the association rate constant, the dissociation rate constant, the equilibrium associate constant, and the equilibrium dissociation constant, for reaction (1) or (2); square brackets represent chemical concentrations. The association rate constant, ka, describes how fast molecules bind to the sensor surface and the dissociation rate constant, kd, describes how fast complexes fall apart. The equilibrium associate constant, KA, is considered as the affinity constant, it is time independent and indicates the complex strength, which is termed the binding strength. Therefore, the affinity determines how much complex is formed at equilibrium [26,27]. Using the software BLItz Pro (version 1.2.0.49) to analyze the binding kinetics, Table 1 shows the kinetic constants, including ka, kd, and KD, of both mAb3901 and NS14 binding to anti-mouse IgG on AMC sensors. The equilibrium dissociate constants (KD) for mAb3901 and mAb NS14 binding to anti-mouse IgG on AMC sensors were 2.45 × 10⁻⁸ M and 1.71 × 10⁻⁸ M, respectively. This observation indicated that mAb NS14 antibodies had a slightly higher affinity to anti-mouse IgG on the AMC biosensors than mAb3901, which was observed on the binding curves, and that at the same concentration, mAb NS14 antibodies bound more onto the AMC biosensors than mAb3901.
| Complex | Association rate constant (ka, M-1s-1) | Dissociation rate constant (kd, s-1) | Binding affinity constant (KD, M) |
|---|---|---|---|
| mAb3901-anti-mouse IgG | 6.09 × 10⁴ | 1.49 × 10⁻³ | 2.45 × 10⁻⁸ |
| mAb NS14-anti-mouse IgG | 5.02 × 10⁴ | 8.60 × 10⁻⁴ | 1.71 × 10⁻⁸ |
| mAb3901-GI.1 VLP | 1.21 × 10⁴ | 7.29 × 10⁻³ | 6.01 × 10⁻⁷ |
| mAb NS14-GII.4 VLP | 4.57 × 10⁴ | 9.20 ×10⁻³ | 2.01 × 10⁻⁷ |
Table 1: Summary of kinetic constants for mAb3901 and mAb NS14 antibody binding on AMC sensors and GI.1 and GII.4 VLPs binding on the mAb3901- immobilized and mAb NS14-immobilized biosensors.
Antibody concentration effects on VLP bindings
The optimal antibody concentration for immobilization was determined based on the sensor response to the binding of 10 μg/ mL VLP GI.1 or VLP GII.4 on the resulting biosensors that were immobilized with mAb3901 or mAb NS14 at concentrations of 0, 5, 15, and 25 μg/mL. Figure 2B shows the response signals of the resulting sensors at 120 s binding time in the binding of VLP GI.1 and GII.4, respectively. Both sensors showed an increased signal in binding rates with the increasing antibody concentration from 5 μg/mL to 25 μg/ mL used in the immobilization step. For the mAb3901-immobilized sensors for GI.1 VLPs detection, the concentration of mAb3901 used in the immobilization step increased from 5 to 15 μg/mL and to 25 μg/mL, and the detection signal of the resulting sensor increased by ~250% and 13.1%. For the mAb NS14-immobilized sensor for GII.4 VLP detection, the sensor signal increased by ~110% and 21%, when the concentration of mAb NS14 antibody used in the immobilization increased from 5 to 15 μg/mL and to 25 μg/mL, respectively. Therefore, for both sensors, antibody concentration at 15 μg/mL (mAb3901 or NS14) was selected for construction of the sensors for GI.1 and GII.4 VLP detection.
It was also noted that the sensors immobilized with the same antibody concentration and for the detection of the same concentration of VLPs, the resulting binding signals of the sensors for GII.4 VLPs were higher than those of sensors for GI.1 VLPs. At the antibody concentration of 15 μg/mL, the binding rates of mAb3901- immobolized sensors to GI.1 VLPs and mAb NS14-immobolized sensors to GII.4 VLPs were 0.0019 nm/s and 0.0022 nm/s, respectively. The binding rates of mAb NS14-immobolized sensors to GII.4 VLPs was ~15% higher than that of the mAb3901-immobilized sensors to GI.1 VLPs at the same concentrations. This was most likely related to the nature of the binding affinity between the capture antibody and the target VLPs. Antibodies are large and extremely flexible molecules that are able to adopt a wide range of conformations. The antigen-antibody binding process is closely related to the internal dynamics of the IgG [27]. Antibody mAb3901 was specific for GI viruses, and its epitope mapped to NoV amino acids 454 to 520, and specifically to E472, which forms a salt bridge with K514 [28]. mAb NS14 antibody specifically recognized GII viruses, and its epitope mapped to GII.4 amino acids 473 to 495. Although a number of conserved amino acids showed at the epitope of GI and GII antibody binding domains from various tested VLPs, only alanine was completely conserved within this domain [29]. The different amino acid sequence between GI and GII epitopes and the difference in conformation between mAb3901 and mAb NS14 antibody could be the factors that affect the VLP-antibody binding rate, except for those factors that are commonly observed to affect immunoassay performance, including antigen concentration, quality of immune-components solid phase, fluid phase (pH, ionic strength) [26], and reaction temperature.
Binding kinetics of VLPs onto the antibody-immobilized biosensors
Figures 3A and 3B show the binding curves of GI.1 and GII.4 VLPs at various concentrations to the mAb3901 and mAb NS14 antibodyimmobilized sensors, respectively. On both sensors, the binding curves of all VLP concentrations presented an almost linear binding phase in the first ten seconds, and after 120 s the binding signal slowed down significantly. Therefore, the binding curves were recorded up to 120 s for both sensors and for all VLP concentrations. The binding signal level at 120 s read from the instrumental graph (reading on y-axe) could be used as the binding signal to evaluate the sensor performance for VLP detection. For the mAb3901-immobolized sensors to detect GI.1 VLPs, the binding signal at 120 s increased with increasing concentrations of VLPs, with the binding signal of 0.05 nm, 0.14 nm, and 0.24 nm at the GI.1 concentration of 5 μg/mL, 10 μg/mL, and 20 μg/mL, respectively. Similar increasing binding signals at 120 s were observed for the mAb NS14-immobolized sensors to detect GII.4 VLPs. The binding signals were 0.01 nm, 0.19 nm and 0.34 nm at the GII.4 concentration of 5 μg/mL, 10 μg/mL, and 20 μg/mL, respectively. Both sensors demonstrated the increasing trend in binding signal with increasing concentrations of VLPs. However, low VLP concentration (5 μg/mL) hardly generated detectable signals. Between the two sensors, the mAb NS14-immobilized sensors for GII.4 VLPs generated higher binding signals at detectable VLPs concentrations. For example, the binding signal of GII.4 VLPs at 20 μg/mL to the NS14-immobilized sensor at 120 s was 41.67% higher than the binding signal of GI.1 VLPs at the same concentration to its sensor.

Figure 3: (A) (B)The binding curves of GI.I and GII.4 VLPs onto mAb 3901-immobilized sensors and mAb NS14- immobilized sensors, at VLP concentrations of 0, 5, 10, and 20 μg/mL. (C) The linear correlations between the binding rates obtained by the mAb3901-immobilized and mAb NS14-immobilized biosensors in response to GI.1 and GII.4 VLP binding and the VLP concentrations, respectively.
The binding rate (the slope of the binding curve) was obtained by the instrumental software and used to evaluate its linear relationship with VLP concentrations for quantitative analysis. Figure 3C shows the relationship between the binding rate and the VLP concentration for the two sensors for GI.1 and GII.4 VLPs detection. It indicated that both sensors had low binding rates when VLP concentrations were lower than 10 μg/mL. However, there was a linear correlation between the binding rate and VLP concentration when VLP concentrations were in the range of 10 μg/mL to 20 μg/mL for both sensors, with linear regression equations: Binding Rate=0.0004 [GII.4 VLPs] -0.0035 for GII.4 VLPs, and Binding Rate=0.0002 [GI.1 VLPs] – 0.0014 for GI.1 VLPs.
In view of the linear relationships between the two sensors for GI.1 and GII.4 VLPs, the mAb NS 14-immobilized sensors for GII.4 VLPs were more sensitive than the mAb3901-immobilized sensors for GI.1 VLPs. For example, at VLP concentration of 20 μg/mL, the binding rates of GI.1 and GII.4 VLPs to their sensors were 0.0021 and 0.0046 nm/s, respectively. GII.4 VLPs’ binding rate was 54.34% higher than that of GI.1 VLPs. Again, the difference in sensitivity between the two sensors was most likely related to the nature of the binding of mAb3901 antibody to GI.1 VLPs and mAb NS14 antibody to GII.4 VLPs, the amount of capture antibodies immobilized on the sensors, as well as other factors as discussed above.
The binding events between mAb3901 antibodies and GI.1 VLPs and between mAb NS14 antibodies and GII.4 VLPs to form the antibody- VLP complex followed the similar pattern as equations (1) and (2), and the kinetic parameters can be expressed and analyzed in the similar way as equation (3). Again, by analyzing the binding curves using the software BLItz Pro (1:1 fitting), the kinetic parameters for the binding between mAb3901 and GI.1 VLPs and between the NS14 antibody and GII.4 VLPs were obtained (Table 1). The dissociation constants (KD) for GI.1 VLP - mAb3901 complexes on the biosensor, and GII.4 VLP – mAb NS14 complexes on the biosensor, were 6.01 × 10⁻⁷ M and 2.01 × 10⁻⁷ M, respectively, which indicated that the affinity between mAb NS14 and GII.4 VLP was higher than that between mAb3901 and GI.1 VLP. In the process of VLP detection using the resulting biosensors at the given conditions, lower KD value or higher antibody concentration would improve the VLP-antibody complex formation at a given VLP concentration. The results also demonstrated that mAb NS14-immobilized sensors had higher antibody immobilization on the sensors compared to mAb3901-immoblized sensors at the same conditions. This explained the observation that GII.4 VLPs had a higher binding value than GI.1 VLPs to their respective sensors, and the more sensitive detection of GII.4 VLPs by the NS14-immobilized sensors than the mAb3901 immobilized sensor for GI.1 VLPs detection.
The BLI biosensors developed in this study were quick and easy to use, conducted real-time detection, and did not require isolation of the virus, genetic material, or any other complicated procedures associated with sample preparation. They only needed a 4 μL sample, and the test procedure was simply dipping and reading. The detection time was 2 min, which was much faster than the other reported biosensors for virus detection. For instance, Nidzworski et al. [30] developed universal immunosensors by using electrochemical impedance spectroscopy and direct attachment of antibodies to the gold electrode for the detection of all serotypes of the influenza A virus, andtheir sensors need about 30 min to finish analysis. Xu et al. [31] developed a piezoelectric diaphragm-based immunoassay chip to simultaneously detect HBV and α-detoprotein antibodies. The total assay time was less than 2 h. Wang et al. [32] evaluated the performance of a newly developed impedance biosensor for avian influenza virus detection with the detection time less than 1 h. Though the detection limit of this BLI-based sensor at its current condition was higher than commonly used ELISA-based methods reported in our previous study [15] and by others [33] it presents both challenges and opportunities for further development of a more sensitive method for Human Nov detection. Alternatively, with the combination of an effective concentrating method, it could possibly provide a strategy for rapidly screening suspect foods and environmental samples for norovirus, or to meet the growing need for rapid detection of HuNoV for in clinical and point-of-care settings, contributing to the reduction, prevention, and eventual eradication of norovirus-derived outbreaks [34,35].
Conclusions
This study demonstrated the proof-of-concept to use interferometry-based biosensors for the detection of Norovirus VLPs. The sensors was able to detect the binding of NoV VLPs in real time. The binding signal was detectable at the VLP concentration of 5 μg/ mL, however, the linear correlations between the sensor signal and the VLP concentration were demonstrated in the VLP concentration range of 10 g/mL to 20 μg/mL for both sensors for detection of GI.1 and GII.4 VLPs. In the antibody immobilization step, the nature of the binding between the anti-mouse IgG on the AMC sensor and mAb3901 antibody or mAb NS14 antibody affected the efficiency of antibody immobilization on the sensor, and further in the detection step, the nature of the binding between the capture antibody and the target VLPs affected the capture efficiency and the detection sensitivity of VLPs. The analysis of the kinetics of binding curves enabled the estimation of the affinity (dissociation constants) between capture antibodies and anti-mouse IgG antibody on the sensor, and between the capture antibodies and VLPs. This was in agreement with the observation that the sensors for the detection of GII.4 VLPs had higher sensitivity than the sensors for the detection of GI.1 VLPs. This BLIbased sensor detection technique was a label-free, easy-to-use, rapid (2 min) detection method, requiring only 4 μL sample volume. The results demonstrated the potential application prospect of BLI-based sensor for detection of NoV.
Acknowledgements
This study was supported by USDA-NIFA Agriculture and Food Research Initiative Competitive Grant No. 2011-68003-30395. The authors acknowledge Dr. Robert L. Atmar’s lab at Baylor College of Medicine (BCM) to provide all VLPs samples and antibodies to VLPs, also acknowledge the technical discussion provided by Dr. Robert L. Atmar at BCM and Dr. Lee-Ann Jaykus at North Carolina State University.
References
- Patel MM, Hall AJ, Vinje J, Parashar UD (2009) Noroviruses: a comprehensive review. J Clin Virol 44: 1-8.
- Zheng DP, Ando T, Fankhauser RL, Beard RS, Glass RI, et al. (2006) Norovirus classification and proposed strain nomenclature. Virology 346: 312-323.
- Vinje J, Green J, Lewis DC, Gallimore CI, Brown DW, et al. (2000) Genetic polymorphism across regions of the three open reading frames of Norwalk-like viruses. Arch Virol 145: 223-241.
- Glass RI, Parashar UD, Estes MK (2009) Norovirus gastroenteritis. N Engl J Med 361: 1776-1785.
- Teunis PF, Moe CL, Liu P, Miller SE, Lindesmith L, et al. (2008) Norwalk virus: how infectious is it. J Med Virol 80: 1468-1476.
- Moore MD, Goulter RM, Jaykus LA (2015) Human norovirus as a foodborne pathogen: challenges and developments. Annu Rev Food Sci Technol 6: 411-433.
- Atmar RL, Opekun AR, Gilger MA, Estes MK, Crawford SE, et al. (2008) Norwalk virus shedding after experimental human infection. Emerg Infect Dis 14: 1553-1557.
- Tung-Thompson G, Libera DA, Koch KL, de Los Reyes FL, Jaykus LA (2015) Aerosolization of a Human Norovirus Surrogate, Bacteriophage MS2, during Simulated Vomiting. PLoS One 10: e0134277.
- Jiang X, Wang M, Graham DY, Estes MK (1992) Expression, self-assembly, and antigenicity of the Norwalk virus capsid protein. J Virol 66: 6527-6532.
- Baric RS, Yount B, Lindesmith L, Harrington PR, Greene SR, et al. (2002) Expression and self-assembly of norwalk virus capsid protein from venezuelan equine encephalitis virus replicons. J Virol 76: 3023-3030.
- Prasad BV, Rothnagel R, Jiang X, Estes MK (1994) Three-dimensional structure of baculovirus-expressed Norwalk virus capsids. Journal of virology 68: 5117-5125.
- Hale A, Mattick K, Lewis D, Estes M, Jiang X, et al. (2000) Distinct epidemiological patterns of Norwalk-like virus infection. Journal of medical virology 62: 99-103
- Donaldson EF, Lindesmith LC, Lobue AD, Baric RS (2010) Viral shape-shifting: norovirus evasion of the human immune system. Nat Rev Microbiol 8: 231-241.
- Lindesmith LC, Donaldson EF, Baric RS (2011) Norovirus GII.4 strain antigenic variation. J Virol 85: 231-242.
- Jessica Jenkins B, Matthew DM, Jaykus J (2014) Design and Evaluation of Three Immuno-based Assays for Rapid Detection of Human Norovirus Virus-like Particles. Journal of Analytical & Bioanalytical Techniques 5.
- Escudero-Abarca BI, Rawsthorne H, Goulter RM, Suh SH, Jaykus LA (2014) Molecular methods used to estimate thermal inactivation of a prototype human norovirus: More heat resistant than previously believed. Food Microbiology 41: 91-95.
- Gentile M, Gelderblom HR (2014) Electron microscopy in rapid viral diagnosis: an update. New Microbiol 37: 403-422.
- Knight A, Li D, Uyttendaele M, Jaykus LA (2013) A critical review of methods for detecting human noroviruses and predicting their infectivity. Crit Rev Microbiol 39: 295-309.
- Hirneisen KA, Kniel KE (2012) Comparison of ELISA attachment and infectivity assays for murine norovirus. J Virol Methods 186: 14-20.
- Hong SA, KwonJ, Kim D, Yang S (2015) A rapid, sensitive and selective electrochemical biosensor with concanavalin A for the preemptive detection of norovirus. Biosens Bioelectron 64: 338-344.
- Mandal SS, Navratna V, Sharma P, Gopal B, Bhattacharyya AJ (2014) Titania nanotube-modified screen printed carbon electrodes enhance the sensitivity in the electrochemical detection of proteins. Bioelectrochemistry 98: 46-52.
- Levina A, Lay PA (2014) Influence of an anti-metastatic ruthenium(iii) prodrug on extracellular protein-protein interactions: studies by bio-layer interferometry. Inorganic Chemistry Frontiers 1: 44-48.
- Wallner J, Kuhleitner M, Brunner N, Lhota G, Vorauer-Uhl K (2014) Application of the log-normal model for long term high affinity antibody/antigen interactions using Bio-Layer Interferometry. Journal of Mathematical Chemistry 52: 575-587.
- Groner M, Ng T, Wang W, Udit AK (2015) Bio-layer interferometry of a multivalent sulfated virus nanoparticle with heparin-like anticoagulant activity. Anal Bioanal Chem 407: 5843-5847.
- Auer S, Koho T, Uusi-Kerttula H, Vesikari T, Blazevic V, et al. (2015) Rapid and sensitive detection of norovirus antibodies in human serum with a biolayer interferometry biosensor. Sensors and Actuators B-Chemical 221: 507-514.
- Goldblatt D, van Etten L, van Milligen FJ, Aalberse RC, Turner MW (1993) The role of pH in modified ELISA procedures used for the estimation of functional antibody affinity. J Immunol Methods 166: 281-285.
- Galanti M, Fanelli D, Piazza F (2016) Conformation-controlled binding kinetics of antibodies. Sci Rep 6: 18976.
- Parker TD, Kitamoto N, Tanaka T, Hutson AM, Estes MK (2005) Identification of Genogroup I and Genogroup II broadly reactive epitopes on the norovirus capsid. J Virol 79: 7402-7409.
- Crawford SE, Ajami N, Parker TD, Kitamoto N, Natori K, et al. (2015) Mapping broadly reactive norovirus genogroup I and II monoclonal antibodies. Clin Vaccine Immunol 22: 168-177.
- Nidzworski D, Pranszke P, Grudniewska M, Krol E, Gromadzka B (2014) Universal biosensor for detection of influenza virus. Biosens Bioelectron 59: 239-242.
- Ting X, Jianmin M, Zhihong W, Ling Y, Li L, et al. (2011) Micro-piezoelectric immunoassay chip for simultaneous detection of Hepatitis B virus and α-fetoprotein. Sensors and Actuators B: Chemical 151: 370-376.
- Wang R, Lin J, Lassiter K, Srinivasan B, Lin L, et al. (2011) Evaluation study of a portable impedance biosensor for detection of avian influenza virus. J Virol Methods 178: 52-58.
- Kele B, Lengyel G, Deak J (2011) Comparison of an ELISA and two reverse transcription polymerase chain reaction methods for norovirus detection. Diagn Microbiol Infect Dis 70: 475-478.
- Lou F, Huang P, Neetoo H, Gurtler JB, Niemira BA, et al. (2012) High-pressure inactivation of human norovirus virus-like particles provides evidence that the capsid of human norovirus is highly pressure resistant. Appl Environ Microbiol 78: 5320-5327.
- Sadana A, Vo-Dinh T (2001) A kinetic analysis using fractals of cellular analyte-receptor binding and dissociation. Biotechnol Appl Biochem 33: 17-28.
Relevant Topics
Recommended Journals
Article Tools
Article Usage
- Total views: 11715
- [From(publication date):
August-2016 - Dec 04, 2024] - Breakdown by view type
- HTML page views : 10935
- PDF downloads : 780