Evaluation of Anticancer and Anti-Inflammatory Properties of Branched Chain Amino Acids
Received: 25-Jun-2018 / Accepted Date: 25-Jul-2018 / Published Date: 10-Aug-2018
Keywords: Cancer cell; Amino acid; Proliferation; Hyperinsulinemic; Gene expression
Abbreviations
BCAAs: Branched-Chain Amino Acids; PI3K: Phosphatidylinositol-3-Kinase; AKT: Protein Kinase B; MAPK: Mitogen-Activated Protein Kinase; ERK: Extracellular Signal- Regulated Kinases; TNFα: Tumor Necrosis Alpha; IL1β: Interleukin 1 Beta; NO: Nitric Oxide; NF-kB: Nuclear Factor Kappa-Light-Chain- Enhancer of Activated B Cells
Introduction
Amino acids are the building blocks of proteins and have important metabolic and physiological roles in all living organisms. BCAAs are composed of valine (Val), isoleucine (Ile), and leucine (Leu), which are essential amino acids for humans [1]. Catabolism of BCAAs occurs mainly in extra hepatic tissues such as: adipose tissue, kidney, cardiac and skeletal muscle due to the high activity of BCAT in these tissues, thereby converting BCAAs to branched chain alpha ketoacids (BCKA). BCKA can be released in the blood into other tissues for either reamination in order to reproduce BCAAs for protein synthesis, or for oxidative decarboxylation by the branched chain ketoacids dehydrogenase (BCKADH) complex, to produce acetyl CoA and succinyl CoA [2,3]. BCAAs in extra hepatic tissues can also act as a carbon source for the tricarboxylic acid (TCA) cycle [3].
The BCAAs has broad physiological roles, including regulating protein synthesis rate, affecting insulin resistance, have a contribution in lymphocyte proliferation and reducing hepatocyte apoptosis, as well as influencing the organism’s behavior through affecting the secretion of a certain neurotransmitter in the brain [4]. Moreover, BCAAs supplements enhance body maintenance and postpone muscle fatigue by improving aerobic exercise [5]. Several studies indicated the clinical use of BCAAs for patients with liver diseases, renal failure, sepsis, and surgical injury [6-9]. The elevation of BCAAs levels has been shown to be significantly correlated with insulin resistance, suggesting a possible involvement in future development of T2DM [10]. Furthermore, BCAAs were found to be active in cell signaling pathways, including insulin pathways where this can promote their critical role in glucose homeostasis as well as tumor progression [1].
Giesbertz and Daniel suggested that the reduction in the expression of BCAT and BCKADH was associated with the increased expression level of cytokines such as TNF-α in insulin resistance state [11]. However, a study by Roberta De Simone et al. on microglia cells show that BCAAs exhibit lower expression level of the IL-1β, TNF-α and nitric oxide synthase (iNOS) genes in unstimulated conditions, suggesting that BCAAs can circulate in high concentration through the bloodstream acting as signaling molecules or metabolic signatures or biomarkers in order to predict the development of insulin resistance and T2DM [11]. It was also suggested that BCAAs associated with the mammalian target of rapamycin (mTOR) signaling pathways, which regulate autophagy, cell survival, cell proliferation, protein synthesis, cell motility and cell growth. Several data indicate that the BCAAs, particularly leucine, can be responsible for the production of protein by direct activation of mTOR when compared with Rapamycin, which is the inhibitor of mTORC1 [1].
In vivo studies as well as in vitro show enhancing in insulin resistance by BCAAs through s PI3K/Akt signal pathway and Erk/ mitogen-activated protein kinase (MAPK) signal pathway, which can lower tumor cell proliferation and sensitize them toward apoptotic stimuli by stimulation of mTORC1 and S6 kinase, and deprivation of BCAAs could enhance the insulin sensitivity by affecting adenosine monophosphate-activated protein kinase (AMPK) and mTORC1 signaling pathways [12], which account for reducing the risk of development and progression of cancer in obese and/or diabetic patients.
BCAAs shows enhancing in skeletal muscle and glucose uptake by an unknown mechanism [13]. However, the effects of BCAA on proliferation of colorectal, breast and pancreatic cancer under hyperinsulinemic condition remains unclear.
In this study, we determine the effects therapeutic range of concentrations of BCAA on proliferation of colon (HT29, HCT116, SW620, CACO2 and SW480), breast (MCF7 and t47d) and pancreas (Panc1) cells under chronic hyperinsulinemic conditions and possibly the effect of BCAAs on PI3K/Akt and MAPK/ERK pathway. Furthermore, we expose the macrophages to LPS to investigate the possible anti-inflammatory effect of BCAAs under the activation of NF-kB pathway.
Materials and Methods
Chemicals/reagents
Dulbecco Modified Eagle Medium (DMEM) was obtained from Invitrogen (USA). ELISA JUMBO kit for rat high insulin was purchased from ALPCO (USA). Sulforhodamine B (SRB) dye was purchased from Promega (USA). Greiss reagent was purchased from Santa Cruz (USA). RNeasy Mini kit (QIAGEN, USA). Reverse transcription system (applied biosystem, USA). Fast SYBR green kappa master mix (Biosystem, USA). Ascorbic acid and LPS were purchased from Sigma-Aldrich (St. Luis, MO, USA). The essential amino acids Ile, Leu and Val as well as arginine (Arg) were procured from Santa Cruz (USA). The assays were performed according to manufacturers' instructions. Unless stated otherwise all, other chemicals, and solvents used in this study were purchased at the analytical grade from Sigma- Aldrich (St. Luis, MO, USA).
RAW 264.7 cell line culture
RAW 264.7 cell line (murine monocyte-macrophage cell), were maintained in DMEM containing 10% FBS, penicillin (100 μg/mL), streptomycin (100 μg/mL), and L- glutamine (100 μg/mL) in a 37°C humidified atmosphere with 95% air and 5% CO2. The culture medium was changed every 48-72 hour [14].
Cancer cell lines culture
Human breast cancer cell lines; namely MCF7 (mammary gland, breast; derived from metastatic site: pleural effusion. ATCC HTB-22) and T47D (mammary gland; derived from metastatic site: pleural effusion. HTB-133), pancreatic cancer cell line Panc1 (ATCC CRL1469) and human colorectal cancer cell lines; namely HT-29 (ATCC HTB-38), HCT116 (ATCC CCL-247), SW620 (ATCC CCL-227), SW480 (ATCC CCL-228), and CACO2 (ATCC HTB-37) were cultured in DMEM containing 10% FBS, HEPES Buffer (10 mM), L-glutamine (100 μg/mL), gentamicin (50 μg/mL), penicillin (100 μg/ mL), and streptomycin (100 mg/mL).
Nitric oxide assay
Murine macrophage cell line RAW 264.7 were cultured in DMEM supplemented with 10% FBS, penicillin (100 μg /mL), streptomycin (100 μg/mL), and L-glutamine (100 μg/mL) in a 37°C humidified atmosphere with 95% air and 5% CO2. The cells (2X 10⁵/well) were incubated with Ile, Leu, Val, BCAAs combination at concentration (1-25 mM) in the presence of LPS (10 μg/mL) for 24 hour. Indomethicin was used as reference drug. Following overnight incubation, aliquots of 100 μL of cell culture media were mixed with 100 μL Greiss reagent (50 μL of 1% Sulfanilamide in 5% phosphoric acid and 50 μL of 0.1% napthylehtyllenediamine-HCL) and incubated at room temperature for 10 min. Absorbance at 550 nm was determined using microplate reader (Bio-Tek Instrument, USA). The concentration of nitrite was determined by comparison with sodium nitrite standard curve. SRB protocol was performed for evaluation of the effect of Ile, Leu, Val, BCAA combination on RAW 264.7 after culture media removal [14].
Cell viability assay
The cytotoxicity measurements were determined using SRB colorimetric assay for cytotoxicity screening and mechanism of reduction of cell viability as described previously [15]. Colorectal (HT29, SW480, SW620, HCT116 and CACO2), breast (MCF7 and T47D) and pancreatic (Panc1) cancer Cell lines, were seeded in 96-well plates at a density of 5000 cells/well and cultured for 24 hour before serum starvation for 48 hour, then cultured in the medium containing Ile, Leu, Val, BCAAs combination at concentrations (1-25 mM) with 250 nm or without insulin [16]. After 72 hour, the SRB assay was performed [17]. Human periodontal ligament fibroblasts (PDL) are a primary cell culture for verification of selective cytotoxicity with the least antiproliferative IC50 value obtained. As a robust and classical antineoplastic reference agent, cisplatin (0.1-200 μg/mL), was recruited for comparison purposes [15]. All of the assays were performed in triplicate and the calculated IC50 antiproliferative activities were reported as the mean values ± SD (n=3).
Gene expression level assay
RAW 264.7 cells were plated at a density of 1 × 10⁶ cells/well in 6 well plate with/ without LPS (1μg/mL). HC116, MCF7 and Panc1 cell lines were plated at a density of 1 × 10⁶ cells/well in 6 well plate with/ without insulin (250 nM) [16]. After 24 hour, the selected concentration of the branched chain amino- and fatty- acids were incubated for another 24 hour to measure the fold change in gene expression of ILIβ, TNFα, GPx and Catalase, Bax, Cyclin D1 and β catenine [18].
Ribonucleic acid (RNA) extraction and analysis
Total RNA was extracted using RNeasy Mini kit (QIAGEN, USA). Cell pellets were retrieved from storage at -80°C, thawed on ice and suspended in 500 μL lysis solution consisting of 2-mercaptoethanol. An equal volume 500 μL of 70% ethanol solution was added to the filtered lysate and vortexed thoroughly, then cell lysate was transferred to the RNeasy Mini spin column and centrifuged at 10000 rpm for 15 seconds using microcentrifuge to remove cellular debris. Total RNA was trapped within the binding column. The flow-through liquid was discarded, and collection tube was returned to a binding column. Washing step was repeated 3 times. Then the binding column was transferred to a new collection tube. 50 μL of the RNase-free-water was add as elution solution directly to spin column membrane and centrifuged at 10000 rpm for 1 minute to elute RNA. Purified RNA was collected and stored immediately at -80°C .The concentration and the purity of the extracted total RNA were determined using a NanoDrop ND-1000 spectrophotometer (Thermo Scientific, Wilmington, USA). The optical densities were determined at 260 nm and 280 nm. The ratio (A260/A280) was 1.8-2.1 for most of the RNA extracted samples.
Complementary deoxyribonucleic acid (cDNA) synthesis
cDNA was synthesized using reverse transcription system (Applied Biosystem, USA). Total RNA 2 μg was placed into a microcentrifuge tube with 1 μL oligodeoxythimidine primer, then incubated for 5 minutes at 65°C using thermocycler C 1000 (Bio-Rad, USA) then were centrifuged briefly and placed on ice. The 20 μl reaction solution was prepared by adding the following reagents: 1.4 μL of 25 mM MgCl2, 4 μL of 10 mM deoxynucleotide triphosphate (dNTP) mixture. Reverse transcription 10X buffer (2 μL), recombinant RNasin® ribonuclease inhibitor (1 μL), avian myeloblastosis virus reverse transcriptase (1 μL) (AMV-RT). The thermal conditions for cDNA synthesis were as follows: Microcentrifuge tubes were incubated at 37°C for 30 minutes. For denaturation step, samples were heated at 95°C for 5 minutes. Microcentrifuge tubes were then incubated at 4°C for 5 minutes and stored at -80°C for further analysis. The concentration and the purity of cDNA were determined by NanoDrop ND-1000 spectrophotometer (Thermo Scientific, Wilmington, USA). The optical densities were determined at 260 nm and 280 nm. The ratio (A260/A280) was 1.6-1.8 for most of the cDNA extracted samples.
Relative quantitative RT-PCR analysis
The analyses of mRNA expression levels of tested genes were relative -quantitative using fast SYBR green kappa master mix (Biosystem, USA). For each PCR reaction, 1-2 μL of cDNA template was added directly to PCR mixture and set to a final volume of 20 μL, containing 1X concentrated KAPA SYBR green fast master mix, 200 nM of the forward primer and 200 nM of the reverse primer. The sequences of each primer sets used are listed in Table 1. The PCR amplifications were performed in the IQ5 multicolor real-time PCR detection system (Bio-Rad, USA). Each reaction was completed with a melting curve with a gradient from 70°C-95°C. Glyceraldehyde-3-phosphate dehydrogenase (GAPDH) was used as an internal reference gene to normalize the expression of tested genes, In order to determine the efficiency of the PCR reactions, standard curve method for relative quantification was used.
Statistical analysis
The results were presented as means ± standard deviation (SD) of 3-4 independent experiments. Statistical differences between control and different treatment groups determined using GraphPad Prism ANOVA followed by Dunnett's post hoc test. For all statistical analysis, a p-value of less than 0.05 was considered statistically significant. p values of less than 0.001 were considered of a highly significant statistical difference.
Results
Inflammation assay
The effect of BCAA on LPS-induced NO: The inhibitory bioactivities of the BCAA against LPS-induced nitric oxide (NO) production in RAW 264.7 mouse macrophages were examined using the Griess assay. Indomethacin was used as positive control. Table 1 demonstrates the IC50 values on NO inhibitory by BCAAs with no reduction on cell viability. However, the IC50 for Indomethacin was 0.212 mM, and none of the effective branched acids could prove equally potent.
| Treatments | NO inhibition-IC50 value (mM) | Cytotoxity IC50 value (mM) |
|---|---|---|
| Ile | 632.38 ± 94.17 | NI |
| Leu | 132.68 ± 21.29 | NI |
| Val | NI | NI |
| BCAA combinations | 42.11 ± 4.21 | NI |
| Arg | NI | NI |
| Reference drug | Indomethacin 0.212 × 10⁻³ ± 0.08 | NI |
Table 1: IC50 values of in vitro anti-inflammatory activities of BCAAs, and Indomethacin on LPS (10 μg/mL) induced Nitric Oxide production in RAW macrophages.
Results are mean ± SD (n=3-4 independent replicates). IC50 values (concentration at which 50% inhibition of bioactivity determined in comparison to non-induced basal incubations) were calculated within (1-25 mM) for BCAA. NI: Non Inhibitory in the tested range of concentrations.
Genes expression of pro-inflammatory cytokines
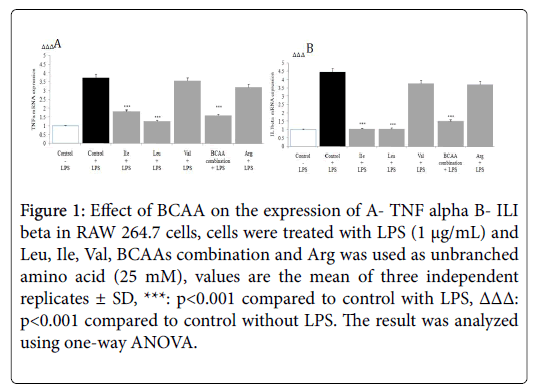
The gene expression level of cytokines like TNF-α and IL-1β in the presence of BCAAs was determined by RT-PCR. The stimulation of macrophage by LPS elicits the production of pro-inflammatory cytokines TNF-α, and IL-1β. RT-PCR analysis showed the Ile, Leu and BCAAs combination significantly down regulated LPS induced TNF-α, and IL-1β mRNA production in macrophages (p<0.001) (Figure 1).
Figure 1: Effect of BCAA on the expression of A- TNF alpha B- ILI beta in RAW 264.7 cells, cells were treated with LPS (1 μg/mL) and Leu, Ile, Val, BCAAs combination and Arg was used as unbranched amino acid (25 mM), values are the mean of three independent replicates ± SD, ***: p<0.001 compared to control with LPS, ΔΔΔ: p<0.001 compared to control without LPS. The result was analyzed using one-way ANOVA.
Modulation of proliferation of colorectal cancer cell lines as well as fibroblasts by BCAAs
The antiproliferative efficacies of Cisplatin tested in all colorectal carcinomas are further illustrated in (Table 2). Moreover, Arg (the unbranched amino acid) lacked on antiproliferative efficacies on all colorectal carcinomas.
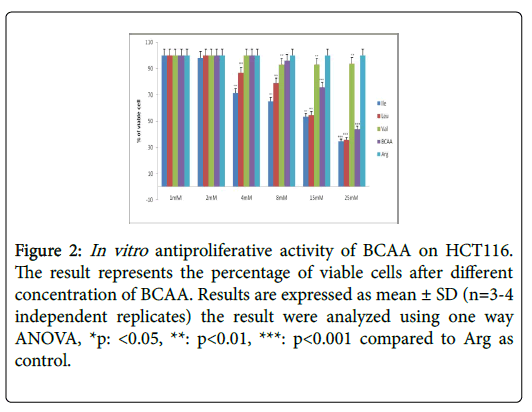
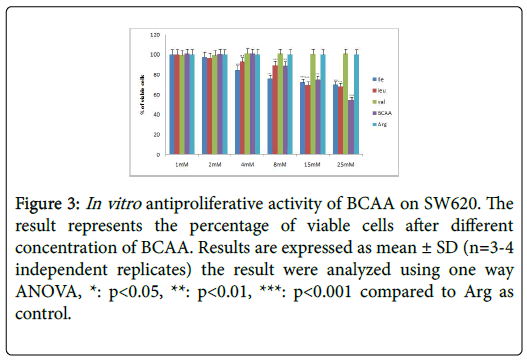
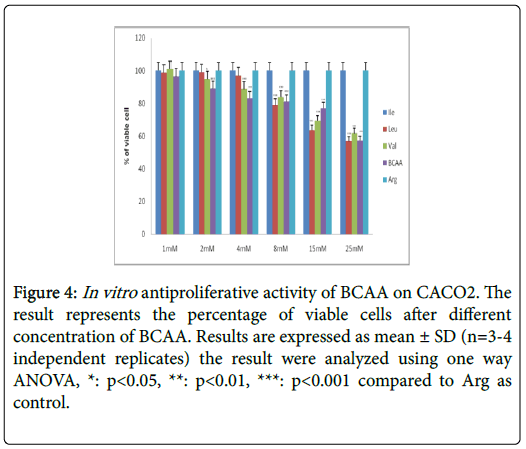
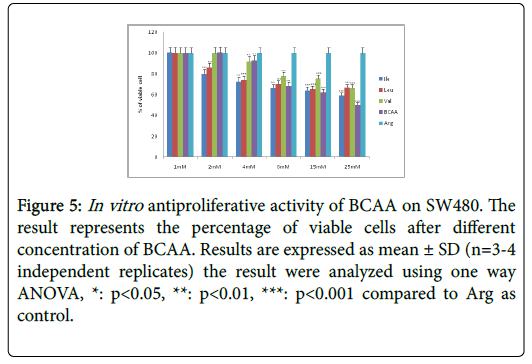
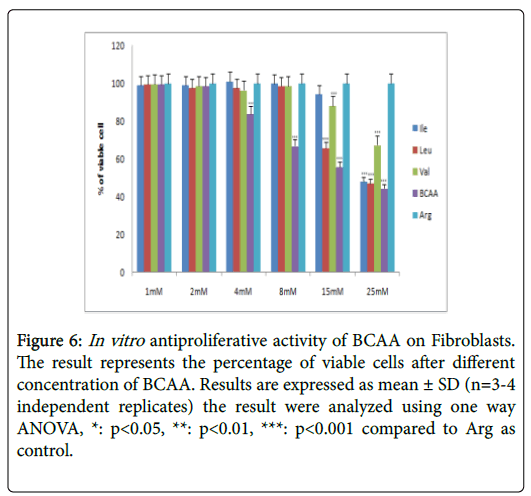
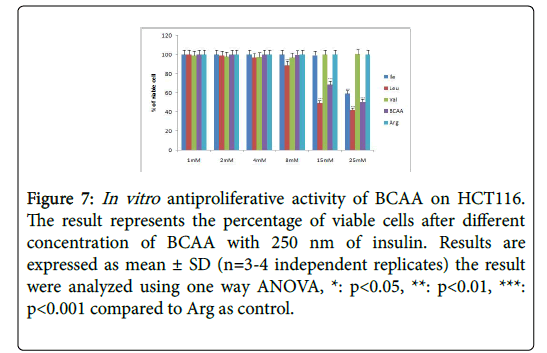
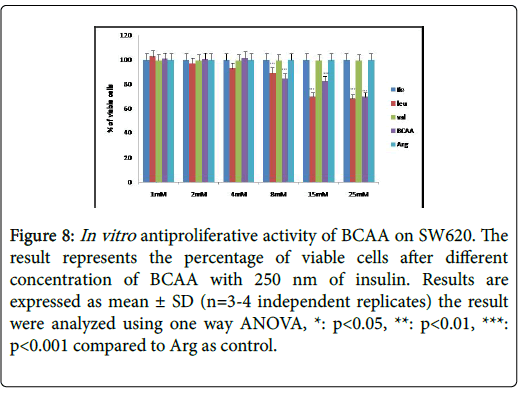
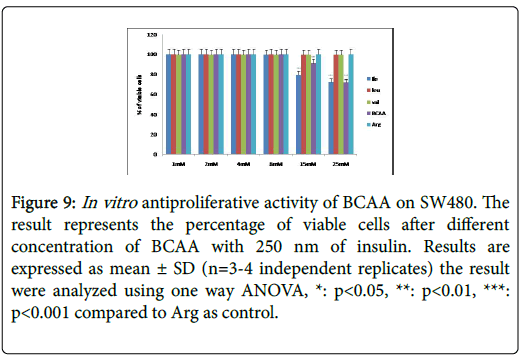
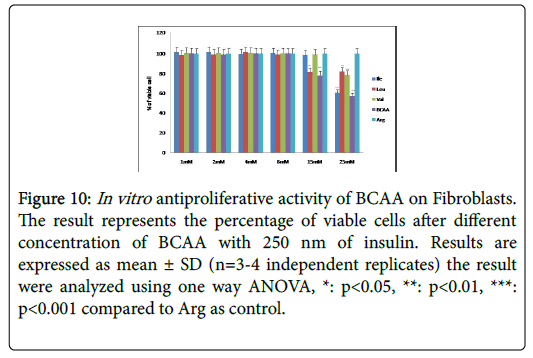
Table 2 further displays the lack of antiproliferative efficacies by Ile, Leu, Val and BCAA combination on HT29 colorectal cancer cells. Nevertheless, their cytotoxity against HCT116, SW620, CaCO2 and SW480 proved substantially evident over 72 h incubations. Furthermore, the Ile, Leu, Val and BCAA combination exerted antiproliferative efficacies against HCT116, SW620, and SW480 (but not the CaCO2) when cotreated with 250 nM insulin. Nevertheless, all branched chain acids lacked selective cytotoxicity in fibroblasts (Table 2) (Figures 2-10).
| Treatment | Cytotoxicity (as of % Control) IC50 value mM | |||||
|---|---|---|---|---|---|---|
| HT29 | HCT116 | SW620 | CACO2 | SW480 | Fibroblasts | |
| Ile | NI | 14.5 ± 0.3 | 87.6 ± 11.6 | NI | 41 ± 3.3 | 27.5 ± 1 |
| Leu | NI | 18.9 ± 0.8 | 65.0 ± 5.9 | 29.5 ± 3.8 | 65.1 ± 6.8 | 20.7 ± 1.2 |
| Val | NI | NI | NI | 43.9 ± 5.1 | 70 ± 9.8 | 37.1 ± 2.4 |
| BCAAs combination | NI | 23.7 ± 0.7 | 60.5 ± 5.8 | 47.6 ± 4.3 | 22.9 ± 1 | 18.8 ± 2.1 |
| Arg | NI | NI | NI | NI | NI | NI |
| Cisplatin | 8.1*10-³ ± 0.2 | 39.4*10-³ ± 0.5 | 7.7*10-³ ± 0.1 | 3.4*10-³ ± 0.8 | 7.6*10-³ ± 1 | 7.1*10-³ ± 0.6 |
| Treatment | Cytotoxicity (as of % Control) IC50 value mM with 250 nM insulin | |||||
| Ile | NI | 37.9 ± 5.6 | NI | NI | 60.7 ± 20.8 | 40.8 ± 5.5 |
| Leu | NI | 17.5 ± 1 | 72.8 ± 7.7 | NI | NI | 32.7 ± 3.4 |
| Val | NI | NI | NI | NI | NI | 31.4.5 ± 1.1 |
| BCAAs combination | NI | 23.8 ± 2.9 | 89.09 ± 9.05 | NI | 65.3 ± 1.7 | 26.9.5 ± 0.3 |
| Arg | NI | NI | NI | NI | NI | NI |
Table 2: IC50 values (mM) of in vitro antiproliferative activity of BCAA on colorectal cancer cell lines.
Figure 2: In vitro antiproliferative activity of BCAA on HCT116. The result represents the percentage of viable cells after different concentration of BCAA. Results are expressed as mean ± SD (n=3-4 independent replicates) the result were analyzed using one way ANOVA, *p: <0.05, **: p<0.01, ***: p<0.001 compared to Arg as control.
Figure 3: In vitro antiproliferative activity of BCAA on SW620. The result represents the percentage of viable cells after different concentration of BCAA. Results are expressed as mean ± SD (n=3-4 independent replicates) the result were analyzed using one way ANOVA, *: p<0.05, **: p<0.01, ***: p<0.001 compared to Arg as control.
Figure 4: In vitro antiproliferative activity of BCAA on CACO2. The result represents the percentage of viable cells after different concentration of BCAA. Results are expressed as mean ± SD (n=3-4 independent replicates) the result were analyzed using one way ANOVA, *: p<0.05, **: p<0.01, ***: p<0.001 compared to Arg as control.
Figure 5: In vitro antiproliferative activity of BCAA on SW480. The result represents the percentage of viable cells after different concentration of BCAA. Results are expressed as mean ± SD (n=3-4 independent replicates) the result were analyzed using one way ANOVA, *: p<0.05, **: p<0.01, ***: p<0.001 compared to Arg as control.
Figure 6: In vitro antiproliferative activity of BCAA on Fibroblasts. The result represents the percentage of viable cells after different concentration of BCAA. Results are expressed as mean ± SD (n=3-4 independent replicates) the result were analyzed using one way ANOVA, *: p<0.05, **: p<0.01, ***: p<0.001 compared to Arg as control.
Figure 7: In vitro antiproliferative activity of BCAA on HCT116. The result represents the percentage of viable cells after different concentration of BCAA with 250 nm of insulin. Results are expressed as mean ± SD (n=3-4 independent replicates) the result were analyzed using one way ANOVA, *: p<0.05, **: p<0.01, ***: p<0.001 compared to Arg as control.
Figure 8: In vitro antiproliferative activity of BCAA on SW620. The result represents the percentage of viable cells after different concentration of BCAA with 250 nm of insulin. Results are expressed as mean ± SD (n=3-4 independent replicates) the result were analyzed using one way ANOVA, *: p<0.05, **: p<0.01, ***: p<0.001 compared to Arg as control.
Figure 9: In vitro antiproliferative activity of BCAA on SW480. The result represents the percentage of viable cells after different concentration of BCAA with 250 nm of insulin. Results are expressed as mean ± SD (n=3-4 independent replicates) the result were analyzed using one way ANOVA, *: p<0.05, **: p<0.01, ***: p<0.001 compared to Arg as control.
Figure 10: In vitro antiproliferative activity of BCAA on Fibroblasts. The result represents the percentage of viable cells after different concentration of BCAA with 250 nm of insulin. Results are expressed as mean ± SD (n=3-4 independent replicates) the result were analyzed using one way ANOVA, *: p<0.05, **: p<0.01, ***: p<0.001 compared to Arg as control.
Results are mean ± SD (n=3-4 independent replicates). IC50 values (concentration at which 50% inhibition of cell proliferation took place in comparison to non-induced basal 72 h incubations). NI is noninhibitory.
Modulation of proliferation of breast and pancreatic cancer cell lines by BCAAs
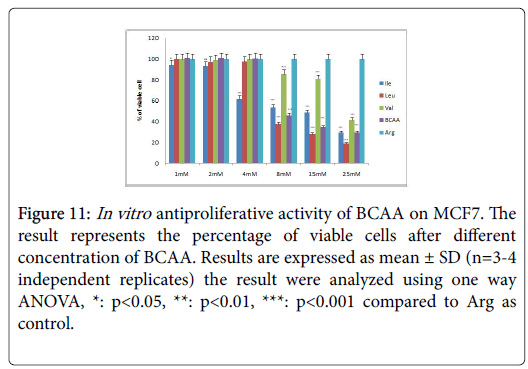
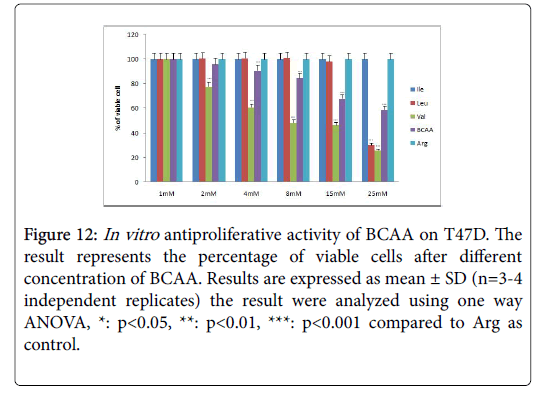
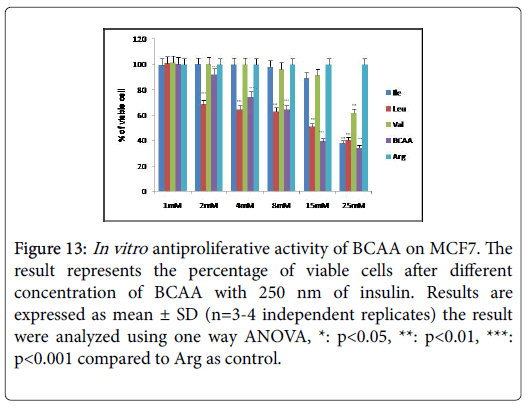
The antiproliferative efficacies of Cisplatin in both breast cancer cell lines as well as pancreatic cancer cell line Panc1 was illustrated (Table 3). Yet again the unbranched amino acid Arg lacked on antiproliferative efficacies in these cell lines. The antiproliferative efficacies of Leu, ILe, Val and BCAAs combination on MCF7 were evident in presence or absence of insulin. Insulin co-treatment with Leu, Val and BCAAs combination could abrogate their cytotoxicity in T47D cells over 72 hour incubations. Leu, Val and BCAAs combination exerted antineoplastic effects in Panc1 but only Leu and BCAAs combination in insulin wells sustained their antiproliferative activities (Table 3 and Figures 11-13).
| Treatment | Cytotoxicity (as of % Control) IC50 value mM | ||
|---|---|---|---|
| MCF7 | T47D | Panc1 | |
| Ile | 10.7 ± 1.1 | NI | NI |
| Leu | 9.5 ± 0.3 | 24.2 ± 0.4 | 23.8 ± 2.5 |
| Val | 30 ± 3.4 | 8.8 ± 1.3 | 91.5 ± 10.8 |
| BCAAs combination | 10.9 ± 1.1 | 42.5 ± 2.13 | 159.5 ± 23 |
| Arg | NI | NI | NI |
| Cisplatin | 3.9 × 10-³ ± 0.1 | 20.3 × 10-³ ± 0.28 | 8.3 × 10-³ ± 0.3 |
| Treatment | Cytotoxicity (as of % Control) IC50 value mM with 250 nm insulin | ||
| Ile | 23.3 ± 0.8 | NI | NI |
| Leu | 14.7 ± 1.4 | NI | 35.0 ± 5 |
| Val | 41.5 ± 5 | NI | NI |
| BCAAs combination | 12 ± 0.8 | NI | 147.7 ± 16.5 |
| Arg | NI | NI | NI |
Table 3: IC50 values (mM) of in vitro antiproliferative activity of BCAAs on breast cancer cell lines and pancreatic cancer cell line.
Figure 11: In vitro antiproliferative activity of BCAA on MCF7. The result represents the percentage of viable cells after different concentration of BCAA. Results are expressed as mean ± SD (n=3-4 independent replicates) the result were analyzed using one way ANOVA, *: p<0.05, **: p<0.01, ***: p<0.001 compared to Arg as control.
Figure 12: In vitro antiproliferative activity of BCAA on T47D. The result represents the percentage of viable cells after different concentration of BCAA. Results are expressed as mean ± SD (n=3-4 independent replicates) the result were analyzed using one way ANOVA, *: p<0.05, **: p<0.01, ***: p<0.001 compared to Arg as control.
Figure 13:In vitro antiproliferative activity of BCAA on MCF7. The result represents the percentage of viable cells after different concentration of BCAA with 250 nm of insulin. Results are expressed as mean ± SD (n=3-4 independent replicates) the result were analyzed using one way ANOVA, *: p<0.05, **: p<0.01, ***: p<0.001 compared to Arg as control.
Results are mean ± SD (n=3-4 independent replicates). IC50 values (concentration at which 50% inhibition of cell proliferation took place in comparison to non-induced basal 72 hours incubations). NI is noninhibitory.
The effect of BCAAs on the expression of beta catenin, Bax and cyclin D in HCT116, MCF7 and Panc1 cell lines selectively
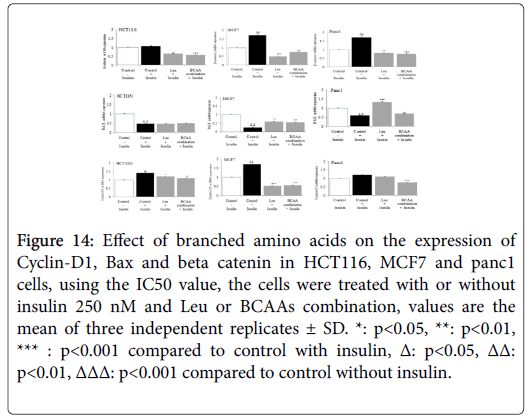
β catenin expression was substantially up regulated by insulin in HCT116, MCF7 and Panc1 cell lines. The IC50 values of Ile, BCAA combination, exerted a significant down regulation of insulin-induced beta catenin expression (Figure 14). In Figure MCF7, demonstrate that while mitogenic insulin could down regulate the expression of antiapoptotic BAX in HCT116, MCF7 or Panc1; Impressively the IC50 values of Leu and BCAA combination, (cotreated with insulin) could up regulate the expression of BAX in MCF7 and Panc1 markedly, but not in HCT116. As insulin up regulated the expression of cyclin D1 in HCT116, MCF7 and Panc1 (Figure 14); the IC50 value of Ile, BCAA combination, co incubated with insulin down regulated cyclin D1 expression substantially in these cancer cell lines.
Figure 14: Effect of branched amino acids on the expression of Cyclin-D1, Bax and beta catenin in HCT116, MCF7 and panc1 cells, using the IC50 value, the cells were treated with or without insulin 250 nM and Leu or BCAAs combination, values are the mean of three independent replicates ± SD. *: p<0.05, **: p<0.01, *** : p<0.001 compared to control with insulin, Δ: p<0.05, ΔΔ: p<0.01, ΔΔΔ: p<0.001 compared to control without insulin.
Discussion
Hyperinsulinemia associated with insulin resistance is one of the common metabolic abnormalities associated with obesity and Diabetes mellitus. Insulin is mitogenic in vitro and can promote tumor growth in experimental animals. Furthermore, some observational studies have reported increased cancer mortality in insulin-treated type 2 diabetes [19-24].
These considerations have given rise to concerns that insulin might promote the development of cancers, and/or be associated with increased mortality [25]. So we evaluated the effects of BCAA on proliferation of different cancer cell lines including: colorectal cancer cell lines HT29, HCT116, SW620, SW480, and CaCO2, breast cancer cell lines; MCF7 and T47D and pancreatic cancer cell line Panc1 as well as fibroblast cell lines under the low insulin concentration and under chronic insulin treatment using SRB assay. Interestingly our findings indicated that BCAA directly suppressed insulin-induced cell proliferations of HCT116, MCF7 and Panc1 cells.
The suppressive effect of BCAA on colorectal, breast and pancreatic cancer growth can be attributed to enhanced apoptosis by antagonizing the anti-apoptotic function of insulin.
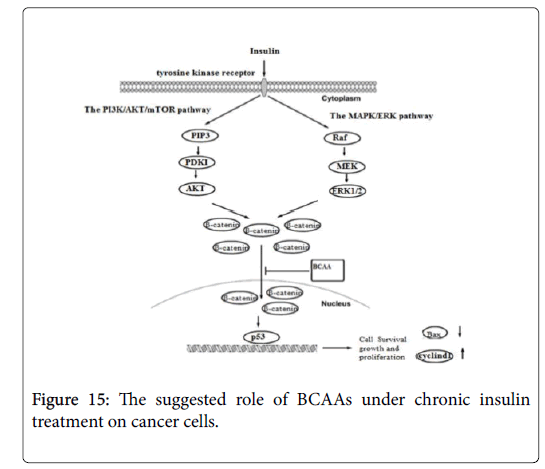
Insulin activates its downstream signaling pathways like PI3K/Akt and MAPK pathways that regulate cell cycle and inhibit apoptosis [26]. Therefore, in order to understand the mechanisms underlying the suppressive effect of BCAA on insulin-induced cancer cell proliferation, we further examined the expression of beta catenin, Bax and Cyclin D genes under chronic insulin treatment. The result shows over expression of Bax gene and down regulation of beta catenin and Cyclin D gene under the influence of BCAA, after chronic exposure to insulin, indicate that inclusion of BCAA in culture medium during chronic insulin treatment on colorectal, breast and pancreatic cancer cells lines could suppress downstream activation of insulin signaling pathways including PI3K/Akt and MAPK pathways (Figure 15) [26]. The combination of PI3K/Akt and/or MAPK/Erk inhibition, by both insulin resistance and inhibiting IGF/IGF-IR axis have been shown to have more prominent effects on tumor growth by inducing negative feedback loop though mTORC1/S6K1 activation and suppressing mTORC2 kinase activity toward Akt [26].
It has been reported that IGF-1 and insulin activates beta catenin to be translocated from cell membrane to cytoplasm, by inhibition of GSK by both Akt and MAPK pathways, thereby protecting-beta catenin from proteosomal degradation [27], thus, inhibition of GSK lead to stabilization and accumulation of beta catenin in cytoplasm which will be shuttled into nucleus and mediate target gene expression [28]. Beta catenin was also found to be involved in cell cycle progression through the G1/S transition and in DNA synthesis by enhancing the expression of Cyclin D [29]. Furthermore, inhibition of GSK promotes apoptosis by enhancing the expression of Proapoptotic genes such as (Bax and Bak) by inducing mitochondrial membrane permeability [30]. In agreement with our result, many clinical and experimental studies have demonstrated that BCAA do not enhance, but instead decrease the tumor incidence [31-33], furthermore studies have also show that BCAA suppresses insulin-induced over activation of PI3K/Akt and exhibits growth inhibitory effects by inducing apoptosis in tumor cell [16,34].
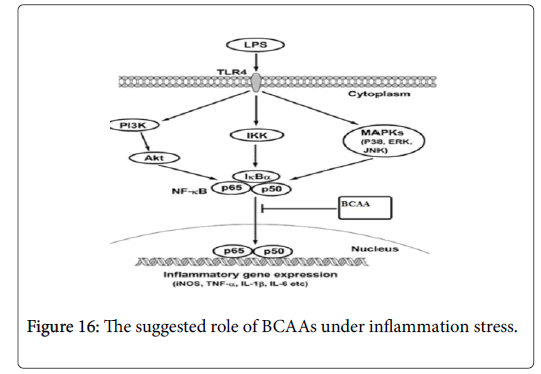
Furthermore, activating the NF-κB have been associated with the expression of genes that allow the cells to proliferate and preventing apoptosis, by affecting the expression of both cyclin D1 and BAX genes [35]. Moreover, in cancer cell NF-κB is consequently activated due to secretion of transcription factor by these cells or by mutation of gene that responsible for NF-κB transcription [36]. So blocking the NF-κB signaling pathway in cancer cells allowing to stop proliferating by reducing the expression of Cyclin D and enhancing pro-apoptotic gene such as BAX [37]. Therefore, in order to determine whether the BCAAs can suppress the NF-κB signaling pathway, we activated NF-κB by stimulating RAW 264.7 cell line by using LPS. The results indicate that LPS can activate NF-κB which allows the NO, TNF alpha and IL1beta to express from these cells (Figure 16). However, under the BCAAs treatment the down regulation of NO, TNF alpha and IL1beta suggested that these amino acid could have therapeutic effect by blocking the NF-κB signaling pathway.
Our finding is in the line with studies that indicate supplementation with BCAA decreases the tumor incidence by inhibiting IGF/IGF-IR axis [34,38,39]. Moreover, demonstrated that oral administration of BCAA significantly reduced the size of preneoplastic lesions in induced hepatocarcinogenic model and showed suppressive effect of BCAA on neovascularization and VEGF expression both in vivo and in vitro experiments possibly via reducing the VEGF expression and suppressing Akt activation [39,40]. However, the suggested novel finding in this study indicate that BCAAs treatment down regulate both PI3K/ Akt and MAPK pathways which was activated by insulin and lower the activation of NF-κB which was activated by LPS to induce apoptosis in different cancer cell lines.
Conclusions
PI3K/Akt, MAPK/ERK and NF-kB signaling pathways controls expression of a number of genes that regulate cell growth and proliferation, survival and apoptosis. In this study we suggest that BCAAs decrease the insulin-induced β-catenin, cyclin D1 levels and upregulate Bax levels, possibly through inhibiting PI3K/Akt, MAPK/ERK pathway and down regulation of NO, TNF alpha and IL1beta probably by inhibiting the NF-κB signaling pathway.
Acknowledgements
We are grateful to all members of School of Pharmacy, University of Jordan for their helpful discussion and technical assistance.
Funding
Publication of this article was funded by University of Jordan.
Availability of Data and Materials
The datasets measured and analyzed during the study are available from the corresponding authors upon reasonable request.
Ethical Approval
This article does not contain any studies with human participants or animals performed by any of the authors.
Informed Consent
All authors listed have contributed to conception, design, gathering, analysis or interpretation of data and have contributed to the writing and intellectual content of the article. All authors gave informed consent to the submission of this manuscript.
References
- Monirujjaman M, Ferdouse A (2014) Metabolic and physiological roles of branched-chain amino acids. Adv Mol Biol: 364976.
- Brosnan JT, Brosnan ME (2006) Branched-chain amino acids: Enzyme and substrate regulation. J Nutr 136: 207S-211S.
- O'connell TM (2013) The complex role of branched chain amino acids in diabetes and cancer. Metabo 3: 931-945.
- Fernstrom JD (2005) Branched-chain amino acids and brain function. J Nutr 135: 1539S-1546S.
- Kainulainen H, Hulmi JJ, Kujala UM (2013) Potential role of branched-chain amino acid catabolism in regulating fat oxidation. Exerc Sport Sci Rev 41: 194-200.
- Kawaguchi T, Nagao Y, Matsuoka H, Ide T, Sata M, et al. (2008) Branched-chain amino acid-enriched supplementation improves insulin resistance in patients with chronic liver disease. Int J Mol Med 22: 105-112.
- Ichikawa K, Okabayashi T, Shima Y, Iiyama T, Takezaki Y, et al. (2012) Branched-chain amino acid-enriched nutrients stimulate antioxidant DNA repair in a rat model of liver injury induced by carbon tetrachloride. Mol Biol Rep 39: 10803-10810.
- Kuwahata M, Kubota H, Kanouchi H, Ito S, Ogawa A, et al. (2012) Supplementation with branched-chain amino acids attenuates hepatic apoptosis in rats with chronic liver disease. Nutr Res 32: 522-529.
- Tajiri K, Shimizu Y (2013) Branched-chain amino acids in liver diseases. World J Gastroenterol 19: 7620–7629.
- Chen T, Ni Y, Ma X, Bao Y, Liu J, et al. (2016) Branched-chain and aromatic amino acid profiles and diabetes risk in Chinese populations. Sci Rep 6: 20594.
- Giesbertz P, Daniel H (2016) Branched-chain amino acids as biomarkers in diabetes. Curr Opin Clin Nutr Metab Care 19: 48-54.
- Jewell JL, Kim YC, Russell RC, Yu FX, Park HW, et al. (2015) Differential regulation of mTORC1 by leucine and glutamine. Science 347: 194-198.
- Lynch CJ, Adams SH (2014) Branched-chain amino acids in metabolic signalling and insulin resistance. Nat Rev Endocrinol 10: 723-736.
- Ghimeray AK, Lee HY, Kim YH, Ryu EK, Chang MS, et al. (2015) Evaluation of antioxidant and anti-inflammatory Effect of Rhododendron brachycarpum extract used in skin care product by in vitro and in vivotest. Technol Invest 6: 105.
- Kasabri V, Afifi FU, Abu-Dahab R, Mhaidat N, Bustanji YK, et al. (2014) In vitro modulation of metabolic syndrome enzymes and proliferation of obesity related-colorectal cancer cell line panel by Salvia species from Jordan. Rev Roum Chim 59, 693-705.
- Hagiwara A, Nishiyama M, Ishizaki S (2012) Branched chain amino acids prevent insulinâ€induced hepatic tumor cell proliferation by inducing apoptosis through mTORC1 and mTORC2 dependent mechanisms. J Cell Physiol 227: 2097-2105.
- Vichai V, Kirtikara K (2006) Sulforhodamine B colorimetric assay for cytotoxicity screening. Nat Protoc 1: 1112-1116.
- Balint K, Xiao M, Pinnix CC, Soma A, Veres I, et al. (2005) Activation of Notch1 signaling is required for β-catenin-mediated human primary melanoma progression. J Clin Invest 115: 3166-3176.
- Berster JM, Göke B (2008) Type 2 diabetes mellitus as risk factor for colorectal cancer. Arch Physiol Biochem 114: 84-98.
- Chung YW, Han DS, Park KH, Eun CS, Yoo KS, et al. (2008) Insulin therapy and colorectal adenoma risk among patients with Type 2 diabetes mellitus: A case-control study in Korea. Dis Colon Rectum 51: 593-597.
- Oba S, Nagata C, Nakamura K, Takatsuka N, Shimizu H, et al. (2008) Self-reported diabetes mellitus and risk of mortality from all causes, cardiovascular disease, and cancer in Takayama: A population-based prospective cohort study in Japan. J Epidemiol 18: 197-203.
- Noto H, Osame K, Sasazuki T, Noda M (2010) Substantially increased risk of cancer in patients with diabetes mellitus: A Systematic review and meta-analysis of epidemiologic evidence in Japan. J Diabetes Complications 24: 345-353.
- Jones S (2011) Cancer Research UK. Trends in Urology & Men's Health 2: 37-37.
- Bella F, Minicozzi P, Giacomin A, Crocetti E, Federico M, et al. (2013) Impact of diabetes on overall and cancer-specific mortality in colorectal cancer patients. J Cancer Res Clin Oncol 139: 1303-1310.
- Uzunlulu M, Caklili OT, Oguz A (2016) Association between metabolic syndrome and cancer. Ann Nutr Metab 68: 173-179.
- Serra V, Markman B, Scaltriti M, Eichhorn PJ, Valero V, et al. (2008) NVP-BEZ235 a dual PI3K/mTOR inhibitor prevents PI3K signaling and inhibits the growth of cancer cells with activating PI3K mutations. Cancer Res 68: 8022-8030.
- Peifer M, Polakis P (2000) Wnt signaling in oncogenesis and embryogenesis: A look outside the nucleus. Science 287: 1606-1609.
- Jacobs KM, Bhave SR, Ferraro DJ, Jaboin JJ, Hallahan DE, et al. (2012) GSK-3: A bifunctional role in cell death pathways. Int J Cell Biol 20: 1-12.
- Diehl JA, Cheng M, Roussel MF, MSherr CJ (1998) Glycogen synthase kinase-3β regulates cyclin D1 proteolysis and subcellular localization. Genes Dev 12: 3499-3511.
- Watcharasit P, Bijur GN, Zmijewski JW, Song L, Zmijewska A, et al. (2002) Direct activating interaction between glycogen synthase kinase-3β and p53 after DNA damage. Proc Natl Acad Sci 99: 7951-7955.
- Marchesini G, Marzocchi R, Noia M, Bianchi G (2005) Branched-chain amino acid supplementation in patients with liver diseases. J Nutr 135: 1596S-1601S.
- Muto Y, Sato S, Watanabe A, Moriwaki H, Suzuki K, et al. (2005) Effects of oral branched-chain amino acid granules on event-free survival in patients with liver cirrhosis. Clin Gastroenterol Hepatol 3: 705-713.
- Wongtangtintharn S, Oku H, Iwasaki H, Inafuku M, Toda T, et al. (2005) Incorporation of branched-chain fatty acid into cellular lipids and caspase-independent apoptosis in human breast cancer cell line, SKBR-3. Lipids Health Dis 4: 29.
- Iwasa J, Shimizu M, Shiraki M, Shirakami Y, Sakai H, et al. (2010) Dietary supplementation with branched chain amino acids suppresses diethylnitrosamine induced liver tumorigenesis in obese and diabetic C57BL/KsJdb/db mice. Cancer Sci 101: 460-467.
- Nelson DE, Ihekwaba AEC, Elliott M, Johnson JR, Gibney CA, et al. (2004) Oscillations in NF-κB signaling control the dynamics of gene expression. Science 306:704-708.
- Guttridge DC, Albanese C, Reuther JY, Pestell RG, Baldwin AS, et al.(1999) NF-κB controls cell growth and differentiation through transcriptional regulation of cyclin d1. Mol Cell Biol 19: 5785-5799.
- Karin M, Lin A (2002) Nf-[κ]b at the crossroads of life and death. Nat Immunol 3: 221-227.
- Shimizu M, Shirakami Y, Iwasa J, Shiraki M, Yasuda Y, et al.( 2009) Supplementation with branched-chain amino acids inhibits azoxymethane-induced colonic preneoplastic lesions in male C57BL/KsJ-db/db mice. Clin Cancer Res 15: 3068-3075.
- Yoshiji H, Noguchi R, Kitade M, Kaji K, Ikenaka Y, et al. (2009) Branched-chain amino acids suppress insulin-resistance-based hepatocarcinogenesis in obese diabetic rats. J Gastroenterol 44: 483-491.
- Meric JD, Kisic MB, Filipovic-Danic S, Grabic R, Dragojevic I, et al. (2016) Xanthine Oxidase activity in type 2 Diabetes mellitus patients with and without diabetic peripheral neuropathy. J Diabetes Res 2016: 4370490.
Citation: Alqaraleh M, Kasabri V, Mashallah S (2018) Evaluation of Anticancer and Anti-Inflammatory Properties of Branched-Chain Amino Acids. J Biochem Cell Biol 1: 108.
Copyright: © 2018 Alqaraleh M, et al. This is an open-access article distributed under the terms of the Creative Commons Attribution License, which permits unrestricted use, distribution, and reproduction in any medium, provided the original author and source are credited.
Share This Article
Recommended Journals
Open Access Journals
Article Usage
- Total views: 6003
- [From(publication date): 0-2018 - Apr 27, 2025]
- Breakdown by view type
- HTML page views: 4945
- PDF downloads: 1058
