Enhancing the Spatial Variability of Soil Salinity Indicators by Remote Sensing Indices and Geo-Statistical Approach
Received: 11-Dec-2017 / Accepted Date: 04-Apr-2018 / Published Date: 10-Apr-2018 DOI: 10.4172/2157-7617.1000462
Abstract
Soil salinization is considered limiting factor for crop production and land management for dry land in Sudan, its spatial variation is affected by different factors of soil properties, vegetation and environment hence its interaction formulate the planning for successful sustainable agriculture in salt affected soils. This study aims to evolve the spatial prediction of soil salinity indicators by integrated remote sensing indices and geo-statistical cokriging model. Soil samples were collected from 476 square kilometer area in salt affected area, the samples were analyzed following standard procedures for electrical conductivity, sodium adsorption ratio, hydrogen ions and saturation percentage. Information of vegetation status identified by Normalized Difference Vegetation Index (NDVI) and soil salinization by Salinity index and brightness index were used and utilized for prediction of the soil parameters variability by cokriging model. It was found that the method was resulted in high accuracy based on RMSE and enhances the soil spatial variability assessment and provides significant interaction of different variables and indices in the landscape.
Keywords: Soil salinization; Spatial prediction; Cokriging; NDVI; Salinity index; Brightness index
Introduction
Soil salinity is refer to the soluble and readily dissolvable salts in the soil or, operationally, in an aqueous extract of a soil sample and. have an electrical conductivity (EC) of the saturation soil-paste extract of more than 4 dS/m at 25°C as per USDA-ARS [1] it tend to occur in all climatic conditions most in low rainfall environments that restrict leaching of salts and accumulate the salts in the soil mainly in the forms of chloride and sulphate.
Soil salinity arises naturally in subsoil (primary salinization) or as human induced (secondary salinization). In irrigated lands, it was estimated that 20% (45 million ha) of irrigated land, producing onethird of the world’s food, is salt-affected [2]. The amount of world agricultural land destroyed by salt accumulation each year is estimated to be 10 million ha [3]. Salts affect plant growth due to two processes, increasing soil osmotic pressure that reduces the ability of plants to acquire solutes by inducing both the inhibition in uptake of essential elements such as K+, Ca2+, and NO3- and the accumulation of Na+ and Cl-. Moreover, salt stress reduces plant growth due to specific-ion toxicities and nutritional imbalances [4]. Salinity affects photosynthesis by decreasing CO2 availability as a result of diffusion limitations [5] reducing chlorophyll content that could be attributed to reduce expansion of leaf area and hence to a reduction of light interception d in stomata conductance [6]. Salt affect negatively the plant biomass, width and length of leaves and growth [7].
Spatial variability of soil salinity essentially considered for effective management and reclamation in different environment that considering spatial dimensions of soil properties and its interaction with different factors determined the level of landscape salinity. There are many factors influence the spatial variations of soils properties [8] which are the landscape position, climate factors particularly rainfall, temperature and soil properties in addition to human interference included type of agricultural practices. Due to lack of intensive sampling geo-statistical models were used to improve the soil qualitative analysis in the absence of detailed, high cost soil maps [9]. Recent researches reported the importance of spatial distribution of soil properties and their interaction that influence its quality and stability to degradation hazards, geo-statistical analysis is enhance the spatial prediction and interpolation of soil variable becoming essential for producing continuous maps of salinity and alkalinity providing the ability to assess the risk and hazards of salt distribution [10].
Deterministic and stochastic data modeling approaches are commonly used in characterization of soil properties, however stochastic approach tend to be used in conjunction with calibrated equation like geostatistical models and spatially referenced regression models that soil properties and surface parameters are referred to, therefore they are the only models that can be achieved with limited number of soil samples (n< 15) used when intensive soil sampling is lacking [11].
When two data sets were acquired representing different variables it is recommended to apply cokriging method. The most common situation is when the primary variable was collected sparsely (due to high cost, time consumption or environmental protection) whereas secondary (auxiliary) variable was sampled densely or even excessively. These variables do not need to be strongly associated, only requirement is any correlation [12].
Co-kriging involve fully sample situation where all variables determined and used for prediction by utilizing all information available in the landscape and restricting use of properties at specific locations of variable that improve prediction of targeted variable by its correlate with most intensive and fully sampled variables [10,13].
Remote sensing appears to offer several advantages over the conventional ground methods used to map and monitor soil salinity, it is timely, faster than ground methods and provides better spatial coverage that repeatedly been used as a promising tool to obtain information regarding soil properties and land degradation processes and used as input into a geographic information system (GIS) for further analysis and comparison to other data [14,15]. Soil salinity can be mapped using remote sensing both directly, by reflectance from bare soil, or from the salt crust, and indirectly from vegetative coverage and health. In order to achieve quantitative analysis for crop status and growth development, remote-sensing-based indices provide information by means of vegetation indices, they were widespread used and considered as unique source of information that identify crops conditions and types at different regions [16,17] and reported significantly correlated with some soil attributes [13].
Several methods of remote sensing techniques resulted high seperability among salt- and sodium-affected soil classes as reported by Mohamed and Mohamed & Castaneda and Herrero [18] and Metternicht and Zinck [19-21]. Maximum reflectance of salt affected soils was observed in the range of 10.5 -12.5 µm and minimum reflectance in the range of 0.76 - 0.90 µm with the help of maximum and minimum reflectance value bands. Matternicht and Zink found that salt has high spectral reflectance in the visible window particularly in the blue band. Soil salinity indices were used for the analysis of soil properties the relative maximum differences values bands were selected for developing the salinity index, due to high reflectance of salt affected soils in visible spectrum it enhance the bare soil reflectance, its application was found to be useful in determine mainly salt affected soils, enhance spectral patterns of saline soil [22,23] considerable correlation found when salinity indices used for prediction the spatial distribution for salt affected soils.
Recent satellite images (landsat 8) has repeatable spatial coverage, high spectral and radiometric resolution could provide great potentials for researches in soil and crop variability that support integration of geographic information system by means of geostatistical analysis to fill gap in soil information, so the aim of this research is to investigate the spatial variability of soil salinity status by integrating remote sensing indices for salinity (brightness index and salinity index) and vegetation (NDVI) with geostatistical co-kriging model to enhance the prediction of soil properties at detailed level as operational use of both techniques in soil managements, conservation and vegetation growth.
Study Area
The site is located in White Nile state –Sudan (32.6-32.4 N and 15.05-15.3 E) with an area of 476 km2 (Figure 1), the area is characterized by arid climatic zone, the mean annual temperature is 42°C and the mean annual precipitation is 121 mm falling mainly in July and August with lower amounts in September, the annual potential evapotranspiration is 2065 mm and the annual water deficit is about 1944 mm. Evapotranspiration exceeds rainfall in almost all months of the year except in few days during the rainy season. Topography of the study area is generally flat range from 390 to 380 m sloping towards the White Nile, with some sand dunes towards White Nile. The soil texture is sandy clay loam in the surface. Aridisols and Entisols soil orders were found. Herbs and trees represent an ecological interaction which exactly reflect and indicate the soil type (salinity/sodicity), level of fertility and moisture conditions. This is evident by the abundant occurrence of Chloris virgata and Cassia acutifolia. Both are renowned as salinity tolerant species.
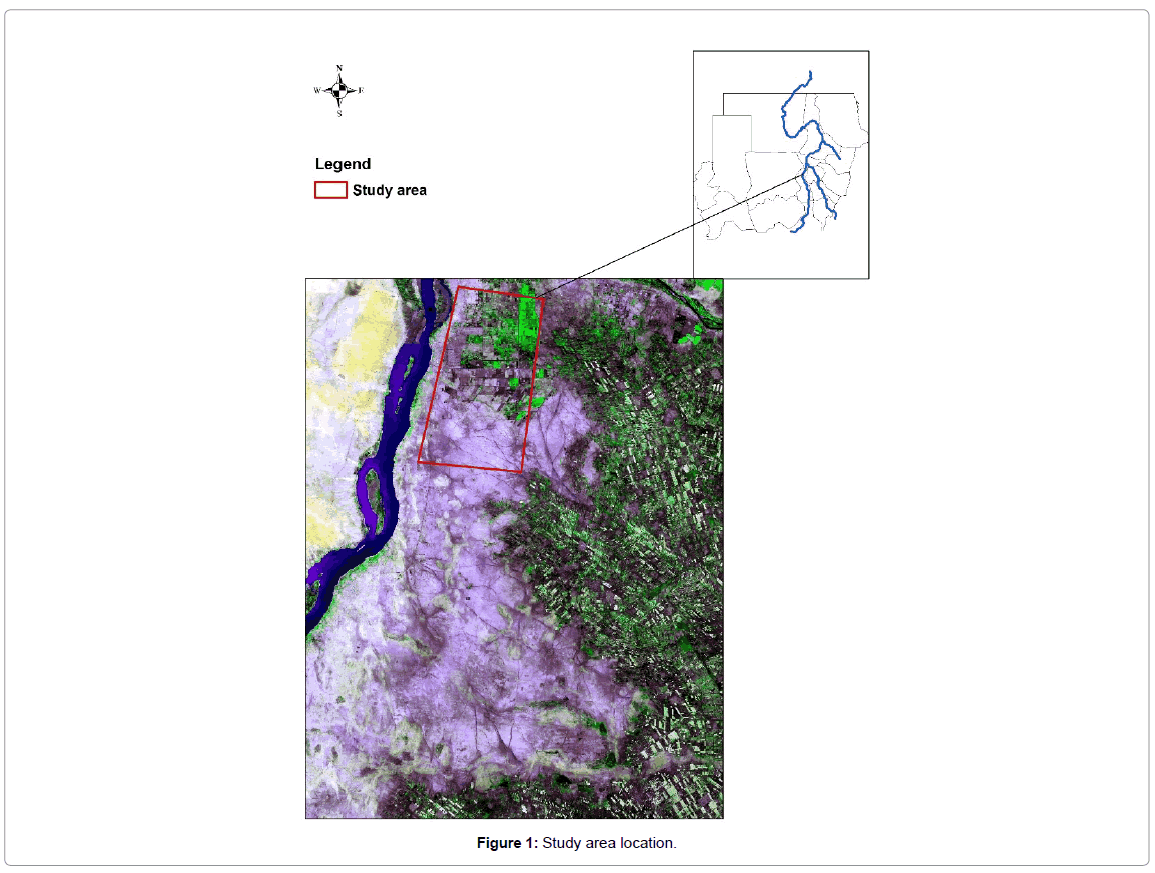
Figure 1: Study area location.
Research Methodology
Satellite image processing
Landsat8 image 2016 – November was used, enhanced for image interpretations that help in identify the soil sampling points. Red band and near infrared band were used to detect Normalized Difference Vegetation Index (NDVI) as follow NDVI=RD-NIR/RD+NIR. The NDVI values were varies between -1 and +1, then it was classified into five classes according to its values. Negative values usually represent water bodies, low positive values were bare soils, sands and rocks (0.1 and below). Moderate values represent herbs and shrubs (0.2- 0.3). Dense vegetation tends to have NDVI values more than 0.3.
Soil salinity indices have been widely acknowledged as powerful tools in identifying features of interest which are related to spectral patterns of saline soil. Two indices were used:
Salinity index (SI) = vBLUE × RED,
Brightness index (BI) = v (RED2+NIR2)
Soil sampling
Designed based soil sampling was used, 19 sampling points were selected to represent all image features and their sites were predetermined using GPS. Soil sampling was taken at two depths (0-20 cm and 20-40 cm) soil samples at depth of 0-20 cm were used in this study. Physical and chemical properties namely, Soil reaction (pH), Electrical conductivity (ECe), saturation percentage (SP), calcium carbonates (CaCO3), sodium adsorption ratio (SAR) and soil mechanical analysis were determined according to the procedure of the methods of soil analysis [24,25].
Spatial variability of soil properties
Integrated approach of remote sensing which is considered as efficient tool for providing intensive information in spatial domain and GIS was adopted using co-kriging model to derive the prediction of soil attribute by interrelations with Salinity index, Brightness index and Normalized Difference Vegetation Index. Various combinations of the soil variables and indices resulted in prediction of soil salinity indicators over the entire study area significant of the resulted prediction was made by RMSE.
Results
Remote sensing indices
NDVI for the study area was produced as Figure 2 the study area generally represent low NDVI, it classified according to its values, negative values represent water bodies (river and irrigation channels), bare soils included sands and salt affected represent low values reached 0.03 – 0.09 most of vegetation represent very low NDVI values (009 – 0.13) indicated lower vigor and growth and other areas represent also low values (0.13 – 0.2), this attributed to soil salinity distribution that limit the crop development.
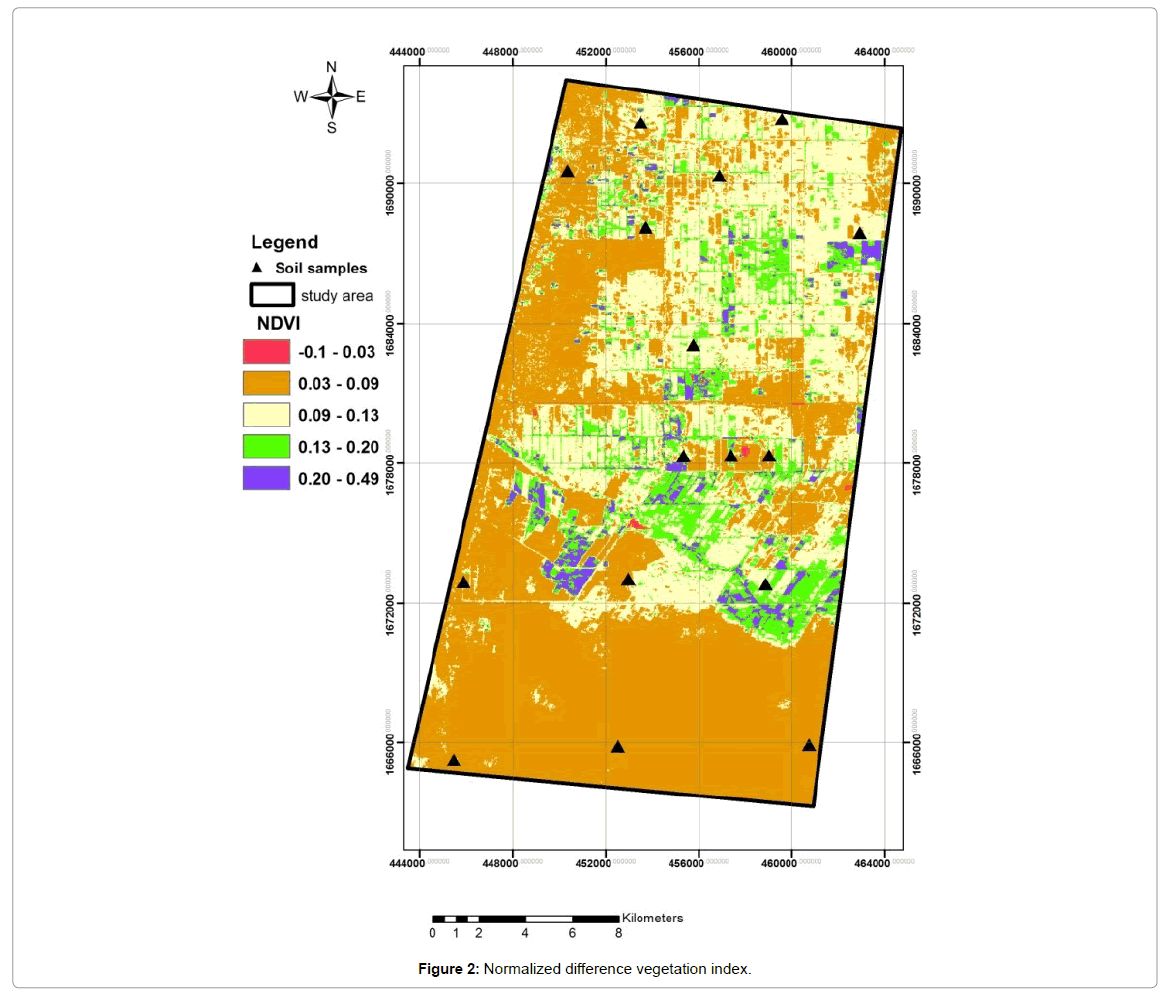
Figure 2: Normalized difference vegetation index.
Brightness index
This index values indicate the presence of salt affected areas (Figure 3), the study area presented higher values in the southern side where bare areas that contains high salts and high sand percentage. It is known that salinization and desertification are coincide processes in dry lands [26].

Figure 3: Brightness index.
Salinity index
High salinity levels dominated the study area (Figure 4), strongly salt affected soil represent higher reflection than do moderate salt affected soils, especially when bare soils compared with vegetated soils. This index showed that different degrees of salinity and sodicity are detectable and characterizing intensively saline and sodic soils.
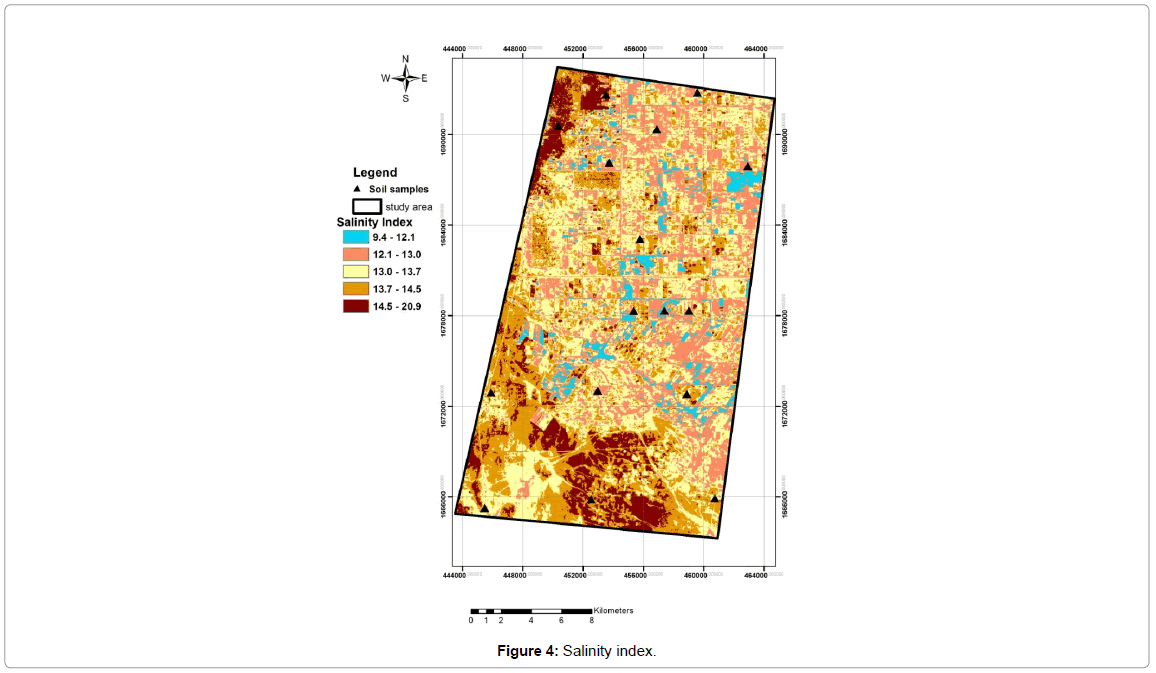
Figure 4: Salinity index.
Spatial variability
Prediction of soil salinity indicators, electrolyte concentration, sodium adsorption ratio and saturation percentage and soil reaction were performed using cokriging model and validated using root men square error (RMSE) for all methods (Table 1). Enhancement of the prediction at the finer level was found due to interrelation of soil variables with salinity and vegetation indices and using of all indices information as agreed with findings of Odeh et al. [13].
| Variables | RMS | AvStE | RMSE |
|---|---|---|---|
| SAR and SI | 12.87 | 12.61 | 0.96 |
| SAR and BI | 12.2 | 13.4 | 0.88 |
| SAR and NDVI | 11.6 | 12.5 | 0.91 |
| Ph and NDVI | 1.8 | 0.2 | 0.85 |
| Ph and SI | 0.2 | 0.19 | 0.91 |
| Ph and BI | 5.0 | 4.8 | 1.07 |
| EC and SI | 5.2 | 4.5 | 1.1 |
| EC and NDVI | 3.7 | 4.6 | 0.74 |
| EC and BI | 5.0 | 4.8 | 1.07 |
| SP and SI | 6.0 | 5.9 | 1.0 |
| SP and BI | 7.5 | 5.1 | 1.5 |
| SP and NDVI | 6.0 | 4.6 | 1.3 |
Table 1: Cokriging model accuracy assessment.
The comparison of cokriging model accuracy is based on low RMSE or near to 1 also based on relation of root mean square and average standard error if it equal or near to each other. The maps of predicted SAR collocated with, SI, BI and NDVI using cokriging performed significant results for prediction SAR that logically in the same trend of salinity indices and NDVI, thus showed lower saline effect in the middle of studied area (Figure 5). The performance of three combinations was evaluated by comparing root mean square of prediction error (Table 1), the higher prediction found for SAR when collocated by SI, NDVI and BI respectively (Figure 6).
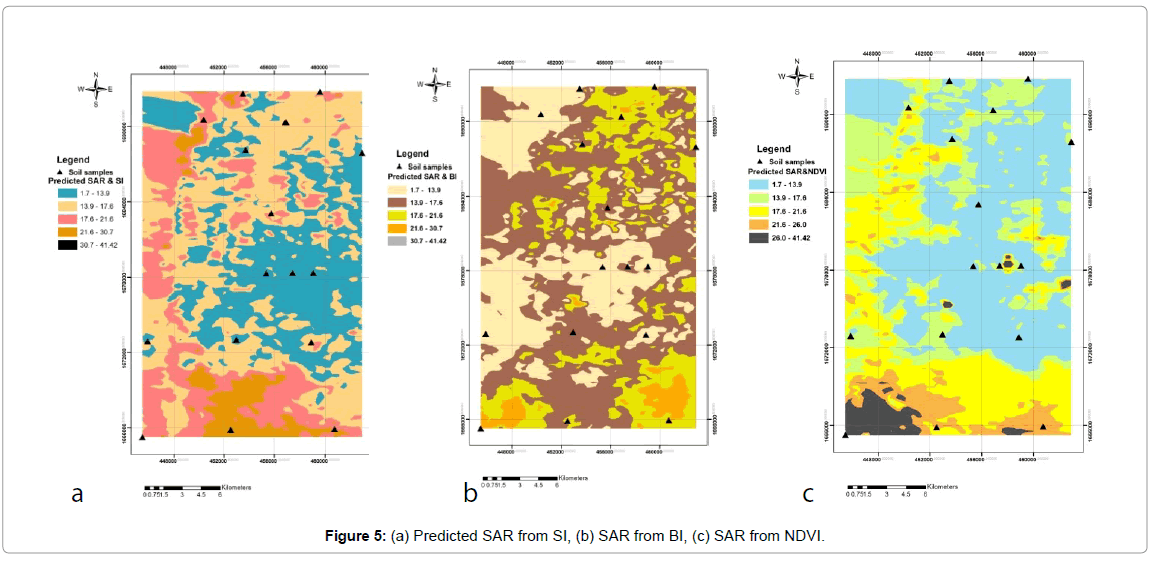
Figure 5: (a) Predicted SAR from SI, (b) SAR from BI, (c) SAR from NDVI.

Figure 6: (a) Predicted ECE from SI, (b) ECE from BI, (c) ECE from NDVI.
From Table 1, it is clearly that all the variable fitted the model and the model able to explain all of the studied area so the prediction from the model considered highly efficient for prediction of soil salinity indicators ranged from 100% to 74% and High spatial correlation of ECe as soil variable with the salinity indices SI and BI was found on the other hand NDVI represent lower RMSE due to the interaction of plant and soil properties. Generally, the cokriging method improve the prediction of salinity variables and clearly present that higher soil salinity variables (EC >4 and ESP >15) were found in southwest of studied area that occupied by sand dunes which could be more saline than other areas. On the other hand, predicted SAR and EC that collocated with NDVI showed lower RMSE values which indicated the effect of sodicity and salinity on plant growth. Distributed patches of EC and SAR when predicted with other indices required attention to soil properties affected adversely by sodicity and salinity and its effect on soil management.
Conclusion
This study examines the spatial variability of soil salinity indicators applying the vegetation index and salinity indices derived from remote sensing techniques as secondary information layer in cokriging model, evolving the prediction details of soil salinization indicators maps at field scale and highly significant explain the variability in soil salinity indicators in salt affected area. This work indicates the potentiality of cokriging for predicting fine details in high accuracy manner, reducing the cost and sampling for saline soils detection and hazards mapping, established evidenced relation of soil salinity prediction by incorporating remote sensing indices. Further studies need to be done on secondary variables that could be suitable for predicting salinity and sodicity variables and the choices of increasing accuracy regarding soil sampling distribution in the space.
References
- USDA-ARS (2008) Research databases. Â In: Bibliography on salt tolerance, G.E. Brown Jr. (ed), United States Department of Agriculture Agricultural Research Service, Riverside, CA, USA.
- Shrivastava P, Kumar R (2015) Soil salinity: A serious environmental issue and plant growth promoting bacteria as one of the tools for its alleviation. Saudi J Biol Sci 22: 123-131
- Pimentel D, Berger B, Filiberto D, Newton M, Wolfe B, et al. (2004) Water resources: Agricultural and environmental issues. BioScience 54: 909–918
- Paranychianakis NV, Chartzoulakis KS (2005) Irrigation of Mediterranean crops with saline water: From physiology to management practices. Agric Ecosyst Environ 106: 171–187
- Flexas J, Diaz-Espejo A, Galmés J, Kaldenhoff R, Medrano H, et al. (2007) Rapid variations of mesophyll conductance in response to changes in CO2 concentration around leaves. Plant Cell Environ 30: 1284–1298
- Yeo AR (2007) Salinity. In: Plant solute transport. Flowers T.J. (Ed); Blackwell: Oxford, UK. pp. 340–365.
- De Pascale, S, Maggio A, Orsini F, Stanghellini C, Heuvelink E (2105) Growth response and radiation use efficiency in tomato exposed to short-term and long-term salinized soils. Sci Hortic 189: 139–149
- Vieira SR, Gonzalez AP (2003) Analysis of spatial variability of crop yield and soil properties in small agricultural plots. Braganita 62: 1
- McKneize NJ, Gessler PE, Ryan PJ, O’Connell DA (2000) The role of terrain analysis in soil mapping. In J. P. Wilson, and J. C. Gallant (Ed), Terrain analysis: Principles and application. John Wiley & sons, New York, USA.
- Odeh OA, Onus A (2008) Spatial analysis of soil salinity and soil structural stability in a semi-arid region of New South Wales, Australia. Environ Mang 42: 265-278
- Corwin DL, Lesch SM (2005) Characterizing soil spatial variability with apparent soil electrical conductivity. Computers and Electronics in Agriculture 46: 103–133
- Webster O (2007) Geostatistics for environmental scientist. (2nd edn) John Wiley and sons, Ltd
- Odeh OA, McBratney AB, Chittleborough DJ (1995) Further results on prediction of soil properties from terrain attribute: heterotopic cokriging and regression kriging. Geoderma 67: 215-226
- Dehaan RL, Taylor GR (2002) Field-derived spectra of salinized soils and vegetation as indicators of salinization. Remote Sensing of Environment 10: 406-417
- Dutkiewicz A, Lewisa L, Ostendorf B (2006) Mapping surface symptoms of dry land salinity with hyperspectral imagery. In International archives of the Photogrammetry, Remote Sensing and Spatial Information Sciences. 34, Part 3, From Pixels to Processes", Enschede, The Netherlands.
- Azar R, Villa P, Stroppiana D, Crema A, Boschetti M, et al. (2016) Assessing in-season crop classification performance using satellite data: a test case in Northern Italy. European Journal of Remote Sensing 49: 361-380
- Villa P, Bresciani M, Braga F, Bolpagni R (2014) Comparative assessment of broadband vegetation Indices over aquatic vegetation. IEEE Journal of Selected Topics in Applied Earth Observations and Remote Sensing 7: 3117-3127
- Castaneda C, Herrero J (2005) Landsat monitoring of playa-lakes in Spanish Monegro desert. J Ari Envi 63: 497-516
- Metternicht GI, Zinck JI (2003) Remote sensing of soil salinity: Potentials and constrains. Rem Sens of environ 85: 1-20
- Metternicht GI, Zinck JI (1997) Spatial discrimination of salt and sodium–affected soil surfaces. International journal of remote sensing 18: 2571-2586
- Mohamed SB, Mohamed, BA (2017) Spectral unmixing analysis to monitor soil salinity using Landsat imagery for White Nile state Sudan. Malaysian Journal of Remote Sensing & GIS 6: 17-26.
- Koshal KA (2010) Indices based salinity areas detection through remote sensing and GIS in parts of South West Punjab. 13th Annual International Conference and Exhibition on Geospatial Information Technology and Application. Gurgaon, India.
- Khan NM, Victor VR, Sato Y, Shiozawa S (2005) Assessment of hydrosaline land degradation by using a simple approach of remote sensing indicators. Agricultural Water Management 77: 96–109
- Klute A, Campbell GS, Jackson RD, Nielsen DR (1986) Methods of soil analysis, Part 1: Physical properties (2nd edn), Madison, Wisconson, USA.
- Page AL, Keeny DR, Baker DE, Miller RH, Rosocoe EJ, et al. (1982) Methods of soil analysis, Part 2: chemical properties (2nd edn), Madison, Wisconson, USA.
- Mustafa MA (2007) Desertification processes. UNESCO chair of desertification, University of Khartoum 7: 134-137.
Citation: Babiker S, Abulgasim E, Hamid HS (2018) Enhancing the Spatial Variability of Soil Salinity Indicators by Remote Sensing Indices and Geo-Statistical Approach. J Earth Sci Clim Change 9: 462. DOI: 10.4172/2157-7617.1000462
Copyright: © 2018 Babiker S, et al. This is an open-access article distributed under the terms of the Creative Commons Attribution License, which permits unrestricted use, distribution, and reproduction in any medium, provided the original author and source are credited.
Select your language of interest to view the total content in your interested language
Share This Article
Recommended Journals
Open Access Journals
Article Tools
Article Usage
- Total views: 5853
- [From(publication date): 0-2018 - Oct 03, 2025]
- Breakdown by view type
- HTML page views: 4754
- PDF downloads: 1099