Energy Performance Analysis of University Buildings: Case Studies at Sheffield University, UK
Received: 15-May-2014 / Accepted Date: 29-May-2014 / Published Date: 05-Jun-2014 DOI: 10.4172/2168-9717.1000129
Abstract
University energy consumption is becoming increasingly important both financially and environmentally. Indeed, government grant allocation now directly relates to environmental performance and it is essential that university spending on energy is reduced, without reducing the useful output or services offered by a well-regarded educational establishment, such as the University of Sheffield. Over the last four years, the University’s Estates and Facilities Management have collected energy data from a selection of five buildings: Crookesmoor Building, Humanities Research Institute, Northgate House, Graduate Research Centre and Regent Court. In this study, the five university buildings’ energy data is compiled and analysed in relation to energy benchmarks. Additionally, time-series analysis, building specification surveys, and comprehensive building classification were carried out. Finally, recommendations were made in terms of the buildings that offer most potential for improved energy savings in the near future. The findings indicated that, aside from a few exceptions, the buildings perform poorly in terms of gas consumption, whereas electricity consumption is generally acceptable. Moreover, gas consumption could be most significantly reduced, although improved heating management could be applied to all buildings. Electricity consumption is generally more acceptable, although scope for improvement remains, particularly in buildings with extensive IT facilities.
Keywords: Buildings; Sheffield university; Energy performances; Crookesmoor building
74832Introduction
With energy performance, and thus carbon emissions, becoming increasingly important both from a financial and an environmental point of view, it is essential that the University of Sheffield (UoS) does its upmost to ensure its buildings perform efficiently. Not only does this reduce university energy spending in uncertain economic times for the higher education sector, it also improves the green performance of the university, which is directly linked to governmental grant allocation [1], and helps the UK to reach targets for future CO2 reductions. Altan identified major barriers for energy efficiency interventions in previous studies in higher education sector and pointed out that there is lack of methodology, non-clarity of energy demand and consumption issues, and therefore conducting further studies involving building level analysis are essential for understanding and benchmarking of energy performance standards of university buildings [2].
This study is a joint-venture between the UoS’s Building Environments Analysis Unit (BEAU) research centre and Estates and Facilities Management (EFM) in Sheffield, UK. In this study, five university buildings are analysed in terms of their electricity, gas and water performance in comparison to the existing benchmarks specified by the UK’s Chartered Institution of Building Services Engineers (CIBSE). The main aim is to conduct a detailed analysis of the energy performance of five university buildings, in order to identify buildings that offer significant hope for improvements. The main objectives of the study are as follows:
• Collect quantitative energy data for chosen buildings from EFM.
• Use surveys to classify the buildings in terms of their function(s), and calculate a benchmark on which the buildings’ performance can be measured.
• Compare building performance in order to identify where significant improvements can be made.
• Carry out a Building Energy Assessment of each building to allow detailed analysis of the reasons behind observed energy performance in the future.
Energy Benchmarking
Energy benchmarks are a widely-used method of comparing a building’s energy performance to similar buildings of that type or function [3-5], in terms of annual energy use per unit area. For example, by comparing the energy consumption of an office building to that of other office buildings, it is possible to draw conclusions regarding how the building in question is performing. In general, benchmarks use benchmark categories, for example, “Good Practice” and “Typical Practice” to provide an average consumption figure, as well as a wellperforming consumption figure, generally indicative of a modern purpose-built building [6].
Conducting energy benchmarking requires a database holding the energy performance of a significant number of buildings, categorised by type and size. Benchmarking also needs information on the building in question, such as energy meter readings, floor space, and typical use. This allows a comparative analysis to be carried out, which in turn allows identification of potential improvements. In this study, most of the information related to all five case study buildings (CSBs) was collected using BEAU’s “Building Energy Assessment” methodology developed for non-domestic buildings [7]. The method used contains data information sheet including technical specifications on building envelope and services as well as end-user and building operation related data from walk round surveying. In more detail, the following information has been gathered through this building energy assessment survey:
• General building information and utility meter data;
• Construction details and U-values;
• Lighting and appliances;
• HVAC system in use;
• On-site renewables, low and zero carbon technologies in use;
• Building occupancy profile and schedules;
• HVAC system operation schedules;
• Other relevant information, e.g. photos, and additional comments from walk round surveys.
However, collating a representative database of buildings is challenging and technically complex, therefore only a few nations have undertaken this task [6]. Additionally, occupancy profiles and occupant behaviour may impact significantly upon how a building performs, for example, factors such as thermostat set points, ventilation and lighting controls, and hot water demand are all likely to influence energy performance, yet are extremely difficult to include in a benchmarking analysis [8]. Similarly, the confinement of buildings into a single function is potentially incorrect. Herein lies a fundamental flaw in many benchmarking approaches; a building may be defined as “university campus” but in fact it shares the functions of office buildings, IT facilities, scientific laboratories, and restaurants. Several benchmarking publications promote the use of “mixed-use” buildings allowing, for example, “general office” to be combined with “restaurant”, and producing a benchmark representative of their equivalent floor space [9]. This may indeed be sufficient for many buildings, however, there remain buildings of such varied use that the use of traditional benchmarks is inherently inaccurate, due to the assumptions are made.
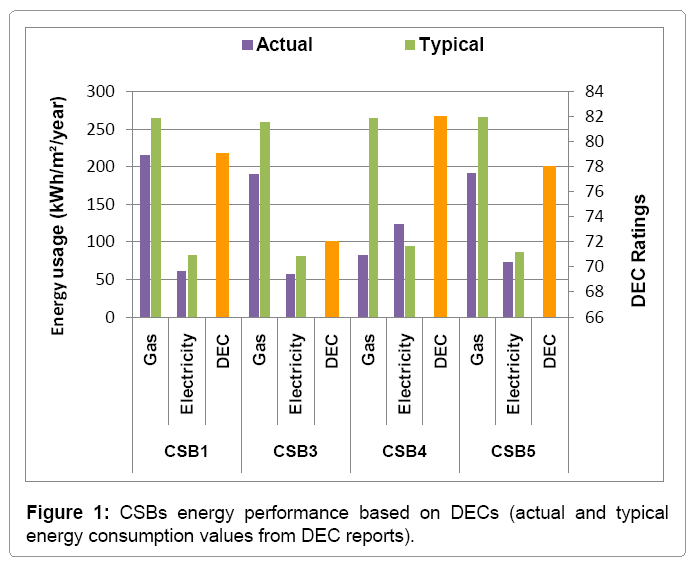
Display Energy Certificates (DECs) exemplify where benchmark analysis require careful implementation. DECs are required for all public buildings over 1000 m2, including four of the five buildings in this study (Table 1). These DECs were collected as part of this project and the following figure is a comparison of all case study buildings (CSBs) except the CSB2 that has a floor area less than the limit of 1000 m2 for public buildings and which is why it was not included (Figure 1).
| Crookesmoor Building CSB1 | Humanities Research Institute (HRI) CSB2 | Graduate Research Centre CSB3 | Regents Court CSB4 | Northgate House CSB5 | |
|---|---|---|---|---|---|
| Built Year | 1970s | Refurbished in 2006 | - | 1993 | Refurbished in 1996 |
| Floor Area (m2) | 5317 | 644 | 1147 | 9031 | 1326 |
| Walls | Solid wall | Solid wall | Solid wall | Cavity wall | Solid wall |
| Windows | Single glazing | Single glazing | Double and single glazing | Double glazing | Double glazing |
| Floor | Concrete | Concrete | Concrete | Concrete | Concrete |
| Heating | Gas boiler with radiators | Gas boiler with radiators | Gas boiler with radiator | Gas boiler with radiator | Gas boiler with radiator |
| Cooling | Natural ventilation | Mixed-mode ventilation | Natural ventilation | Mixed ventilation | Mixed ventilation |
| Department/ Purpose | Empty, previously Architecture | Research space, conference and seminar rooms | Research space and seminar rooms | Computer Science | Archaeology |
Table 1: Buildings assessed in this study (CSBs).
All four CSBs have much better gas and electricity consumption than for their national typical kind of buildings except that electricity consumption is much higher in the CBS4. The DEC ratings are very sensitive about carbon emissions because of the DEC calculation method used, which is based on a comparison between investigated building’s carbon emissions with national benchmark carbon dioxide emissions. This projects that using more electricity in a building means a worse influence on its DEC (Figure 1, CBS4); in this case, due to high electricity consumption this building emitted more carbon dioxide than what was emitted due to gas consumption. Therefore, to have a better DEC rating, reducing electricity consumption is always a better improvement than trying to improve gas consumption.
The DECs employed a very simplistic, one-dimensional classification system that used the same “university campus” benchmark for all buildings, despite the very different properties of the buildings, as will be illustrated in the following section. This means that the benchmarks on which DEC comparisons are made, simply account for floor space, regardless of the building. This reflects that energy use in buildings is not being taken particularly seriously, an area that needs prompt attention (Figure 1 and Table 1).
However, although benchmarking of energy performance is not without its faults, by careful implementation and by taking into account its drawbacks, it is nonetheless a useful tool [10]. This study will use existing benchmarks to classify buildings into their appropriate function. For example, rather than using “university campus” as an overruling benchmark, each building will be surveyed and divided into their severable uses, before comparing energy performance.
Building Characteristics and Categorisation
The following UoS buildings are to be included in this study. They have been chosen because of their expected potential to significantly improve energy performance as well as that they are dissimilar in terms of their size, use and categorisation. Additionally, the Crookesmoor building (CSB1) was refurbished between April 2012 and October 2013, potentially offering immediate implementation of design change recommendations that are born out of these studies. This section will introduce each building before explaining how the buildings were categorised.
Crookesmoor building (CSB1)
The CSB1 was originally constructed in the 1970s, for use by the Schools of Law and Management, however, it has most recently been used by the School of Architecture. Most recently refurbished in 2006, the building provides lecture theatres, IT facilities, staff office space, study rooms, and library space to a large number of students and staff, until it was closed for an internal and external refurbishment in December 2011. Details of the refurbishment can be found at [http://www.government-online.net/refurbishment-of-the-crookesmoorbuilding/]. The building is open from 7 am-10 pm (Monday-Thursday), 7 am-9 pm (Friday), and 8 am-1.30 pm (Saturday), although restricted out-of-hours access is available, as is the case for all buildings in this project.
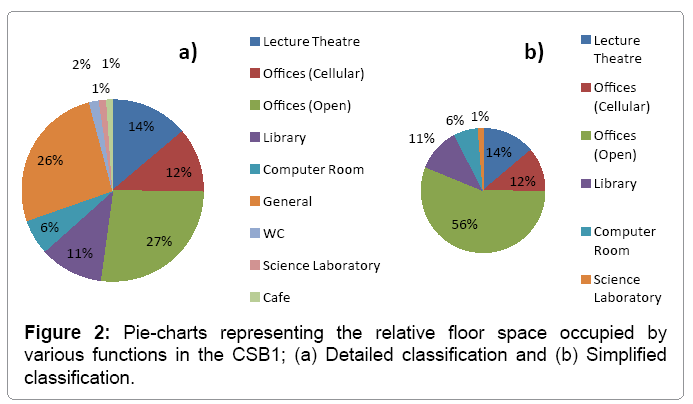
In order to evaluate how the CSB1 performs in terms of energy, it is necessary to classify the building into its primary uses. A building survey was conducted to classify the building into the following uses, with the floor space of each room taken from the floor plans to identify the proportion of the building occupied by each function:
– Lecture Theatre; also includes seminar rooms, common rooms, conference room
– Offices (Cellular, naturally ventilated)
– Offices (Open, naturally ventilated); also includes study rooms, studios
– Library
– Computer Room
– General Space; includes storage rooms, corridors, stairwells, lobby space
– Facilities; includes WCs, Showers, Kitchens
– Laboratory
– Cafe
These categories were used for all the buildings in this study, although not all were needed in each case. The CSB1 resulted in the usage classification in Figure 2a. This classification can now be used to create a benchmark for the energy the building ‘should’ be using based on its use. However, benchmark data was not available for the categories used in the classification. This does not make the classification in Figure 2a redundant, however, since it is useful in the next part of the study to know a detailed breakdown of the building use. To implement building use into categories for which benchmarks exist, it was simplified into just six categories, shown in Figure 2b.
Such simplification again makes assumptions regarding the accuracy of the benchmarks, but consideration was given to each of the assumptions made, in order to make them as reliable as possible. For example, the ‘general’ floor space was added to the ‘open office’ benchmark floor space, since office buildings contain these areas and, as such, their benchmarks should account for these. Similarly, the ‘facilities’ category was added to the ‘open office’ benchmark. These assumptions may reduce the accuracy of the benchmark comparison, but they should remain representative of the overall usage of the buildings, and are certainly an improvement over single-use classification, as seen in the DECs. The final classifications for which benchmark data was provided from CIBSE included in Table 2 [11,12].
| Building Category | Benchmarks (kWh/m2/year) | |||
|---|---|---|---|---|
| Gas (good) | Gas (typical) | Electricity (good) | Electricity (typical) | |
| Lecture Theatre | 67 | 100 | 67 | 76 |
| Offices (Cellular) | 79 | 151 | 33 | 54 |
| Offices (Open) | 79 | 151 | 54 | 85 |
| Library | 115 | 161 | 46 | 64 |
| Computer Room | 128 | 128 | 155 | 175 |
| Science Laboratory | 110 | 132 | 155 | 175 |
Table 2: Benchmark values used in this study (provided by CIBSE Guides 2004 & 2008).
Now that building classifications and benchmark information have been compiled for all the buildings, it is possible to calculate individual benchmarks for each building. This was calculated simply by multiplying the floor area of each category by the benchmark value, which was then divided by the overall floor space. This procedure was followed for all the buildings (CSBs) to produce the energy performance figures in section 5.
Humanities Research Institute (HRI-CSB2)
A recently renovated Georgian building blending historic architecture with a modern conference facility, built in an adjoining annex. The CSB2 consists of office space and meeting rooms with the large conference centre holding up to 115 people. With a total floor area of 644 m2, this is the smallest building in the study. Access is restricted to HRI staff, with most occupancy occurring in normal working hours.
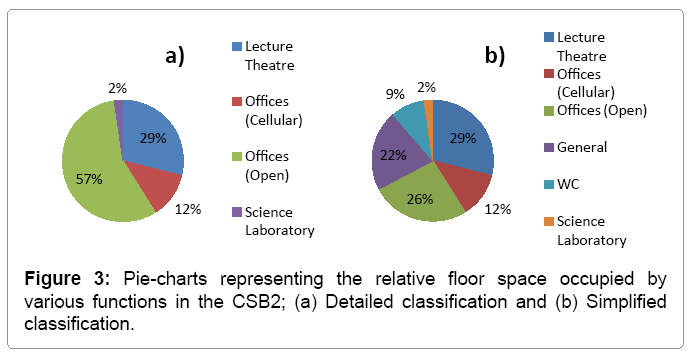
This relatively simple building, in terms of its function, has a more straightforward classification (Figure 3). The large conference area was included in the ‘lecture theatre’ category. Similarly to the CSB1, ‘general’ space was included into the ‘Offices (Open)’ category.
Graduate Research Centre (CSB3)
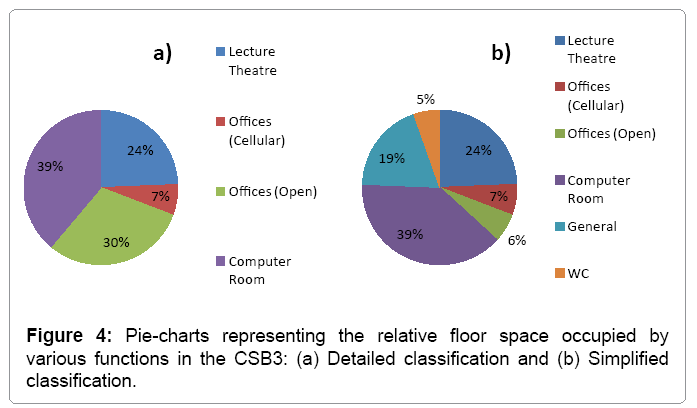
Located within the North Campus of the University, this building is primarily used for graduate-level study space, providing over 80 dedicated workspaces, but also houses several conference suites, seminar rooms, as well as kitchen and shower facilities, categorised in Figure 4. It was estimated to contain around 95 computers. The CSB3 contains a mixture of recently renovated study rooms with ageing corridors and stairwells. The ventilation systems of the building appeared poor and there were generally uncomfortably warm conditions inside the building during the survey. Common areas were occasionally heated. The building is open for students 24 hours a day; however, the busiest periods appeared to be between 9am and 8pm, with very low occupancy overnight.
Regent Court (CSB4)
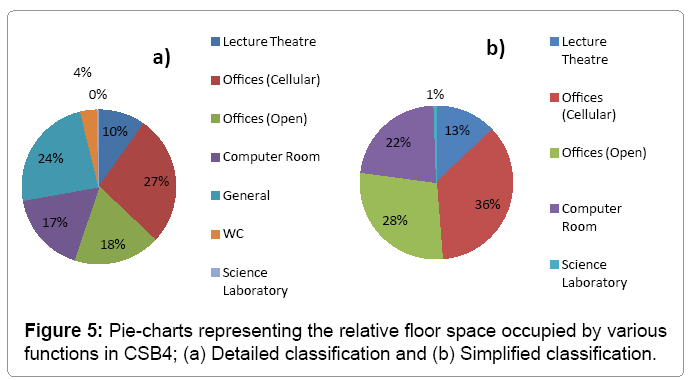
A large building separated into two halves around a central courtyard, built in 1992. Home to Computer Sciences and the School of Health Research and Related Research (ScHARR), the CSB4 contains large computer rooms and significant open-office style study space. Additionally, several lecture theatres, cellular staff-offices and meeting rooms make up a large proportion of the building. Common spaces are left unheated, with the exception of the entrance lobbies. The buildings opening hours are 7 am-7 pm (Monday to Friday) and 8 am-1.30 pm (Saturday), with the buildings classification shown in Figure 5.
Northgate House (CSB5)
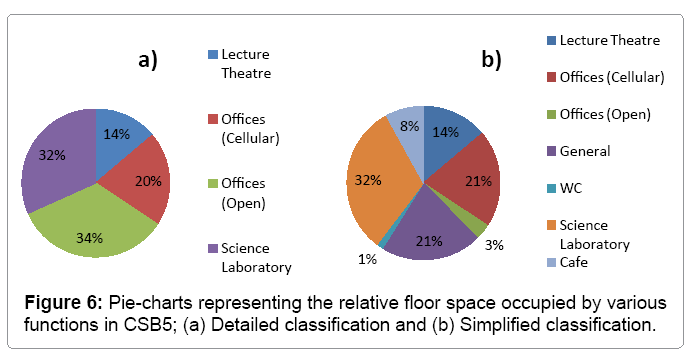
Home to the Department of Archaeology, the CSB5 houses several laboratories, including furnace rooms and cold storage rooms, which require mechanical ventilation. Additionally, there are several large lecture theatres and considerable office space, as shown in Figure 6. The boilers have recently been replaced with three Ariston CLAS HE boilers, housed in the lower-ground floor. Common areas such as corridors are left unheated and the reception area is to be renovated later this year. Opening hours are 8 am-5 pm (Monday to Friday) with restricted access in evenings and weekends.
University Case Study Buildings' Energy Performance
The following subsections review the performance of each of the surveyed case study buildings (CSBs) individually, before comparing their performance in section 5. It is important to individually look at each building and understand the energy and water usage patterns, by also analysing in more detail where the huge amounts of wasted consumption occur.
Case Study Building 1 (CSB1)
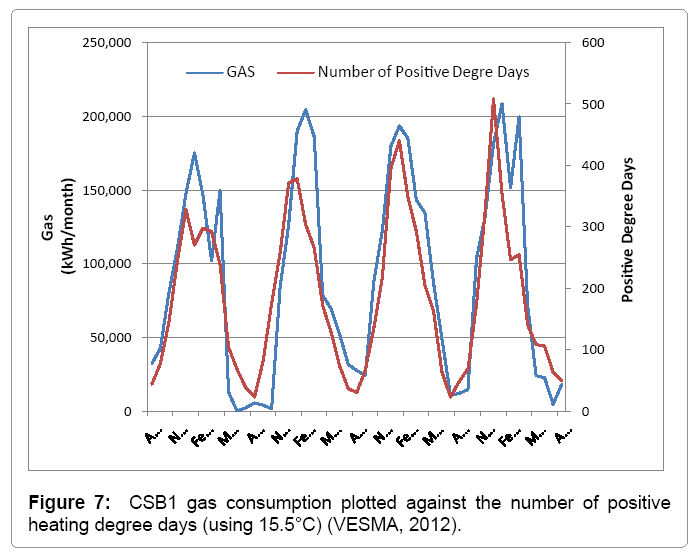
The gas readings clearly show seasonal trends which, when compared to degree-day data (the number of days cooler than 15.5°C, indicative of when heating is required, using East Pennines as the category indicative of Sheffield) [13] shows clear accordance to weather conditions (Figure 7).
However, the trends do not match up exactly so a more precise control system may be beneficial, particularly when the building was not fully occupied. Additionally, the gas consumption rarely reached zero during summer when no space heating was required (Figure 8a). It is likely that this gas was used to heat water, however, with low summer occupancy, this is an area where gas consumption could be reduced, possibly through the use of a small-scale electric water heater.
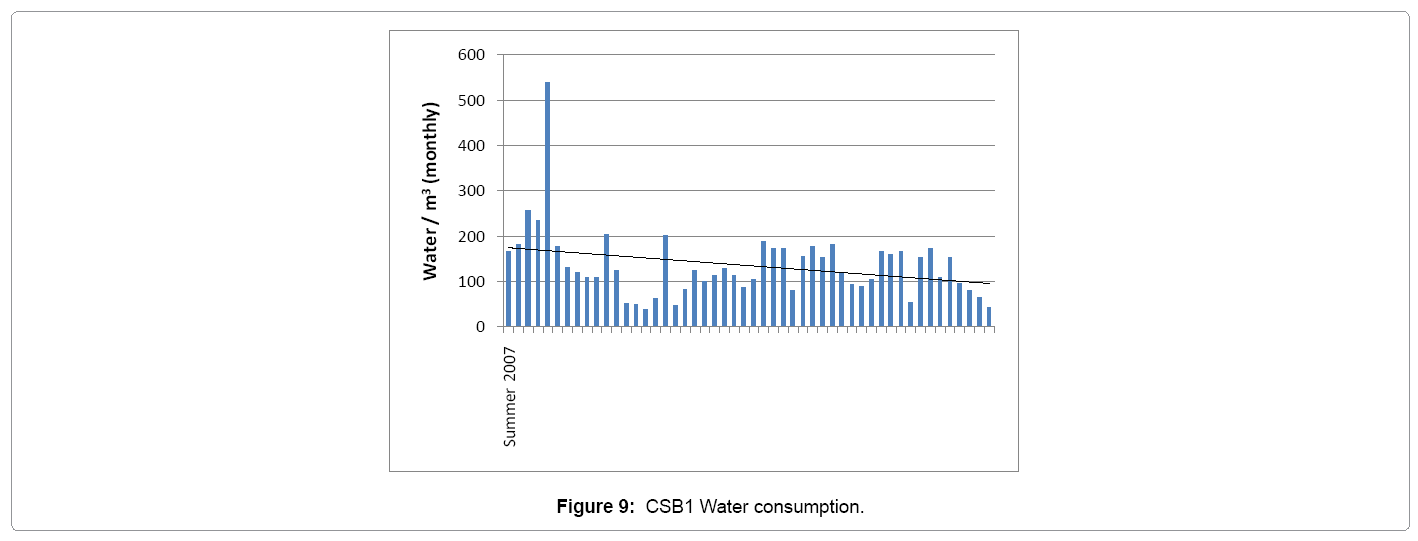
Water consumption appears to be declining, although it is likely that the anomalously high consumption during the 2008 winter skews an otherwise relatively constant consumption (Figure 9). Since water consumption is not considered an area where particularly high energy or cost savings can be made, it will not be given further attention.
Moreover, when the CSB1 performance is compared with benchmarks; it has the highest gas consumption per square metre, and is much higher than the benchmarks calculated (Figure 10a). However, this is not too surprising considering this is an old and mostly singleglazed building, with obvious heat-loss potential.
The low electricity consumption reflects the use of the building (Figure 10b). For example, much of the ‘open office’ category consisted of dimly lit corridors or studio-space where computers were not widely used. However, the ‘open office’ benchmark expects well-lit, wellequipped offices, which inevitably use more energy. It may also be that the users of the building, the School of Architecture students during the study period, are more-educated in matters of building energy-use, therefore use the electricity in a more efficient way, such as turning off lights.
Case Study Building 2 (CSB2)
It is not possible to extensively comment on gas consumption, since less than one year’s data is available due to sub-metering not implemented as part of energy conservation measures until after summer 2010 period. However, the data available suggest relatively high consumption that declines rapidly (Figure 11a).
Electricity consumption exhibits consistent annual patterns, with an overall increase in consumption since 2007, again reflecting increasing computer requirements (Figure 11b). The patterns suggest more consumption during winter when occupancy could be expected to be higher and lighting is more heavily used.
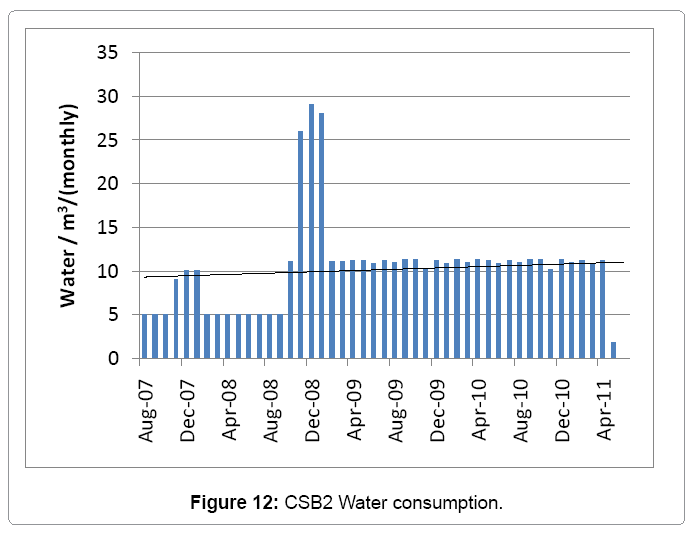
Water consumption on the other hand is very consistent since early 2009, but was sporadic previously due to building being under occupied and change of use ever since (Figure 12).
Moreover, when the CSB2 performance is compared with benchmarks; the short-term records reduce the weight of any conclusion drawn, however, there appears to be surprisingly high gas consumption for a building that has recently been renovated to a high standard (Figure 13a). The original building, however, is old so may require more heating.
CSB2 performs well in terms of electricity consumption, possibly reflecting user occupancy (Figure 13b). For example, during the survey, the offices were estimated at around 25% occupied, with several empty offices. Additionally, the conference centre is only used occasionally. Since benchmarks expect occupancy to be averaged over all buildings used when compiling benchmarks, unusually low occupancy would flatter the building performance, potentially masking any problems with efficiency.
Graduate Research Centre (CSB3)
The CSB3 has steadily increasing gas consumption, again with a clear seasonal cycle. During March of 2009, an extremely high value is recorded, although it appears this is more likely an error when entering the data, than genuine energy consumption (Figure 14a). In addition, there is very consistent electricity consumption since 2007 with no long-term trend (Figure 14b). However, there is a significant seasonal pattern, again reflecting winter lighting demand and increased occupancy.
Furthermore, this anomaly makes it difficult to visually assess the relationship between gas consumption and number of positive heating degree days shown in Figure 15, but there appears to be a reasonable relationship between temperature and gas consumption.
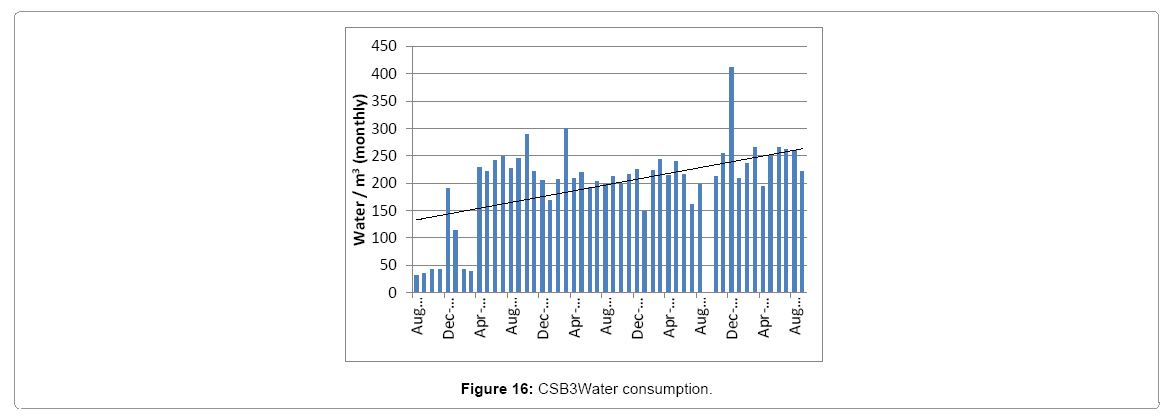
Water consumption appears to have increased significantly since 2007; however, this trend is likely created by the extremely low water consumption from August to December 2007. Since August 2009, water consumption has been relatively constant (Figure 16).
Moreover, when the CSB3 performance is compared with benchmarks; gas consumption is again considerably higher than the calculated benchmarks (Figure 17a). This may be caused by poor building ventilation and specification. During the building survey, for example, rooms were very warm resulting in users opening windows despite the fact the heating was on. Additionally, a number of windows were single-glazed. Another factor relates to the 24 hour operation of the building, which may cause heating of the building outside normal working hours, unlikely to be accounted for in benchmarks. Further research is required into the heating controls to explore this possibility.
The CSB3 uses significantly less electricity in comparison to benchmarks (Figure 17b). Similarly to the CSB2, this may be caused by the low occupancy levels. For example, a large number of the computer rooms were only around 10% occupied during the site visit, indicative of the normal occupancy according to users of the building. Because computer rooms expect intensive electricity consumption, it is likely they overestimate when computer rooms see such low occupancy levels.
Regent Court (CSB4)
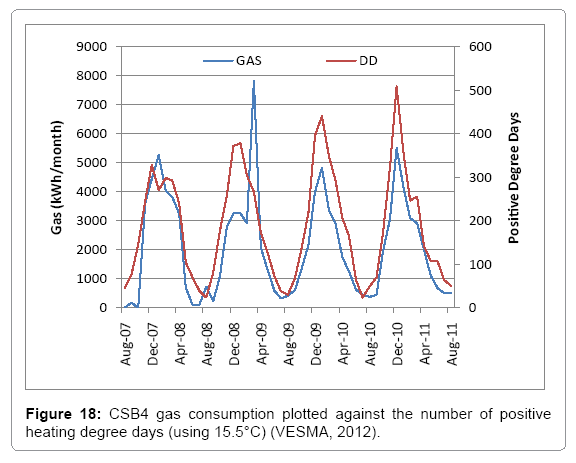
Showing a slightly decreasing trend, gas consumption in the CSB4 exhibits the same seasonal variability as other buildings. The relationship with positive heating degree days, shown in Figure 18, is strong with the exception of a very high consumption month in March 2009.
Electricity consumption is very high in Regent Court, but has been steadily decreasing since 2007 suggesting measures are being taken to become more efficient (Figure 19). For example, the use of more efficient computers and screens could be contributing to this decline.
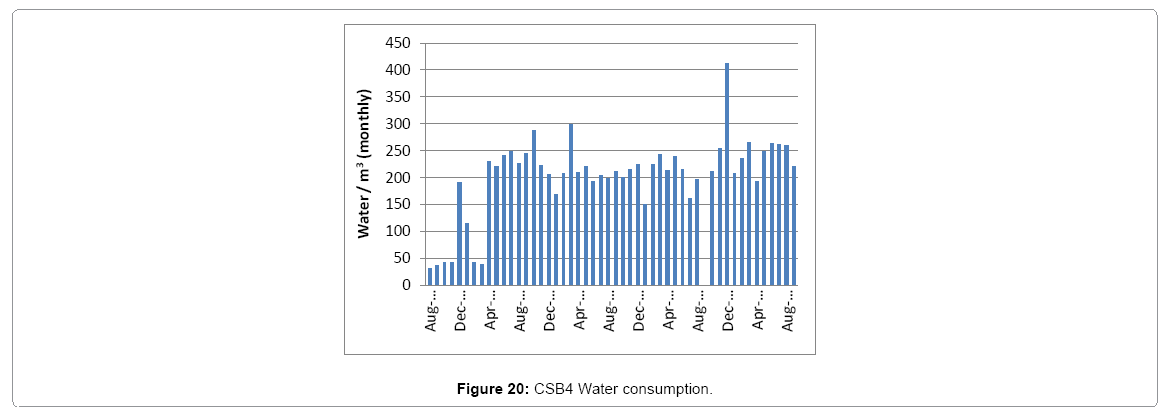
Water consumption has increased throughout the study period at the CSB4 (Figure 20). Similarly to the CSB3, this could be an apparent trend caused by the very low consumption during the first months of monitoring.
Moreover, when the CSB4 performance is compared with benchmarks; it consumed significantly less gas per square metre than the calculated benchmarks. As the home of the Computer Science Department, there are a large number of computer rooms in the building. The building energy assessment estimated that there are around 700 (± 75) computers in the building (based on 1 PC per cellular office, 0.375 PC/m2 in computer rooms, and 0.1 PC/m2 in study rooms and open offices), which appear to produce such significant amounts of heat that the requirement on gas heating is reduced (Figure 21a).
Considering there are around 700 computers in the CSB4, it is not surprising that electricity consumption is much higher than benchmarks (Figure 21b). Aside from the number of computers, it is likely that many of these computers are of higher specification than most university computers, and therefore more demanding on energy. Additionally, during summer, air conditioning is required in the large computer rooms to prevent overheating, placing further strain on electricity consumption.
Northgate House (CSB5)
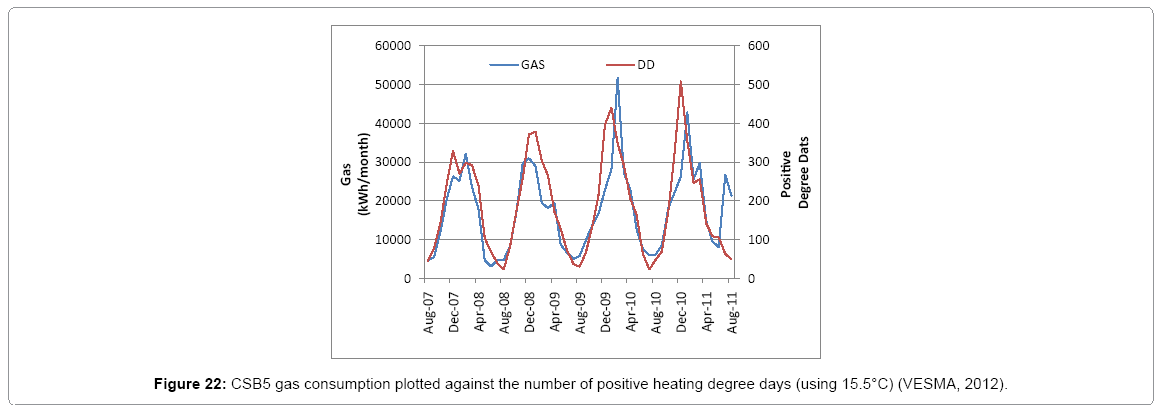
The CSB5 consumes a relatively large amount of gas, which has been increasing since 2007, and exhibits expected seasonal cycles. Gas consumption is inflated by the presence of several laboratories and a furnace room, but relates closely to degree days, shown in Figure 22.
Unusually high electricity consumption in early 2007 disrupts the overall trend, suggesting strongly decreasing electricity use (Figure 23). However, there does appear to be a decreasing trend, even without this high value, again suggesting the building is attempting to reduce its electricity consumption.
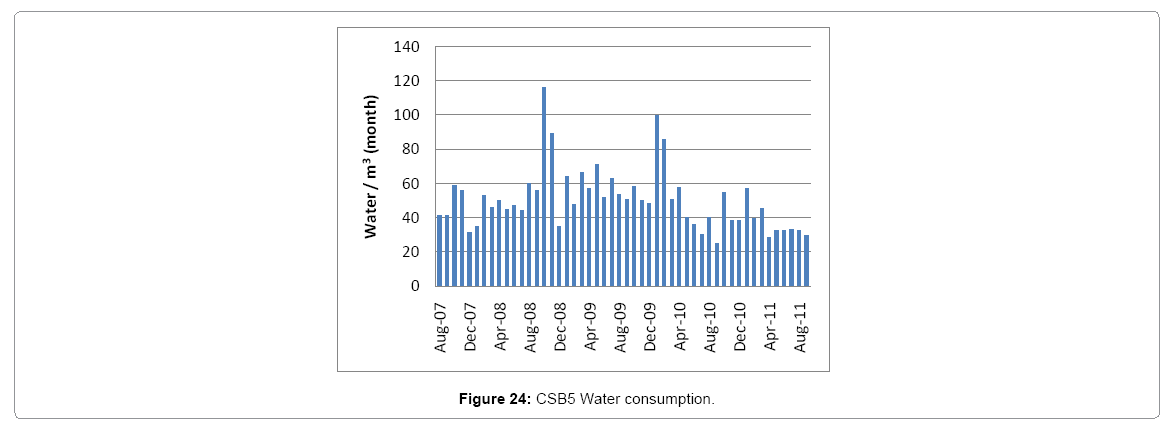
On the other hand, water consumption exhibits considerably greater variation than the other buildings, with no consistent level since 2007 (Figure 24). Laboratories require water in varying quantities depending on what branch of Archaeology is being studied, so it is likely that this is the cause of such variability.
Moreover, when the CSB5 performance is compared with benchmarks; it consumes gas considerably more than the calculated benchmarks, suggesting that improvements can be made in this area (Figure 25a). However, it is important to remember that the laboratory facilities and furnace room will consume more gas than the benchmarks may predict.
Electricity consumption is relatively close to the benchmarks suggesting efficient use of electricity (Figure 25b). However, consumption per square metre is second only to Regent Court, likely due to the laboratories.
Overall Performance and Building Recommendations
This section will provide a comparison of how all the buildings in this study perform in comparison to their benchmarks, before making recommendations regarding where the largest potential for energy savings are, as well as some potential issues this study has identified.
The work presented in section 4 helps to highlight the challenges of collecting data and finding reasonable answers to what is happening inside buildings and as much accurate way to explain how buildings perform the way they do because of the way they are used in order to make some sense on the overall performance. This is an important part of the work that helps building a case for recommendations which has been covered in this section.
Overall gas consumption
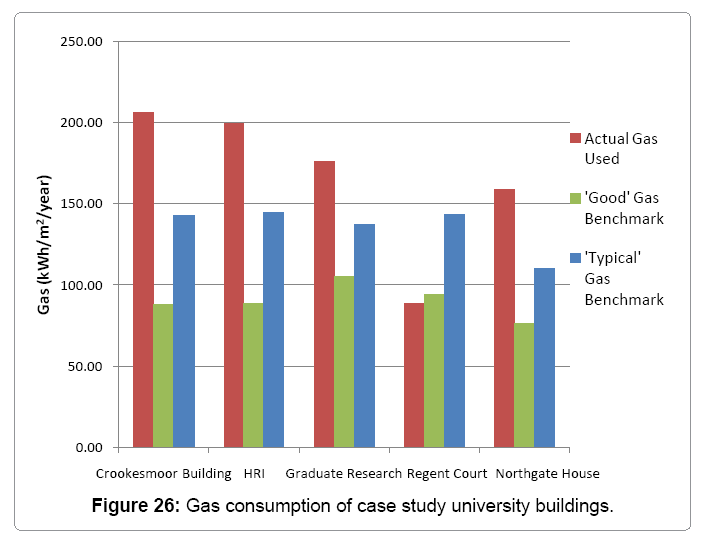
The overall gas consumption reflects the poor performance of all buildings, except CSB4 (Regent Court). However, it must be considered that benchmark comparison makes assumptions regarding the occupancy and usage of the buildings. Therefore, although these graphs provide a good indication of the energy performance of the buildings, they are not necessarily completely accurate. It is clear that overall performance is poor in comparison to the calculated benchmarks, with the exception of Regent Court (Figure 26).
In terms of recommending where the biggest energy savings could be made, it appears that the Crookesmoor Building (CSB1), HRI (CSB2), and the Graduate Research Centre (CSB3) offer the most room for improvement. All of these buildings are relatively old, and it was clear during surveying that there are areas for insulation improvements to be made. For example, the CSB1 is mostly single-glazed, including some very large windows, which could be improved. Similarly, the CSB3 contained a mixture of single and double-glazed windows with the main stairwell specified exclusively with single-glazed windows. The CSB2, however, is well-specified since its renovation, and improvements here may be less obvious. However, the main building is old, so further investigation of the building fabric is encouraged in order to identify why gas consumption is so high. It is important to remember, however, that the gas data for the CSB2 is very limited, and long-term monitoring is required for any accurate conclusions to be drawn. Problems in CSB4 and CSB5 are more difficult to identify, largely because the large number of computers, and the significant laboratory space, respectively, complicate interpretation. Another factor identified in all buildings (CSBs) was that gas consumption rarely reached zero during summer, when no heating was required. A cheaper option should be explored to produce hot water, if it is necessary in all buildings.
During the building surveys, a common issue was the lack of heating control. Particularly in the CSB3, warm, ‘stuffy’ conditions had caused users to open windows despite the heating being on. Information on the heating systems and controls has not yet been collected, other than that EFM has external control over heating in all the buildings in the study. Clearly, external control has advantages in that it allows consistent heating operation and, if properly managed, should allow cost savings over independent building-control. However, it is my opinion that building users should have more control or feedback over heating and ventilation controls, possibly allocating a member of staff responsible for control in each building. This should reduce the likelihood of heat escaping unnecessarily when, for example, users open windows rather than turn off radiators. It is strongly encouraged that the next part of the project collects detailed data on heating and ventilation controls, in order to accurately assess how efficiently this is being managed.
Overall electricity consumption
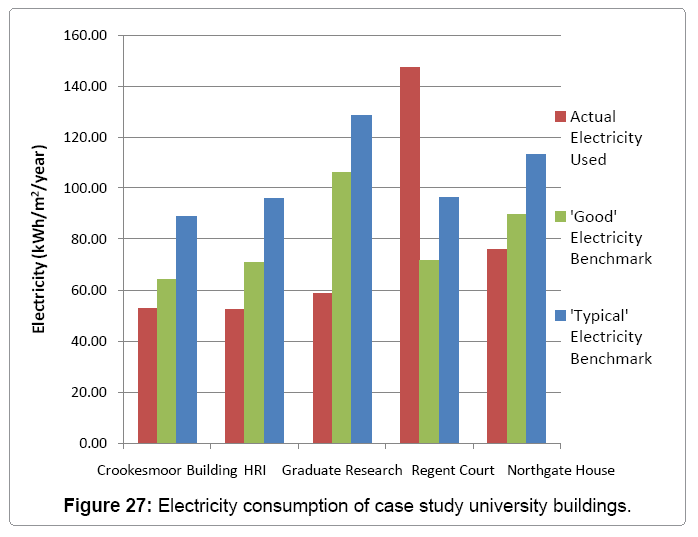
The overall electricity consumption performs much better in comparison to the calculated benchmarks, with the exception of Regent Court (CSB4) (Figure 27). However, all university buildings (CSBs) analysed in the study has shown potential for improvement. For example, computer management appears poor, in terms of the number of computers left on when not in use. Corporate Information and Computing Services (CICS) are responsible for many computer rooms on the university campus and have an automatic shutdown feature on all their managed PCs, however, there are also department-managed computer rooms. Apart from the CSB, all computer rooms in this study were department-managed, and therefore, it was suggested that these departments work with CICS in order to implement more energyefficient operation in the building. This is particularly applicable in CSB4, which is the only building to perform poorly in comparison to the benchmarks. However, the large number of computers will limit just how much the building can improve.
Clearly, performance is significantly improved over gas, compared to calculated benchmarks, although CSB4 uses significantly more electricity compared to benchmarks. Another area where electricity savings could be made is the control over lighting. Although automatic lighting was installed in several buildings’ corridors, few offices, lecture theatres, or computer rooms featured automatic lighting. A no-cost alternative to automatic lighting could be to more strongly encourage users to ensure lighting is turned off when leaving rooms.
Overall, gas reductions appear to be the most likely area of energy savings, with the primary solution appearing to be the control systems that govern the heating.
Discussions and Limitations
Energy benchmarks are now more and more widely-used method of comparing buildings together in order to bridge the energy performance gaps in building performance assessment however they need to be adjusted based on the building functionality, size and type. Again, it should be noted that some modern buildings may have multifunctionality and therefore they may need to be classified either under a separate category altogether or should be carefully assessed and analysed. Accordingly, the range for benchmarks, i.e. “Good Practice” and “Typical Practice”, could be adjusted respectively.
Moreover, as mentioned earlier, conducting energy benchmarking would require an active and an updatable database in order to show example cases for such building energy performance assessment to accurately take place. Additionally, occupancy profiles and occupant behaviour would need to be incorporated into the same databases in order to again determine more accurate and realistic benchmarking analysis.
These results and recommendations rely heavily upon the concept of benchmarking, which inherently makes assumptions regarding building occupancy and user behaviour. Although the classification has been employed to create the benchmarks was designed to account for the multi-use nature of university buildings, there may still be problems associated with the benchmarks. In particular, IT facilities were a very problematic benchmark [14], as the only benchmark data accessible was from 1994, and therefore vastly different to the demands of a modern computer suite. Some studies incorporated computer rooms into a ‘general offices’ category [15], however, the intensive occupancy and use of university computer rooms may not be accurately represented by a general office benchmark. As such, the benchmark for computer rooms was created using a combination of the other benchmarks. As a starting point, the ‘open office’ benchmark was used as a basis for gas consumption. Due to the heat produced by PCs, this benchmark was reduced by 25% to provide the benchmark used in this study. Although this reduction factor is not based on any available standard or recommendation, it is taken as a measure to create the adjustment in order to serve the reality. Therefore, it may be useful to explore this further by cross checking the value for validation. Regarding the electricity benchmark, ‘laboratory’ values were selected to account for the high computer densities and electricity-intensive nature of these facilities. It is hoped that this approach will result in a more accurate representation of university computer rooms that office benchmarks, and account for the heat computers produce.
A further limitation, and the most significant problem faced during this study, was the lack of a centralised energy database, and therefore the difficulty in communicating with various people in charge of energy management in EFM in an attempt to locate the data or information at the University of Sheffield. For example, different zones of the university are managed by different facilities managers, some of which were not aware of the project. When it was not possible to contact people, it resulted in significant delays, and it is estimated that around 50% of the project time was spent pursuing information. Moreover, there remains some information that has not been collected, which will therefore impact the next stage of the project. For example, outstanding information includes the heating systems and controls, of particular importance since all heating and boiler rooms were inaccessible during surveys, with the exception of CSB5.
Another limitation of this project, and an area where EFM can improve their building management, is the lack of occupancy profiles for buildings. This information could provide vital answers to the patterns of energy use in buildings, for example, if summer occupancy is higher than expected. However, by questioning some building users during the surveys, it was possible to gain an approximate indication of the periods when the buildings were busiest, from which it is hoped occupancy profiles can be predicted.
The aforementioned disconnect between CICS and departmentmanaged computer rooms have resulted in no records of the number of computers in each building. Estimations were made for the CSB4 and the CSB3 during surveys, but accurate data would nonetheless be extremely useful. If CICS and the department managed computer rooms can improve collaboration, it appears that energy efficiency could be improved.
Finally, the monitoring of energy data, which was conducted on a monthly rather than weekly timescale, could also be improved. Weekly data would allow higher resolution analysis of energy consumption, and identification of events, such as university holidays, and how they can affect energy consumption. Additionally, the consumption records existed for a maximum of four years, preventing long-term trend analysis. The quality of the data was generally good, however, there were several data-gaps and anomalous data-points that suggested data-input error.
Conclusion
This study has utilised an in-depth building classification system to perform benchmark analysis, to recommend where potentials exist for energy savings. It is clear that gas use in buildings offers considerable potential, particularly in the Crookesmoor Building (CSB1) and the Graduate Research Centre (CSB3). The HRI building (CSB2) also shows promise, although the lack of long-term consumption data reduces the weight of this conclusion. It appears that the control systems governing heating is an area where significant improvements can be made, particularly in relation to user control over heating. Electricity performance is much improved although significant improvements remain, such as improved computer management and automated lighting control.
At the same time, the study aimed at demonstrating several cases of university buildings and their energy performance gaps when compared with existing energy benchmarks. Besides giving recommendations for reduction of energy consumption in those selected cases, it was also important to draw some general conclusions for developing future policies and benchmarking studies to help creating a better understanding of buildings in terms of energy performance assessment methods and approach. The study has certainly drawn attention for future research scope in the filled and once again emphasised on the importance of benchmarks and developing practices that can help the methods of assessment available for future buildings.
References
- Energy Efficiency News (2009) UK University Funding to Depend on Emissions.
- Altan H (2010) Energy Efficiency Interventions in UK Higher Education Institutions.Energy Policy 38: 7722-7731.
- Chung W, Hui YV, Lam YM (2006) Benchmarking the Energy Efficiency of Commercial Buildings. Applied Energy 83: 1-14.
- Chung W (2011) Review of Building Energy-use Performance Benchmarking Methodologies. Applied Energy 88: 1470-1479.
- Nikolaou T, Kolokotsa D, Stavrakakis G (2011) Review on Methodologies for EnergyBenchmarking, Rating and Classification of Buildings. Advances in BuildingEnergy Research 5: 53-70.
- Perez-LombardL, Ortiz J, Gonzalez R,Maestre IR (2009) A Review of Benchmarking, Rating and Labelling Concepts withinthe Framework of Building Energy Certification Schemes. Energy and Buildings 41: 272-278.
- BEAU (2011) Building Energy Survey: A Methodology Developed forNon-domestic Buildings. Building Environments Analysis UnitInternal Report, Sheffield University.
- Hernandez P, Burke K, Lewis JO (2008) Development of Energy Performance Benchmarks andBuilding Energy Ratings for Non-domestic Buildings: An Example for IrishPrimary Schools. Energy and Buildings 40: 249-254.
- Jones PG, Turner RN, Browne DWJ, Illingworth PJ (2000) Energy Benchmarks for PublicSector Buildings in Northern Ireland. CIBSE National Conference, Dublin,Ireland.
- Lee WL (2008) Benchmarking the Energy Efficiency of Government Buildings with DataEnvelopment Analysis. Energy and Buildings 40: 891-895.
- CIBSE (2004) Energy Efficiency in Buildings: CIBSE Guide F. 2ndedtn,The Chartered Institution of Building Services Engineers, London, UK.
- CIBSE (2008) Energy Benchmarks, CIBSE TM46. The Chartered Institution of Building Services Engineers, London, UK.
- Lee WL (2012) Benchmarking Energy Use of Building Environmental Assessment Schemes. Energy and Buildings 45: 326-334.
- Tschudi W, Xu T, Sartor D, Koomey J, Nordman B, et al. (2004) Energy Efficient Data Centers. Environmental Energy Tech nologies Division, Lawrence BerkeleyNational Laboratory (LBNL): California Energy Commission, USA.
Citation: Altan H, Douglas JS, Kim YK (2014) Energy Performance Analysis of University Buildings: Case Studies at Sheffield University, UK. J Archit Eng Tech 3: 129. DOI: 10.4172/2168-9717.1000129
Copyright: ©2014 Altan H, et al. This is an open-access article distributed under the terms of the Creative Commons Attribution License, which permits unrestricted use, distribution, and reproduction in any medium, provided the original author and source are credited.
Share This Article
Recommended Journals
Open Access Journals
Article Tools
Article Usage
- Total views: 16913
- [From(publication date): 8-2014 - Apr 07, 2025]
- Breakdown by view type
- HTML page views: 12110
- PDF downloads: 4803

