Make the best use of Scientific Research and information from our 700+ peer reviewed, Open Access Journals that operates with the help of 50,000+ Editorial Board Members and esteemed reviewers and 1000+ Scientific associations in Medical, Clinical, Pharmaceutical, Engineering, Technology and Management Fields.
Meet Inspiring Speakers and Experts at our 3000+ Global Conferenceseries Events with over 600+ Conferences, 1200+ Symposiums and 1200+ Workshops on Medical, Pharma, Engineering, Science, Technology and Business
Review Article Open Access
Electrical Impedance Tomography in Rectangular Object Using Data Collection System Based on Absolute Boundary Potential Measurement
| Dudi Darmawan1,3*, Deddy Kurniadi1, Suyatman2 and Janivita1 | |
| 1Instrumentation and Control Research Group, Faculty of Industrial Engineering, Institut Teknologi Bandung, Jl. Ganesha 10, Bandung 40132, Indonesia | |
| 2Engineering Physics Research Group, Faculty of Industrial Engineering, Institut Teknologi Bandung, Jl. Ganesha 10, Bandung 40132, Indonesia | |
| 3NDT Research Group, Engineering Physics Study Program, Telkom University, Jl. Telekomunikasi 1, Bandung 40257, Indonesia | |
| Corresponding Author : | Dudi Dharmawan Instrumentation and Control Research Group Faculty of Industrial Engineering Institut Teknologi Bandung Jl. Ganesha 10, Bandung 40132, Indonesia Tel: +62-813-20500247 E-mail: dudiddw@telkomuniversity.ac.id |
| Received February 17, 2014; Accepted March 18, 2014; Published March 20, 2014 | |
| Citation: Darmawan D, Kurniadi D, Suyatman, Janivita (2014) Electrical Impedance Tomography in Rectangular Object Using Data Collection System Based on Absolute Boundary Potential Measurement. OMICS J Radiol 3:160. doi:10.4172/2167-7964.1000160 | |
| Copyright: © 2014 Darmawan D, et al. This is an open-access article distributed under the terms of the Creative Commons Attribution License, which permits unrestricted use, distribution, and reproduction in any medium, provided the original author and source are credited. | |
Visit for more related articles at Journal of Radiology
Abstract
One of the problems in Electrical Impedance Tomography (EIT) is the ill-possed problem occurred in the reconstruction process. Beside addition of the data number and developing of reconstruction method, using of data collection system also determine the quality of image produced. This study is aimed to propose an absolute boundary potential to adjacent method. The result showed that adjacent method with absolute boundary potential give the better result compared to the use of relative boundary potential.
| Keywords |
| EIT simulation; Rectangular object; Data collection system; Absolute boundary potential |
| Introduction |
| Tomography methods have been developed in various parameters with different information. One of the most widely used information is the impedance [1-3]. The parameters of information used adjusted to the needs of tomography. |
| Electrical Impedance Tomography (EIT) is one application that generates tomography using impedance parameters to represent the distribution of physical properties of the object being observed. Determination of the impedance distribution is performed through a process of reconstruction of the measurement data. Measurement data used is in the form of boundary potential. Boundary potential is part of the potential distribution caused by injected currents. |
| Use of this boundary potential raises the ill-posed in the reconstruction process [2,4,5]. This is due to the amount of boundary potential data is not enough to reconstruct a number of object parameters. Thus increasing the numbers of measurement data theoretically provide much information on the model parameters [6]. Therefore it is expected to reduce the ill-posed problem. The addition of data is done through the addition of a point on the edge of the measuring object. However, this is accompanied by the addition of object parameters to be determined. |
| Another way is to improve the data collection system. The data collection system includes current injection method and boundary potential measurement method. Current injection method will give the configuration of the position of the injection and the ground currents point. This electrodes configuration determines the current density that is applied to the area of object [2] and gives a unique current distribution profile [7]. While the method of measuring boundary potential gives information of area condition which is taken. In general, potential measurement method that is often used is a relative measurement. |
| For a single current source, there are three methods used are adjacent, opposite, and cross [2]. Cross and opposite use an absolute potential measurement while an adjacent method use relative potential measurement [8]. The resulting value is quite small and often not observed. This condition is exacerbated by the high noise that occurs in EIT measurements [2,5]. Moreover, this method only represents a state between two neighbouring electrodes. |
| This study proposes using absolute potential to adjacent instead of relative potential as has been done in [7]. This method produces a potential value of more scalable and can be separated from the noise that occurs. In addition, the absolute potential measurements can describe the state of the object wider between each electrode to the absolute point. |
| Data Collection System in Rectangular Object |
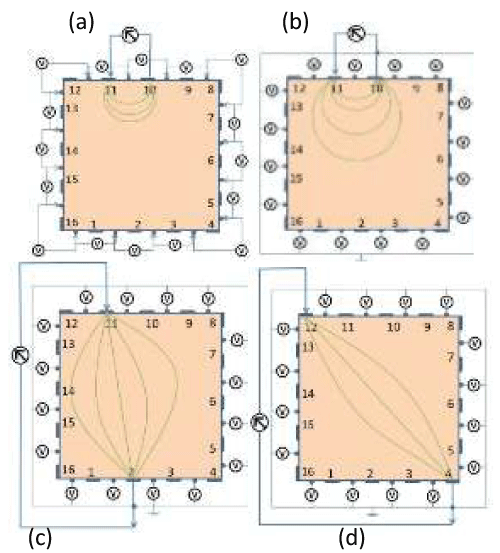
| Data collection System is formed by configuring of current injection method and potential measurement method. Current injection method is a configuration of current source and current sink position. In adjacent, cross, and opposite data collection system, current injection method consists of a single point of current source and a single point of current sink. The direction of current source is into the object and the direction of current sink is come out from object. Both of these points have the same current value but opposite in sign. Potential measurement method consists of absolute and relative potential measurement. Absolut potential is taken as potential difference between each node of boundary potential and current sink potential which have zero potential. The data of relative potential is taken as potential difference between each node and the other certain node. |
| In opposite data collection system, current injection method is formed by source and sink current that going across to the center of object with absolute potential measurement. In cross data collection system, current injection methods are formed by source and sink current that facing each other with absolute potential measurement. The adjacent data collection system is formed by source and sinks current that neighbouring each other with relative potential measurement. In the proposed data collection system, adjacent data collection system is formed with absolute potential measurement. This method is called an absolute adjacent. |
| In this study, data is formed by 16 boundary nodes which have difference position with 16 nodes of current injection on rectangular object. Current injection and boundary potential measurement point of four data collection system above are shown in Figure 1. |
| Forward and Invers Model |
| Forward model |
| In EIT, the current is injected through several points in the surface of the object. The current will propagate in the object that has specific conductivity distribution. The given current arises the electric potential distribution, which follow the basic electrostatic law. |
| Basic law for EIT problem is covered by Laplace equation such as equation (1). |
 (1) (1) |
| where V is the electric potential (in volts), and is the conductivity of the material. Boundary potential and current density condition in the surface are formed by equations (2) and (3). |
 (2) (2) |
 (3) (3) |
| Forward model is a solution of equation (1) for electric potential distribution if the object conductivity distribution is given. Equation (1) shows a non-linear relationship between conductivity and electrical potential. Analytic solution of electric potential distribution is hard to find. |
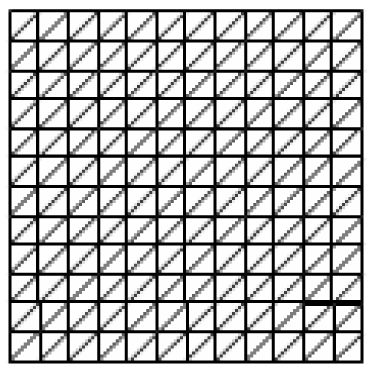
| Equations (1), (2) and (3) can be solved numerically using FEM. In this work, rectangular object is divided into triangular small elements by assuming each element has a conductivity of a homogeneous field. FEM give the result of linear equation system as equation (4). |
 (4) (4) |
| with Y is an admittance matric and I is current vector. Potential in each node is acquired by changing equation (4) become equation (5). |
 (5) (5) |
| while boundary potential is acquired by manipulating of equation (5) to equation (6). |
 (6) (6) |
| where |
| Vbound=boundary potential |
| Tr=transformation matric |
| In this study, regular triangular is used as shown in Figure 2. |
| Invers model |
| In this study, linearization method is used in the reconstruction process. It is done to obtain the conductivity distribution of the object. This method assumes the conductivity changes on the object boundary will result in potential changes linearly [6,7], as equation 7. |
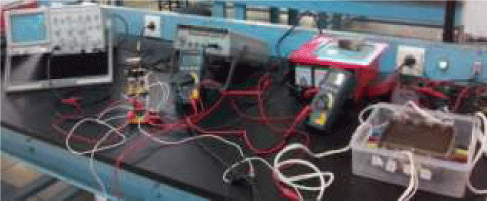
| To validate this forward model, an absolute adjacent collection method is used to obtain measurement data of potential boundaries. Experiments carried out with the necessary tools consist of a signal generator, power supply, constant current source circuit, oscilloscope, multimeter, and phantomnya object, as shown in Figure 4. |
 (7) (7) |
| With |
| P=element number |
| q=electrode number |
| [δV]=matric of boundary potential change |
| [δσ]=matric of conductivity distribution change |
| [S]=sensitivity matric |
| However, because the matric [S] is not square then the [δσ ] does not be obtained directly, so the equation must be modified to |
 (8) (8) |
| But in general, [S]T [S] is a singular matric so that the matric has no inverse. Regularization method is used to resolve the problem in order matric has an inverse [5,9]. One is the Tikhonov regularization [5]. So the inverse equation becomes as equation 9. |
 (9) (9) |
| with α is the regularization parameter and I is the identity matrix. |
| Potential Measurement for Forward Model Validation |
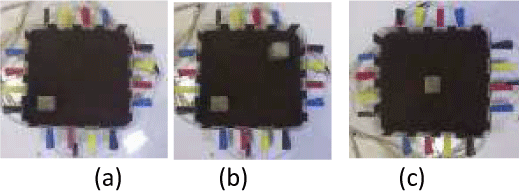
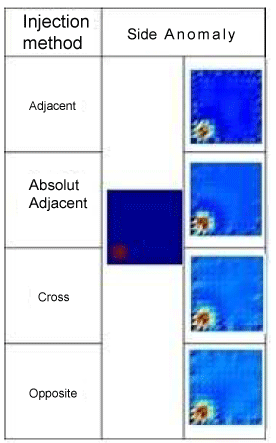
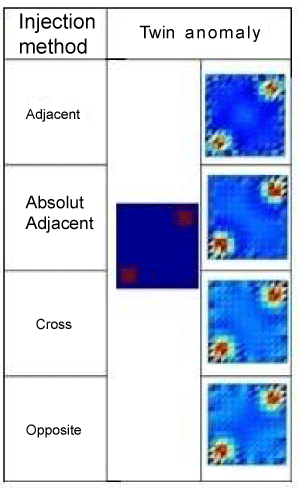
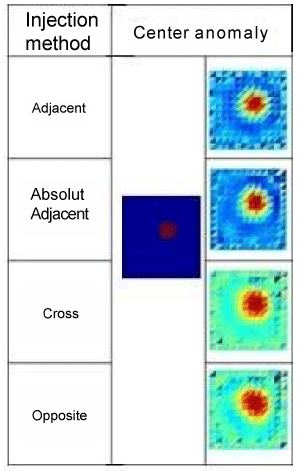
| Experiments were performed using the soil as a homogeneous object with a surface size of 13 cm×13 cm. To represent the state of anomalous objects, wood blocks having 2 cm×2 cm in size is used as a phantom object. Anomalies beam are addressed at the edge (side), two beams at the edge (twin), and a beam in the middle, like a Figure 3. |
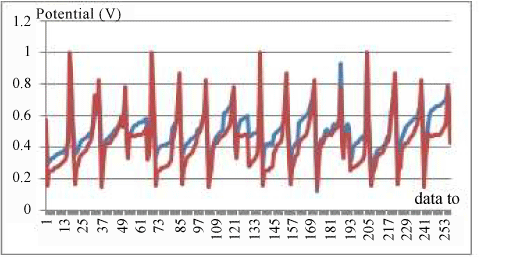
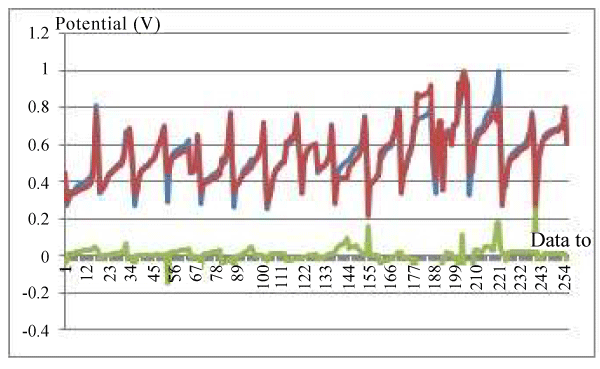
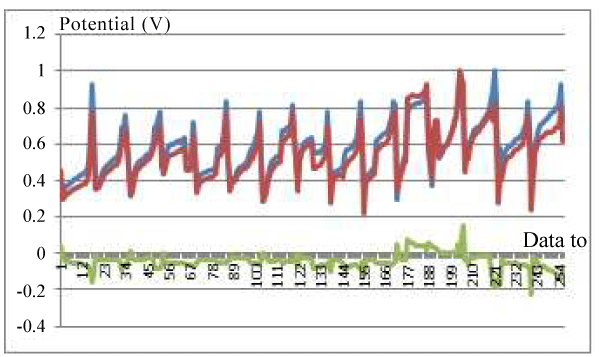
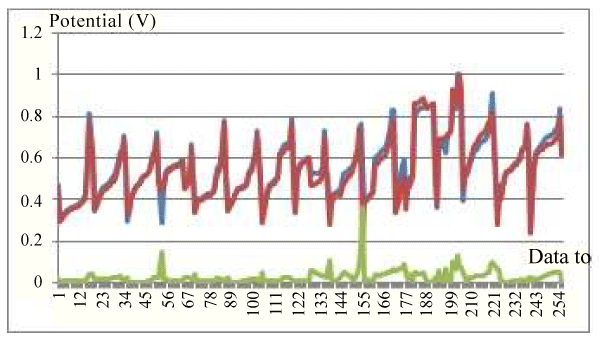
| Retrieval of data using this absolute adjacent method is performed as much as four times. The first is the case of homogeneous objects without anomalies. The second is the case of homogeneous objects with anomalous side. The third is the case of homogeneous objects with anomalous twin. The fourth is the case of homogeneous objects with anomalous center. For each case, injection of current circumstances is done 16 times. At each injection current, potential data is taken from 16 electrodes. Thus for each state, boundary potential data is obtained as much as 16×16=256. For homogeneous object, boundary potential distribution measured and the results of the simulation were acquired as Figure 5. |
| Measurement data is then used to validate the model forward. The parameters used are the average relative error of the potential boundary through the following equation 10. |
 (10) (10) |
| where |
| VE=Potential boundary of experiment |
| VS=Potential boundary of simulation |
| N=Data number |
| The average relative error of data in Figure 5 is 21%. Value of this error could be caused by the selection of resistivity values used in the simulation has not been approached resistivity value of the actual object and are not guaranteed in homogeneous. However, if considered qualitatively, the data in Figure 5 shows the data pattern similarities between simulation and measurement results. |
| Qualitatively, the pattern of distribution of the measured data has the same pattern with the simulation results. From these results it can be stated that the forward model can be used for the reconstruction process. The results of measurements of the boundary potential distribution, for any anomalies such as Figures 6-8, cannot be used directly to identify anomalies. The process of reconstruction of the potential distribution has to be performed to get the resistivity distribution of the object. Boundary potential data, for any system of data collection, can be made using the forward model and reconstruction can be done. |
| Reconstruction Results |
| Numerical computational is performed to test the reconstruction algorithm. The difference of resistivity distribution is calculated as a parameter of reconstruction evaluation, as defined in equation 11. Measure of the success of the reconstruction can be determined by the smallest of the resistivity difference. |
 (11) (11) |
| where |
 |
| error=resistivity difference |
| N=data Number |
| σ =conductivity |
| ρr=reconstruction resistivity |
| ρu=real resistivity |
| Linearization method, as stated in equation 9, is used for reconstruction process. Through the specific determining of α (alpha) value, then simulation has produced the results of error and image as follows: |
| Images with corresponding to that result are described in Figures 9-11. |
| In the Table 1, It is seen that the smallest error for all kinds of anomalies occur on adjacent absolute method. This error result is accordance with the image result. The results can be concluded is that the use of absolute boundary potential difference gives better results than the relative boundary potential difference. This is due to the absolute potential difference represents the state of the object much larger than the relative potential difference. For anomalies occurred at the edge (side and twin), can generally be detected quite well by all these methods. But for anomalies in the middle (center) shows the reconstruction results are not better results than the anomalies that are on the edge. These results emphasize the EIT problem is that the less sensitivity of parameter changes occurred far away from boundary. |
| Conclusion |
| Anomalous conditions cannot be directly identified through an analysis of the boundary potential. The reconstruction process should be performed for getting resistivity distribution. |
| Four types of data collection, namely the cross, opposite, adjacent, and absolute adjacent, resulting reconstructed image corresponding to the given numeric test data. But all of that data collection produces a less good reconstructions image for anomalies that are far away from the boundary, which is in the middle of the object. It shows insensitivity to changes of object parameters in far away from the boundary. |
| The use of an absolute boundary potential in adjacent method provide a better result compared to the relative boundary potential. In addition, it give more observable data and distinguishable from measurement noise. |
References |
|
Tables and Figures at a glance
| Table 1 |
Figures at a glance
 |
 |
 |
 |
| Figure 1 | Figure 2 | Figure 3 | Figure 4 |
 |
 |
 |
 |
| Figure 5 | Figure 6 | Figure 7 | Figure 8 |
 |
 |
 |
|
| Figure 9 | Figure 10 | Figure 11 |
Post your comment
Relevant Topics
- Abdominal Radiology
- AI in Radiology
- Breast Imaging
- Cardiovascular Radiology
- Chest Radiology
- Clinical Radiology
- CT Imaging
- Diagnostic Radiology
- Emergency Radiology
- Fluoroscopy Radiology
- General Radiology
- Genitourinary Radiology
- Interventional Radiology Techniques
- Mammography
- Minimal Invasive surgery
- Musculoskeletal Radiology
- Neuroradiology
- Neuroradiology Advances
- Oral and Maxillofacial Radiology
- Radiography
- Radiology Imaging
- Surgical Radiology
- Tele Radiology
- Therapeutic Radiology
Recommended Journals
Article Tools
Article Usage
- Total views: 13369
- [From(publication date):
April-2014 - Mar 29, 2025] - Breakdown by view type
- HTML page views : 8850
- PDF downloads : 4519
