Effluent as Surfactant for Enhanced Oil Recovery
Received: 26-Jan-2014 / Accepted Date: 09-Jun-2014 / Published Date: 19-Jun-2014 DOI: 10.4172/2090-5009.1000109
Abstract
This investigation considers black liquors (BL) as candidates for chemical enhanced oil recovery (EOR) process. These BLs were effluents from paper mills. The main constituent of BL is sodium lignosulfonate, an anionic surfactant. Results show that these anionic surfactants may be the preferred candidates for EOR as they may be effective in creating low interfacial tension (IFT) at dilute concentrations without requiring an alkali or a co-surfactant. Some of the formulations exhibit a low IFT at high salinity, and hence may be suitable for use in high saline reservoirs. Adsorption tests were conducted on core samples whichindicate that the loss of these formulated surfactants may be comparable to other types of anionic surfactants. Evaluation of surfactants performance was done in oil recovery by core flood tests. Selected formulations recovered about 20-30% of the waterflood residual oil saturation even with dilute concentration of 0.18 wt% surfactant concentrations from core samples.
Keywords: Black liquor; sodium lgnosulfonate; Low interfacial tension; Enhanced oil recovery; Surfactant adsorption; Chemical flooding
17584Introduction
Surfactant enhanced oil recovery (SEOR) has been applied commercially for many years specially starting in 70s and 80s [1-10]. Most of these projects were in pilot stage, but with the recent rise in oil prices to $115.60 for Brent crude oil and $94.76 for WTI (West Texas Intermediate) crude oil, the chemical EOR process has received new impetus.
The basic physics behind the SEOR is that the residual oil dispersed as micro-sized oil blobs is trapped by high capillary forces within the porous media. Increasing the fluid flow viscous forces or decreasing the capillary forces holding the oil blobs are required for pushing the oil to the production well. The thumb rule for a successful SEOR process is to reduce the interfacial tension (IFT) to 10-3 mN/m between the oil and the aqueous phases [1]. This is equivalent to increasing the capillary number Ncap to three orders of magnitude. The Ncap is a dimensionless group which represents the ratio of the viscous to capillary forces. Viscous forces promote mobilizing oil blobs in the porous media and the interfacial forces trap oil blobs in place. Another major factor that determines the technical and economic factor of the SEOR is to minimize the depletion of the injected surfactant due to adsorption on to the porous media.
A low surfactant concentration of 0.05% to 0.5% is required for effective implementation of the SEOR process [11]. A surfactant solution is injected to decrease the IFT of the oil ganglia and the aqueous phase [12-17], which mobilizes the ganglia through narrow necks of the pores of the reservoir rock [15], thus forming an oil bank. The formation of an oil bank is indispensable, since it will allow the efficient mobilization of the trapped crude oil. Because of the cost of such agents, the volume of a slug can represent only a small percentage of the reservoir volume. To preserve the integrity of the slug as it moves through the reservoir, it is sometimes pushed by water to which a polymer has been added. The chemical composition of a slug and its size must be carefully selected for each reservoir and crude oil system. Not all parameters for this design process are well understood. Surfactant flooding is evaluated in this study. Several laboratories developed formulations based on petroleum sulfonate which can displace as much as 95 percent of the oil from reservoir core samples [18]. Maraflood oil recovery process test in the Bradford Third Sand of Pennsylvania observed an increase of 7 to 10 percent oil recovery in the SEOR over the previous water flooding process [19]. Oil recovery in the oil fields of West Siberia has increased by 3–4% after water flooding and there was an addition of 140–200 tons of oil on a ton of surfactant [20]. Some major tests are under way to determine its technical and economic feasibility. Steinborn [21] used the commercially available non-ionic or neutral surfactant, Triton X-100 (TX). Alkyl polyglycoside surfactant has been considered for EOR applications by [22]. Chemically, Black Liquor (BL) is a mixture of several basic elements where the largest fractions are carbon, oxygen, sodium and sulphur. Results from an elemental analysis done by Swedish National Testing and Research Institute, on a dry BL sample are given in Table 1. The sample was taken from Assi Domän Kraftliner in Piteå in January 2000. BL is stable upto a temperature of 3000°C and a pressure of 40 bars (40.8 kg/cm2) (Small Jr. 1985). However the use of black liquor for EOR was studied by [23-28] while the adsorption of BL on the porous media was also studied in [11]. A very low-cost commercial detergent based surfactant (VLCS) available readily in India corresponds to Vim dishwashing powder was used as a surfactant by [29].
| Sl. No. | Composition | Amounts |
|---|---|---|
| 1 | Sp. Gr. At 600F | 1.09 |
| 2 | Density at 600F | 1.09 gm/cc |
| 3 | Total solids | 16.1-16.5% |
| a | Na2CO3 as Na2O | 29.04 gm/lit |
| b | Na2Sas Na2O | 5.83 gm/lit |
| c | NaOH as Na2O | 3.63 gm/lit |
| d | Na2SO4 as Na2O | 1.16 gm/lit |
| e | Other compounds as Na2O | 9.57 gm/lit |
| 4 | Total Sodium as Na2O | 49.23 gm/lit |
| 5 | Na-lignosulfonate (approx) (mol.wt=368) |
0.13258 mol/lit=48.7894 gm/lit |
Table 1: Composition of Black Liquor.
Experimental
Materials and methods
Materials: The specific surfactants selected for this study were 15 different BL samples collected from different paper mills of India. Chemfarm, Dibrugarh (Assam) supplied n-octane and the cosolvent (2-propanol), which is a weak amphiphile that adsorbs at the interface (thereby changing the spontaneous curvature of the amphiphilic film). The polymer [Polyacrylamide (PAA)] was supplied by Ciba Specialty & Virchow Group, Hyderabad, India. Kaolinite clay was purchased from Caltron Clay & Chemical Pvt. Ltd., Mumbai, India.
In this study the word co-surfactant is used for secondary surfactants e.g. sorbitan esters or sorbitan ester ethoxylates [30-32] in order to differentiate from simpler molecules e.g. 2-propanol or 1-butanol [33,34], which is defined as cosolvents. The de-ionized water was prepared by distilling tap water. The n-octane was used as an oleic phase; other studies have shown that the IFT and phase behaviour of crude oils can be represented well by n-alkanes ranging from n-hexane to n-decane [1]. Two crude oils from the producing horizon of the Bhogpara and Nahorkatiya oil field belonging to the Upper Assam basin were used for the IFT measurements. The surfactant flood were performed in a Berea sandstone core of 10.6 cm length and 3.81 cm diameter and glued into aluminium housing with epoxide glue, was given by the Department of Research and Development, Oil India Limited, Duliajan for experimental purpose. The absolute permeability of the core was 240 mD determined by the core flooding apparatus and porosity 22% determined by the Helium porosimeter.
Interfacial tension (IFT) and phase behaviour (PB): IFT and phase behaviour (PB) experiment samples were prepared in volumetric tubes adding 5 ml of the aqueous surfactant/co-solvent/salt formulations to 5 ml of hydrocarbon. The samples were mixed well for several hours, and were allowed to equilibrate for at least three weeks at ambient conditions (T=25°C, atmospheric pressure). The phase characteristics of each system were recorded (i.e., the relative volumes of the aqueous and oleic phases, and, if present, the middle-phase) and the IFT of the aqueous and oleic phases were determined by the Spinning Drop Tensiometer SVT. Several experiments were reported showing that the Spinning Drop method has a standard deviation of approximately 20%.
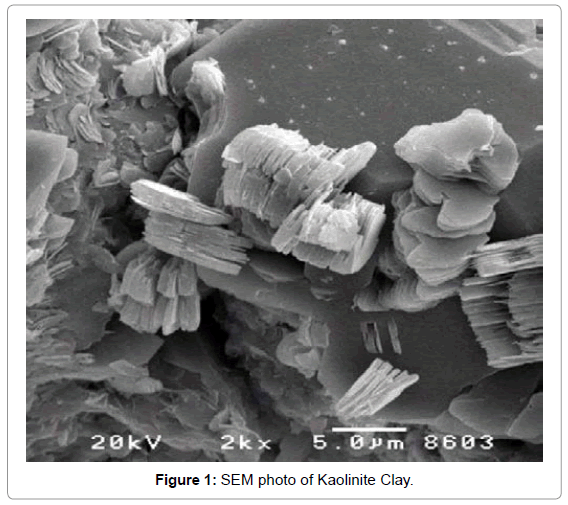
Surfactant adsorption onto kaolinite clay: Adsorption of all investigated surfactants onto kaolinite clay was measured. SEM photo of the kaolinite clay is in Figure 1. Adsorption is an important physical process leading to surfactant loss during a SEOR flood [1] and should therefore be minimized. Most of the surfactant mass is adsorbed onto clays as they have the largest surface area.
Kaolinite (more details about this clay can be found in [35] is heated in an oven at 120°C for two hours and then added the surfactant solution (I: 20 solid to liquid mass ratio). The samples were then shaken for 8 h at 250°C in an electric shaker at ambient conditions. The test tubes were next centrifuged to separate the solution and clay. Equilibrium surfactant concentrations and adsorbed surfactant masses were determined.
Oil displacement core flood experiments: Oil recovery was determined by fully saturating the core with brine under vacuum and then injecting n-octane onto the core in a primary drainage process with a capillary number Ncap=3.36 × 10⁻⁸ [1] until connate water saturation was reached (Swc=40.9% ± 2.0%). The core was then subjected to a waterflood in a secondary imbibitions process at Ncap= 7.11 × 10 M-8, the residual water flood oil saturation was 30.2% ± 2.0% [32]. Then the surfactant formulation followed by polymer drive slug, was injected into the core and incremental oil production was measured against time until no further oil production was observed.
Two selected BL formulations (Table 2) were tested in the corefloods. They were chosen because they showed low IFT and low adsorption behaviour onto kaolinite clay. The surfactant formulations were prepared in 3000 ppm NaCl brine since the formation water brine saturation of Nahorkatiya and Bhogpara reservoir is 3000 ppm NaCl. The surfactant and polymer slugs were injected at a flow rate of 0.02 cm3/s [36].
| Formula-tion | Surfactant | Surfactant conc (wt%) | PV surfactant injected | Polymer drive solution | PV polymer drive solution | IFT (mN/m) |
|---|---|---|---|---|---|---|
| 1 | BL-1 | 0.18 | 0.25 | 350 ppm PAA in 3000 ppm brine*** | 10 | 0.008* |
| 2 | BL-2 | 0.18 | 0.80 | 350 ppm PAA in 6000 ppm brine*** | 12 | 0.003** |
**IFT of 0.18 wt% BL-2 in 6000 ppm NaCl brine against n-octane
***350 ppm PAA in 3000 ppm NaCl brine had a viscosity of 1.5 mPa-s at 2.6 s-1, measured with a Brookfield viscometer at STP.
Table 2: Details of the BL formulations used in the core flood tests.
Results And Discussion
IFT measurement
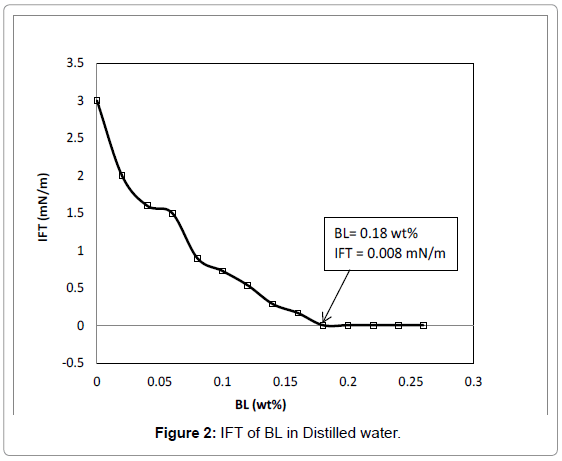
IFT of aqueous phase containing different BL formulations and oleic phase containing either n-octane or crude oils were measured. Surfactant solutions with and without cosolvent (2-propanol) were screened initially against n-octane. For the best i.e., lowest IFT of BL in distilled water is 0.008 mN/m and the CMC value is 0.18 wt% as in Figure 2. Then for selected BL surfactants, the IFTs were measured against two crude oils at elevated temperature to simulate more representative conditions of an oil reservoir. The influence of salt and the addition of a second surfactant on IFT were tested for BL formulations versus n-octane. Changing salinity and cosolvent concentration solubility in the surfactant formulations were varied with the objective to achieve low or ultra-low IFT. If an IFT of zero be achieved, complete miscibility and hence complete oil recovery would be achieved.
Initial screening of BL
The IFTs of 0.18 wt% BL surfactant aqueous solutions were measured as a function of aqueous phase salinity (0-20,000 ppm NaCl range) versus n-octane as the oleic phase. The IFT was measured with formulations that contained surfactant only and also samples containing 1 wt% 2-propanol as a cosolvent.
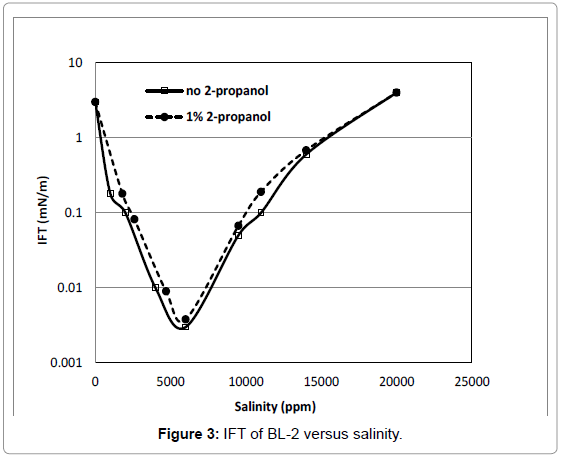
Figure 3 shows IFT results for BL-2. The IFT of this surfactant decreased dramatically with an increase of salinity, at 6000 ppm NaCl, its IFT was ultra low with a value of 0.003 mN/m. The sharp minimum in IFT indicates the optimal salinity for BL-2 surfactant is near 6000 ppm NaCl. It can be seen in Figure 3 there is a little effect due to the presence of cosolvent.
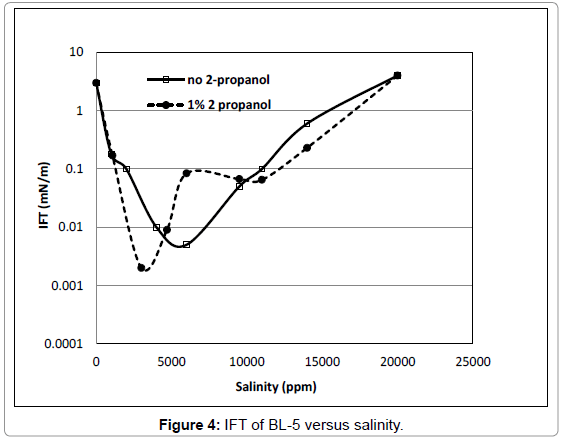
The BL-3 and BL-4 (not shown), the IFT values indicated an optimal salinity at 3000 ppm NaCl. The lowest IFT was approx. 0.01 mN/m. The effect of cosolvent was very small. Similarly trends were found for BL-5 surfactant, as shown in Figure 4. The lowest IFT for BL-5 was 0.005 mN/m at a salinity of 6000 ppm without addition of cosolvent, and 0.002 mN/m at 3000 ppm NaCl with addition of 2-propanol.
IFTs measured for BL-6 (not shown) was 2.01 mN/m at 3000 ppm salinity without the addition of 2-propanol as compared to 0.1 mN/m at any salinity with the addition of 2-propanol. Addition of cosolvent has effect on IFT but in case of BL-6, IFT remains towards the higher side.
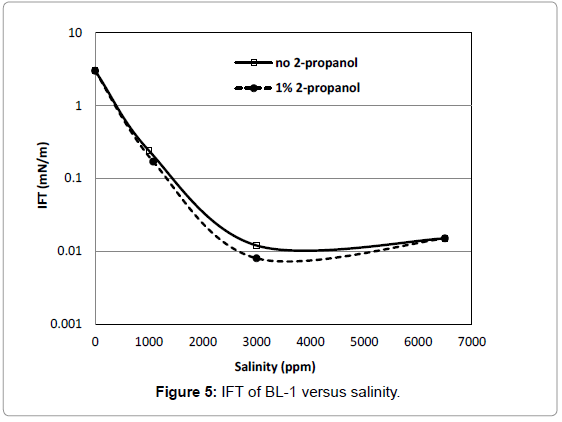
Figure 5 show that the IFT of BL-1 had a fairly minimum IFT over a range of salinities. This could be an advantage for EOR; because of this behaviour BL-1 is considered a suitable candidate for reservoirs with a wide range of salinity. The IFT of this surfactant was as low as 0.008 mN/m and the effect of 2-propanol on IFT was small. IFTs measured for BL-6 (not shown) was 2.01 mN/m at 3000 ppm salinity without the addition of 2-propanol as compared to 0.1 mN/m at any salinity with the addition of 2-propanol. Addition of cosolvent has effect on IFT but in case of BL-6, IFT remains towards the higher side.
Figure 5 show that the IFT of BL-1 had a fairly minimum IFT over a range of salinities. This could be an advantage for EOR; because of this behaviour BL-1 is considered a suitable candidate for reservoirs with a wide range of salinity. The IFT of this surfactant was as low as 0.008 mN/m and the effect of 2-propanol on IFT was small.
The IFT of BL-7 (not shown) with or without cosolvent were very similar and a minimum IFT of 0.05 mN/m was reached at a salinity of 6000 ppm (no cosolvent) or 10000 ppm (with cosolvent).
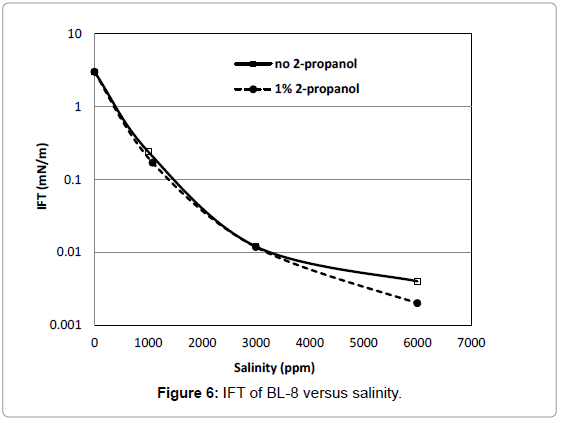
The IFT of BL-8 decreased to 0.004 mN/m with an increase of salinity to 6000 ppm (Figure 6). With addition of cosolvent, its IFT decreased to as low as 0.002 mN/m.
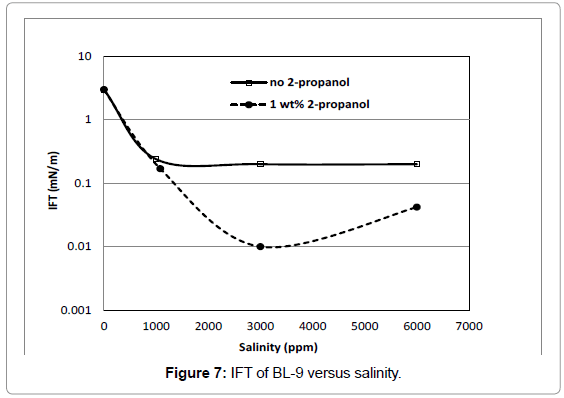
The IFT of BL-9 (Figure 7) without cosolvent remained almost a constant at about 0.2 mN/m, whereas with addition of cosolvent, the IFT was lowest at 3000 ppm which was 0.01 mN/m.
The strong sensitivity of IFT to salinity is expected as these surfactants are anionic [1]. IFTs of anionic surfactants decreases as salinity of the aqueous phase increases. The results suggest that the optimal salinity (salinity of minimum IFT [1,37]) can be as high as several ppm NaCl concentration. This is consistent with the trend observed in Na2CO3, brines [38,39]. Hence these surfactant may be included in an EOR operations for relatively saline reservoirs.
Another trend is that the addition of 2-propanol as a cosolvent had little effect. Possible exceptions higher IFT (IFT=0.1 mN/m) values of BL-6 lower IFT values of BL-1 (IFT=0.008 mN/m) and a reduction of IFT by a shift in optimum salinity for BL-5 (Table 3). This is contrary to the behaviour of nonionic alkyl polyglucosides where cosolvent strongly reduce IFT [22].
| Serial no. | Fig.no. | 0.18 wt% BL No. | Salinity (ppm) | Cosolvent=1 wt% 2-propanol |
IFT (mN/m) | Effect of cosolvent |
|---|---|---|---|---|---|---|
| 1 | 1 | BL-2 | 6000 | Very little | 0.003 | Small effect on IFT |
| 2 | Not plotted | BL-3 and BL-4 | 3000 | added | 0.01 | Small effect of cosolvent on IFT |
| 3 | 2 | BL-5 | 6000 | Not added | 0.005 | IFT reduction with cosolvent (like non ionic) |
| BL-5 | 3000 | added | 0.002 | |||
| 4 | Not plotted | BL-6 | 3000 | Not added | 2.01 | Change in IFT with cosolvent, but IFT remains higher |
| BL-6 | Any salinity | added | 0.1 | |||
| 5 | 3 | BL-1 | Over wide range of salinity, suitable for EOR | added | Fairly minimum IFT of 0.008 | Small effect on IFT |
| 6 | Not plotted | BL-7 | 6000 | Not added | 0.05 | No effect on IFT by cosolvent or salinity |
| BL-7 | 10000 | added | 0.05 | |||
| 7 | 4 | BL-8 | With increase of salinity to 6000 | Not added | 0.004 | Reduction of IFT with increase in salinity |
| BL-8 | added | 0.002 | ||||
| 8 | 5 | BL-9 | 3000 | Not added | 0.2 | Reduction of IFT with cosolvent (like non-ionic) but with constant salinity |
| 3000 | added | 0.01 |
Table 3: Initial screening of BL.
In general added cosolvent packed at the interface so as to decrease the curvature of the interfacial layer and thereby reduce the IFT [40]. Sabatini [41] suggested the concept of a, “hydrophobic linker”, as a physical model for the action of these cosolvents. That is an additive may work by linking the oil and surfactant molecules better at the interface. However even this phenomenon have marginal effect on the IFT of the investigated BL surfactant systems.
Influence of salt on IFT of BL formulations and phase behaviour [Figure 8]
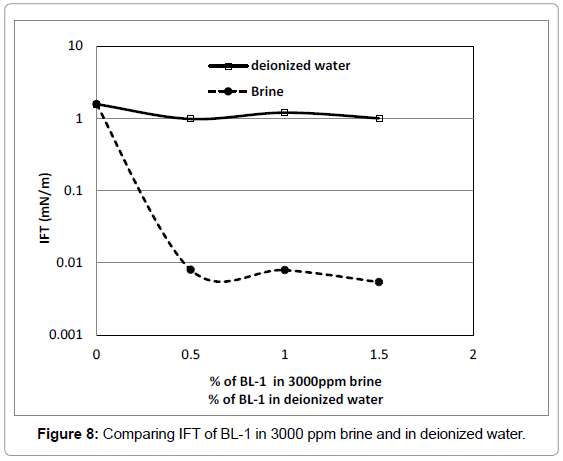
The oleic phase was n-octane and the surfactant concentration was from 0-1.5 wt% in 3000 ppm brine solution or in deionized water. All measurements were conducted at ambient conditions (T=25°C, atmospheric pressure). The measured IFT of 3000 ppm of brine with n-octane is 1.57 mN/m (ploted in Figure 8). As the salinity of the aqueous phase increases there is reduction in IFT as compared to deionized water as in Figure 8, which is consistent with Mohanty’s [42] observations with crude oil systems and with the behaviour observed for nonionic alkyl polyglucoside surfactants [43,44,30].
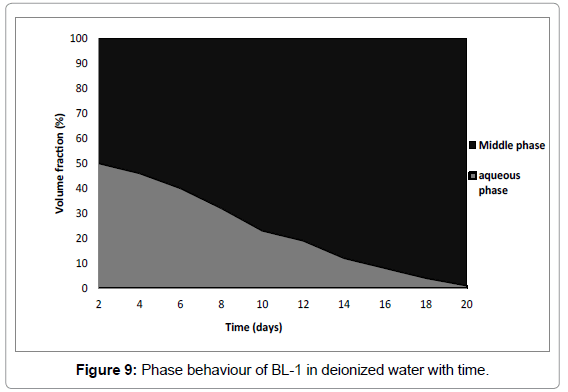
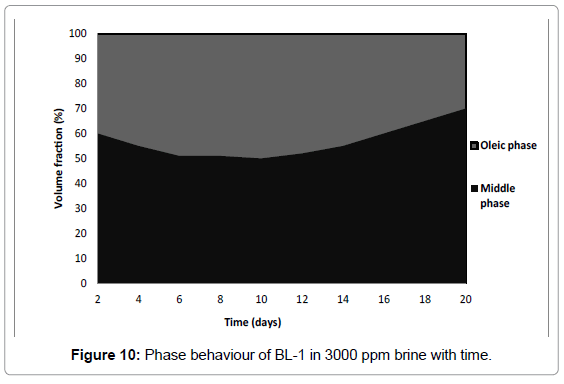
Phase behaviour of BL have a strong effect with time as shown in Figures 9 and 10. In samples prepared with deionized water all oil was solubilized (Figure 9) while in brine samples all water was solubilized (Figure 10). Therefore BL-1 solubilized all oil and deionized water and formed a 100% microemulsion with time. Authors [42,38] recorded for surfactant in deionized water/crude oil formulation that all crude oil and some of the water was solubilized. The difference in results can be explained by the different nature of crude oil as compared to n-octane.
The phase behaviour of BL-1 in brine was consistent with what was observed in 0.1-0.5 Molar Na2CO3 brine at a lower surfactant concentration [38,39]. As a general trend, low IFT values [i.e., for BL-1, IFT is 0.008 mN/m (Table 3)] appear when middle phase microemulsions form with a size range in the order of 5−50 nm in drop radius [43-45]. The existence of a middle-phase microemulsion is an indication of hydrophillic-lipophilic balance [45,46]. Considering the fairly low concentration of BL-1, this is very effective.
One test was run at elevated temperature (75°C) to investigate the effort of temperature on IFT. For a 0.18% BL-6 formulation in deionized water against n-octane, an IFT of 1.45 mN/m was measured as compared to 2.01 mN/m at 25°C (Table 3). Increasing temperature reduced IFT.
IFT measurements-low BL concentrations
IFTs were measured at 3000 ppm at the expected optimal salinity of the formation water of Nahorkatiya oil reservoir. The measurements used n-octane as oleic phase and were performed at ambient conditions. Selected low IFT are tabulated in Table 3. In most cases low IFTs were reached with low (0.05-0.10 wt%) to zero cosolvent concentration. Low IFTs at low concentration are attractive for field application.
Surfactants BL 9, 10 and 11 were included later as they showed relatively low adsorption on kaolinite clay (Table 5). Samples BL 12, 13 and 14 were also added later as they were locally available from Nowgong Paper Mill at Jagiroad, Assam. The IFT results indicated that optimal salinity of some of these 6 BL surfactants may exceed even 10,000 ppm. None of the measured values were specially low as compared to the best BL system reported earlier. IFTs decreases with increasing salinity.
The IFT of BL-2 of 0.003 mN/m was the best followed by B-8 of 0.004 mN/m and B-5 of 0.005 mN/m at 6000 ppm NaCl without 2-propanol addition. BL-1 showed an IFT of 0.008 mN/m over a wide range of salinity, so BL-1 is presumed to be the most suitable for EOR application. In some cases the IFT did not increase monotonically with a decrease in the BL concentration. This behaviour could be associated with experimental errors in the IFT measurement and/or reflect that the optimal salinity can shift with a change in surfactant concentration.
IFT measurements for crude oil systems
All the previous IFT results were measured against n-octane as oleic phase. While n-octane can be replaced by crude oil for IFT studies/ phase behaviour [1], measurement with actual crude oil is more relevant. Two crude oil samples were taken, the Bhogpara oil reservoir crude oil sample was of density 850 kg/m3 at 45°C and Nahorkatiya oil reservoir crude oil sample was of density 808 kg/m3 at 45°C. A test temperature of 45°C and a brine concentration of 3000 ppm, which is the condition of oil reservoir of Upper Assam basin. The Nahorkatiya oil was light and waxy. The measured IFT results for different BL surfactants and two crude oils and n-octane at 45°C are listed in Table 4. All measurements were conducted at ambient pressure. Results indicate that IFT values are lower for crude oils than for n-octane at identical temperature conditions. The IFT values could be even lower versus these crude oils if the brine salinity would be adjusted to be at their optimal conditions. This is based on previous results of this study where n-octane and BL at ambient temperature show an optimal salinity of several ppm NaCl.
| Surfactant | Brine Salinity (ppm) | IFT for Nahorkatiya crude oil (mN/m) | IFT for Bhogpara crude oil (mN/m) | IFT for n-octane (mN/m) |
|---|---|---|---|---|
| BL-2 | 3000 | n.d | 0.94 | n.d |
| BL-4 | 3000 | 0.49 | 0.22 | n.d |
| BL-1 | 3000 | 0.72 | 0.23 | n.d |
| BL-8 | 3000 | n.d | 0.65 | n.d |
| BL-15 | 3000 | n.d | 0.31 | n.d |
| BL-14 | 3000 | n.d | 0.69 | n.d |
| BL-4 | 1000 | 0.11 | n.d | 0.14 |
| BL-4 | 3000 | 0.003 | n.d | 0.007 |
| BL-4 | 4000 | 0.078 | n.d | 0.22 |
Table 4: IFT for BL (0.18 wt %) in brine against crude oils and n-octane at 45°C.
Adsorption tests on kaolinite clay
Adsorption was measured as a function of surfactant contration Ceq and showed three trends:
• Equilibrium surfactant adsorption G increased with increase of bulk surfactant concentration Ceq. There were only three exceptions with BL-10, 3 and 4. For BL 10 and 3, there were adsorption maxima at a bulk concentration of about 0.18 wt %. For BL-4, adsorption decreased with increase of surfactant concentration. The adsorption results for the BL are in Table 5. Adsorption data for the other BL can be found in [30,31].
| Surfactant | Ceq=Equilibrium concentration [wt% i.e., g/g] | Avg Ceq [g/g] | G=equilibrium surfactant adsorption [wt% i.e., g/g] | Avg G [g/g] |
|---|---|---|---|---|
| BL-2 | 0.39 | 0.963 | 0.0139 | 0.025 |
| BL-2 | 0.85 | 0.0209 | ||
| BL-2 | 1.65 | 0.0395 | ||
| BL-3 | 0.44 | 0.813 | 0.0032 | 0.006 |
| BL-3 | 1.03 | 0.0083 | ||
| BL-3 | 0.97 | 0.0075 | ||
| BL-4 | 2.6 | 0.559 | 0.0064 | 0.004 |
| BL-4 | 0.45 | 0.0007 | ||
| BL-4 | 1.20 | 0 | ||
| BL-5 | 2.42 | 1.193 | 0 | 0.029 |
| BL-5 | 0.29 | 0.021 | ||
| BL-5 | 0.87 | 0.0378 | ||
| BL-6 | 1.65 | 1.237 | 0.0648 | 0.048 |
| BL-6 | 0.34 | 0.0329 | ||
| BL-6 | 1.72 | 0.0469 | ||
| BL-1 | 0.42 | 1.033 | 0.0665 | 0.036 |
| BL-1 | 0.92 | 0.0107 | ||
| BL-1 | 1.76 | 0.0320 |
Table 5: Adsorption* of BL on kaolinite clay from 3000 ppm NaCl aqueous solution
• Generally adsorption decreased with an increase of the number of SO3H-groups in the surfactant molecule.
Mohanty and Adibhatla et al. found that adsorption at kaolinite/liquid interface have been previously studied [47-51]. Adsorption onto minerals at low bulk surfactant concentration is generally due to the interaction between the polar head of the amphiphile molecule and some specific sites of the surface e.g. H-bonds or electrostatic forces. For higher bulk surfactant concentrations, aggregates are formed at the interface as a result of lateral interactions between hydrophobic chains. This aggregation is due to the same forces as those responsible for bulk micelle formation. In BL surfactant molecules, more SO3H-group make the surfactant more hydrophobic, the interaction between hydrophobic chains therefore become stronger, which weakens the interaction between the polar head of the surfactant molecules and specific sites on the kaolinite clay surface. This might explain a decrease of adsorption of BL surfactants with an increase of SO3H-groups in their molecules.
Adsorption of surfactant on mineral surfaces also depends on many other factors. Several physicochemical processes can be expected to occur, such as hydrolysis of surface species, ion-exchange, electrostatic adsorption and dissolution of the clay constitute, and adsorption or precipitation of resultant complexes.
Studies of surfactant adsorption from aqueous solutions onto kaolinite clay, an adsorption maximum [52-54] was found in some cases. When aqueous surfactant solution contacts with kaolinite clay, the concentration of Ca2+ and Na1+ in the solution increases due to the ion-exchange process. At low surfactant concentration, surfactant molecules exist in the solution as monomers. The adsorption of surfactant increases with the increase in concentration. At high concentration, when the adsorption density of surfactant on kaolinite surface is high enough to make the concentration product of the adsorbed surfactant anions and Ca2+ and Na1+greater than their solubility products, a precipitate will form on the kaolinite surface. However with further increase in surfactant concentration in aqueous solution, surfactant molecules aggregates and micelles are formed in the bulk solution, which enhance the solubility of precipitates. Consequently, the micelles compete with the surface of kaolinite for the adsorbed molecules and dissolve some of the precipate on the surface. As a result adsorption decreases at high concentrations.
The adsorption levels for the BL surfactants onto kaolinite (5-50 mg/g) are comparable or greater than some other anionic surfactants tested under similar conditions. There are reports of adsorption on kaolinite of 5-50 mg/g for a series of linear alkyl benzene sulfonates, and another study for petroleum sulfonate shows 5-50 mg/g [54].
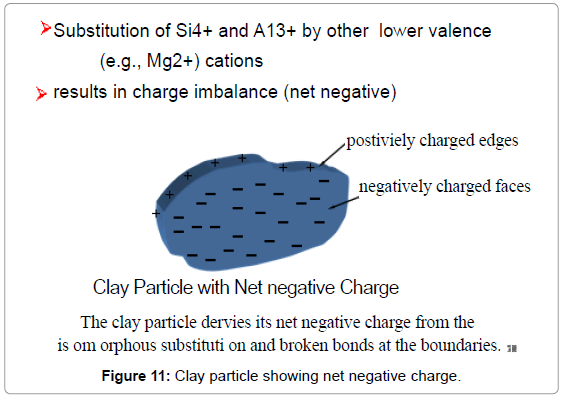
Clay minerals which have layered structures consisting of sheets of Feldspar (KAlSi3O8–NaAlSi3O8–CaAl2Si2O8) [55,36] and sheets of AlO6 Silicon tetrahedron linked with each other by means of shared oxygen ions were negatively charged under most natural conditions mainly due to the substitution, for example, of Al3+ for Si4+ in the silica tetrahedron. This charge is internal to the structure and is not dependent on solution concentration [56]. The edges of the clay particles would exhibit pH-dependent charge characteristics due to hydroxylation and ionization of the broken Si-O and Al-O bonds at the edges. The point of zero charge of the clay determines the algebraic sum of face and edge charges (Figure 11). It is to be noted that at the point of zero charge both the sides and faces would be charged and thus possess adsorptive properties that other minerals might not possess at their points of zero charge [57].
Enhanced oil recovery
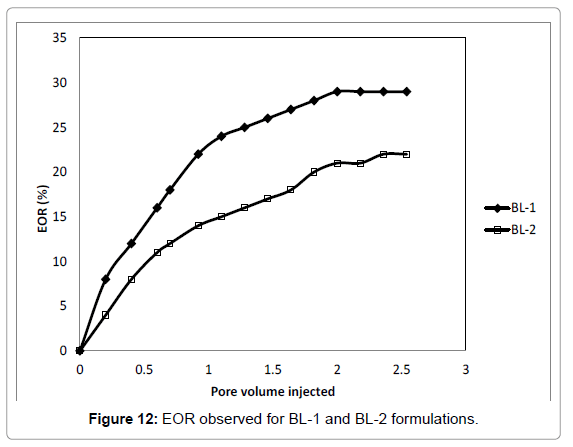
Based on the IFT and adsorption test, BL-1 and BL-2 was selected for EOR. The brine salinity was taken as 3000 ppm. The flooding test was done as per Gogoi and Das. The EOR curves are shown in Figures 12. After BL flooding the EOR was found to be 29% of the water flood residual oil in case of BL-1 and 22% in case of BL-2 shown in Figure 12. The EOR for BL-2 is was mediocre. Both the BL formulations were efficient in terms of water flood residual oil recovery with brine concentration of 3000 ppm. Adibhatla and Mohanty [58] recorded an oil recovery of 40-60% initial oil in place after 100 days of spontaneous imbibition of 0.18 wt% surfactant (in 0.3 Molar Na2CO3 brine) into outcrop limestone. This is similar to EOR for BL-1 even though the displacement mechanism and porous media were different.
Conclusion
The IFT, phase behaviour and solid adsorption of 15 samples of BL formulations were studied. These are vital data for designing EOR projects and selecting suitable surfactant formulation. The key findings include:
• BL surfactants at concentrations as low as 0.18 wt% can create an IFT as low as 0.002 mN/m between brine and n-octane or crude oil.
• Higher the salinity of the aqueous phase lower will be the IFT between the aqueous and the oleic phases
• Adsorption of these surfactants on kaolinite clay decreased with an increase of the number of SO3H-group. SO3H-were effective in terms of EOR (from 20-30 % additional oil was produced) with surfactant concentration as low as 0.18%.
• The average equilibrium surfactant adsorbed in case of BL-1 was 0.036 g/g (equilibrium surfactant adsorbed) on kaolinite at equilibrium concentration of 1.03 g/g while the average equilibrium surfactant adsorbed in case of BL-2 was 0.025 g/g (equilibrium surfactant adsorbed) on kaolinite at equilibrium concentration of 0.96 g/g.
• EOR observed for BL-1 in higher than from BL-2 formulations.
Acknowledgements
This work received the financial support from the University Grants Commission, Government of India in the form of a major research project [F.No.37-140/2009 (SR)]. The author thanks Oil India Limited, Duliajan, and Regional Medical Research Centre, Lahoal, Assam for their help in this work.
Nomenclature
IFT Interfacial tension (mN/m)
SO3H- sulfonic acid group
HBL Hydrophillic-lipophillic balance
EOR Enhanced oil recovery
NaCl Sodium Chloride
Na2CO3 Sodium carbonate
Ca2+ Divalent calcium
Na1+ Monovalent sodium
Na1+ Monovalent sodium
Al3+ Trivalent aluminium
Si4+ Quadravalent silica
SiO4 Silicon tetrahedron
AlO6 Aluminium octahedron
Si-O Silica oxygen bond
Al-O Aluminium oxygen bond
ppm Parts per million
wt% Weight %
Sor Residual oil saturation
Swc Connate water saturation
G Equilibrium surfactant adsorption (mg/kg)
Ceq Bulk surfactant concentration (wt%)
Ncap capillary number (-)
PV Pore vol (-)
SEM Scanning Electron Microscope
%wt gm/gm
References
- Green DW, Willhite GP (1998) Enhanced Oil Recovery. SPE pub 978-1-55563-077-5.
- Reppert TR, Bragg JR, Wilkinson JR, Snow TM, Maer NK, et al. (1990) Second Ripley surfactant flood pilot test, April 22-25, proceedings SPE 20219, SPE/DOE Improved Oil Recovery Symposium, Tulsa, OK.
- Maeker JM, Gale WW (1992) Surfactant flood processes design for Loudon. SPERE 36-44.
- Ferrell HH, Gregory MD, Borah MT (1984) Progress report: Big Muddy field low tension flood demonstration project with emphasis on infectivity and mobility, April 15-18, proceedings SPE 1268, SPE/DOE Improved Oil Recovery Symposium, Tulsa, OK.
- Huh C, Lange EA, Cannella WJ (1990) Polymer retention in porous media, proceedings SPE 20235, SPE/DOE, April 22-25, Improved Oil Recovery Symposium, Tulsa, OK.
- Cole EL (1988)Â An evaluation of the Big Muddy field low-tension flood demonstration project, December, a, DOE/BC/10830-9, US DOE, Bartlesville, OK, USA.
- Cole EL (1988) An evaluation of the Robinson M-1 commercial scale demonstration project of enhanced oil recovery by micellar-polymer flood, December. report DOE/BC/10830-10, US DOE, Bartlesville, OK, USA.
- Pitts MJ (2001) Recent Field work in the United States with Alkali-Surfactant, proceedings of the NSF Workshop, Use of Surfactants for Improved Petroleum Recovery 22-23.
- Taugbol (1995) Dissociative surfactant-polymer interaction with positive effect on oil recoveryColl. and Surf. A: Physicochemical and Engg. Aspects 103: 83.
- Austad T (1993) A Review of retention mechanisms of ethoxylatedsulfonates in reservoir cores. 2-5 March Proceedings SPE 25174, SPE Symposium on Oilfield Chemistry, New Orleans.
- Aoudia M, Al-Shibli MN, Al-Kasimi LH, Al-Maamari R, Al-Bemani A (2006) Novel surfactants for ultralow interfacial tension in a wide range of surfactant concentration and temperature. J Surfactants & Detergents 9: 287-293.
- Moulu JC (1985) Behaviour of oil ganglia displaced by surfactant solution in porous medium. J Physique Lett.: 1-97.
- Rivas H, Gutierrez X, Ziritt JL, Anton RE (1997) Microemulsion and optimal formulation occurrence in pH-dependent systems as found in alkaline-enhanced oil recovery. In Industrial Applications of Microemulsions. Ed. Solans, C. and Kunieda H. Surfactant Science Series, Marcel Dekker, New York 305–329.
- BaviereM, Canselier JP (1997) Microemulsion in the chemical EOR process, In Industrial Applications of Microemulsions, Ed. Solans C and Kunieda H. Surfactant Science Series, Marcel Dekker, New York 66: 331–353.
- Pillai V, Kanicky JR, Shah DO (1999) Applications of microemulsions in enhanced oil recovery,InHandbook of Microemulsion Science and Technology, Ed. Kumar, P. and Mittal, K. L., Marcel Dekker, New York 743–735
- Willson Jr. LA (1977) Physicochemical environment of petroleum reservoirs in relation to oil recovery systems In Improved Oil Recovery by Surfactant and Polymer Flooding, Ed. Shah, D.O. and Schechter, R.S., Ac. Press, New York 1–26.
- Morgan JC, Schechter RS, Wade WH (1977) Recent advances in the study of low interfacial tensions, In Improved Oil Recovery by Surfactant and Polymer Flooding, Shah DO and Schechter RS, Ac. Press, New York 101–18.
- GogartyWB, Tosch WC (1968) Miscible-Type Water-flooding: Oil Recovery with Micellar Solutions. JPT: 1407-14.
- Danielson HH, Paynter WT, Milton Jr. HW, Danielson HH, Paynter WT, et al. (1976) Tertiary Recovery by the MarafloodProcess in The Bradford Field. JPT 28: 129-138.
- Altunina LK, Kuvshinov VA (2007) Physicochemical methods for enhancing oil recovery from oil fields. Russian Chem Rev 76: 971-987.
- Steinborn R, Flock D.L (1983) The rheology of heavy crude oils and their emulsions. JCPT38-52.
- Iglauer S, Wu Y, Shuler PJ, Tan-g Y, Goddard WA (2009) Alkyl polyglycoside-alcohol cosolvent formulations for improved oil recovery: Coll. and Surf.: A Physicochem. Eng Aspects 339: 48–59.
- Gogoi SB, Gogoi KD (2007) Emulsion Flow in Bhogpara Core Sample with emphasis on Enhanced Oil Recovery. Indian J of Pet Geology 14: 55-77.
- Gogoi SB (2008) Evaluation of Lignin Based Surfactants for Enhanced Oil Recovery of Naharkotiya Porous Media. J Indian ChemEng 50: 47-55.
- Gogoi SB (2009) Adsorption of non-petroleum base surfactant on reservoir rock. J Current Science 97: 1059-1063.
- Gogoi SB (2010) Characterization of Vesicle for Enhanced Oil Recovery. Indian J of ChemTech 282-290.
- Gogoi SB (2011) Adsorption–desorption of surfactant for Enhanced oil recovery.Transport in Porous Media 90: 589-604.
- Gogoi SB, Das BM (2012) Use of an effluent for enhanced oil recovery. Indian J Chem Tech 9: 366-370.
- Bikkina PK, Uppaluri R, Purkait MK (2013) evaluation of Surfactants for the Cost Effective Enhanced Oil Recovery of Assam Crude Oil Fields. J Pet Sc and Tech 31: 1–8.
- Goddard WA, Tang Y, Shuler PJ, Blanco M, Jang SS, et al. (2004) Lower Cost Methods for Improved Oil Recovery (IOR) via Surfactant Flooding. DOE Project DE-FC 26-01BC15362, Final Report, September.
- Wu Y, Shuler PJ, Blanco M, Tang Y, Goddard WA (2005) A study of branched, alcohol propoxylate sulphate surfactants for improved oil recovery. 9-12.
- Wu Y, Iglauer S, Shuler PJ, Tang Y ,Goddard WA (2010) Alkyl Polyglycoside–Sorbitan Ester formulations for Improved Oil Recovery.Tenside Surf. Det 47: 280-287.
- Aoudia M, Wade WH, Weerasooriya U (1996) Optimum microemulsions formulated with propoxylatedGuerbet alcohol and propoxylatedtridecyl alcohol sodium sulphates. J. Dispersion Sc. Technol 16: 115-135.
- Kumar K, Dao EK, Mohanty KK (2008) Atomic force microscopy study of wettability alteration by surfactants. SPEJ 137-145.
- Varadaraj R, Bock J, Valint P, Zushma S, Thomas R, et al. (1991) Fundamental interfacial properties of alkyl-branched sulphate and ethoxy sulphate surfactants derived from Guerbet alcohols. 1. Surface and instantaneous interfacial tensions. J Phys Chem 95-1671.
- Gogoi SB (2007) Study on Emulsion Flow through Porous Media in relation to Enhanced Oil Recovery (EOR) Processes of O.I.L, Duliajan.Ph.D Thesis, Dibrugarh University, Dibrugarh, Assam, India, 101-111.
- Sunwoo CK, Wade WH (1992)Â Optimal surfactant structures for cosurfactant free microemulsion systems. I. C16 and C14 Guerbet alcohol hydrophobes. J Dispersion ScTechnol 13: 491-514.
- Mohanty KK (2006)Â Dilute surfactant methods for carbonate formations. US-DOE final report, DE-FC26-02NT 15322.
- Kelkar M (2003) Exploitation and Optimization of reservoir performance in hunton formation Oklahoma. US-DOE annual technical report, DE-FC26-00NTI5125.
- Mitchell DJ, Ninham BW (1981) Micelles, vesicles and microemulsions. J ChemSocFaraday Transactions 2: Molecular and Chemical Physics, 77: 601-629.
- Sabatini DA, Acosta E, Harwell JH (2003) Linker molecules in surfactant mixtures. Current opinion in Coll and Interface Sc8: 316-326.
- Seethepalli A, Adibhatla B, Mohanty KK (2004) Physicochemical interactions during surfactant flooding if fractured reservoirs. SPEJ: 411-418.
- Iglauer S, Wu Y, Shuler PJ, Blanco M, Tang Y, et al. (2004) Alkylpolyglycoside Surfactants for Improved Oil Recovery, April 17–21, Paper SPE/DOE 89472, SPE/DOE Improved Oil Recovery Symposium, Tulsa, OK.
- Iglauer S, Wu Y, Shuler PJ, Tang Y, Blanco M, et al. (2004) The influence of Alcohol Co-surfactants on the Interfacial Tensions of Alkylglycoside Surfactant Formulations vs n-Octane, ACS 227th National Meeting, Division of Petroleum Chemistry, Anaheim, CA, USA.
- Healy RN, Reed RL (1977) Some physicochemical aspects of microemulsion flooding: A Review InImproved Oil Recovery by Surfactant and Polymer Flooding. Shah DO and Schechter RS, Ac. Press, New York 383-347.
- Huh C (1983) Equilibrium of a microemulsion that coexists with oil or brine. SPEJ, 23: 829-858.
- Tiberg F, Joensson B, Tang J, Lindman B (1994) Ellipsometry studies of self-assembly of nonionic surfactants at the silica-water interface: equilibrium aspects. Langmuir 10: 2294-2300.
- Luciani L, Doneyel R (1997) Adsorption of polydisperse surfactants on solid surfaces: an ellipsometri study. J Coll Interface Sc 188: 75-80.
- Bohmer M, Koopal LK, Janssen R, Lee EM, Thomas RK, et al. (1992) Adsorption of nonionic surfactants on hydrophilic surfaces, an experimental and theoretical study on the association of adsorbed layer. Languir 8: 2228-2239.
- Manne S, Schaeffe TE, Huo Q, Hansma PK, Morse D, et al. (1997) Gemini surfactants at solid-liquid interfaces: control of interfacial aggregate geometry. Langmuir 13: 6382-6387.
- Hanna HS, SomasundaranP (1977) Physico-chemical aspects of adsorption at solid/liquid interfaces. II: Mahogangsulfonate/Berea sandstone, kaolinite, In Improved Oil Recovery by Surfactant and Polymer Flooding, Ed. Shah, D.O. and Schechter, R.S., Ac. Press, New York.
- Yang CZ, Yan HK, Li GZ, Cui GZ, Yuan H (2002) Fundamental and advances in combined chemical flooding. Chinese Petroleum Press.
- Mukerjee P, Anavil A (1974) Adsorption of ionic surfactants to porous glass, exclusion of micelles and other solutes from adsorbed layers and the problem of adsorption maxima. ACS Symposium Series 8: 107-128.
- Barakat Y, El-Mergawy SA, El-Zein SM, Mead AI (1995) Adsorption of alkylbenzenesulfonates onto mineral surfaces. Ind J ChemTech 2: 162-166.
- Novosad J (1981)Â Adsorption of Pure Surfactant and Petroleum Sulfonate at the Solid-Liquid Interface. In Surface Phenomena in Enhanced Oil Recovery, Ed. Shah DO, Plenum Publishing, New York 675-694.
- Willhite GP, Dominguez JG (1977) Mechanism of polymer retention in porous media, In Improved Oil Recovery by Surfactant and Polymer Flooding, Ed. Shah, D.O. and Schechter, R.S., Ac. Press, New York 511-551.
- Parks GA, Chemical Oceanography, 1975-1989, 2ndedn. Ed. Riley JP and Skirrow G, Ac. Press, New York, 1: 241-308.
- Adibhatla B, Mohanty KK (2008) Oil recovery from fractured carbonates by surfactant-aided gravity drainage: laboratory experiments and mechanistic simultations. SPE Res Eval & Engg 119-130.
Citation: Gogoi SB (2014) Effluent as Surfactant for Enhanced Oil Recovery. Innovative Energy Policies 3: 109. DOI: 10.4172/2090-5009.1000109
Copyright: ©2014 Gogoi SB. This is an open-access article distributed under the terms of the Creative Commons Attribution License, which permits unrestricted use, distribution, and reproduction in any medium, provided the original author and source are credited.
Share This Article
Recommended Journals
Open Access Journals
Article Tools
Article Usage
- Total views: 16232
- [From(publication date): 12-2014 - Dec 18, 2024]
- Breakdown by view type
- HTML page views: 11592
- PDF downloads: 4640

