Research Article Open Access
Efficacy of ADC Histogram Analysis for Differentiating Thymic Cancer from Thymoma
Takafumi Yamada1, Kazuhiro Saito1*, Yoichi Araki, Jinho Park1, Jun Matsubayashi2, Toshitaka Nagao2, Masatoshi Kakihana3, Norihiko Ikeda3 and Koichi Tokuuye11Department of Radiology, Tokyo Medical University, Tokyo, Japan
2Department of Anatomic Pathology, Tokyo Medical University, Tokyo, Japan
3Department of Thoracic Surgery, Tokyo Medical University, Tokyo, Japan
- *Corresponding Author:
- Kazuhiro Saito
Department of Radiology, Tokyo Medical University
6-7-1 Nishishinjuku, Shinjuku-Ku
Tokyo 160-0023, Japan
Tel: +81-3-3342-6111
E-mail: saito-k@tokyo-med.ac.jp
Received date: January 17, 2017; Accepted date: February 04, 2017; Published date: February 10, 2017
Citation: Yamada T, Saito K, Araki Y, Park J, Matsubayashi J, et al. (2017) Efficacy of ADC Histogram Analysis for Differentiating Thymic Cancer from Thymoma. OMICS J Radiol 6:252. doi: 10.4172/2167-7964.1000252
Copyright: © 2017 Yamada T, et al. This is an open-access article distributed under the terms of the Creative Commons Attribution License, which permits unrestricted use, distribution, and reproduction in any medium, provided the original author and source are credited.
Visit for more related articles at Journal of Radiology
Abstract
Objective: An ADC histogram which was derived from the Region of Interest (ROI) set over the entire tumor may distinguish thymoma from thymic cancer and provide less bias and reproducibility. To evaluate the utility of ADC histogram analysis for differentiating thymic cancer from thymoma in comparison with conventional MRI findings.
Materials and methods: The subjects consisted of 31 patients with 27 thymomas and 4 thymic cancers. Diffusionweighted imaging was performed with b values of 100 and 800 s/mm2. Data acquired from each slice were summed up to derive voxel-by-voxel ADC values for the entire tumor and an ADC histogram was generated. The mean, standard deviation, minimum, maximum, 5th, 25th, 50th, 75th, 90th percentiles, mode, skewness, and kurtosis were derived from the ADC histogram. MRI findings were evaluated in terms of contour, capsulization, septum, hemorrhage, necrosis or cystic change, lymph node swelling, pleural effusion, major vascular invasion, and homogeneity.
Results: Significant differences were observed in the minimum ADC, contour, and major vascular invasion between thymoma and thymic cancer (p=0.010, p=0.03, and p=0.009, respectively). The sensitivities and specificities when the minimum ADC was 70 × 10−6 mm2/s or lower, when the contour was lobular or irregular, and when the presence of vascular invasion was considered to be thymic cancer were 75% and 93%, 100% and 37%, and 25% and 100%, respectively.
Conclusion: Minimum ADC was useful for distinguishing thymic cancer from thymoma, and it had an additional value to the routine MRI sequence.
Keywords
Thymic cancer; MRI; Diffusion-weighted imaging; ADC histogram
Introduction
The Masaoka staging system and the World Health Organization (WHO) histologic classification are usually used for classifying thymic epithelial tumors [1,2]. The Masaoka staging system is classified into 4 stages depending on the anatomic extent of the tumor and is mainly used for determining the surgical indication. Multidetector row CT is useful for evaluating the Masaoka staging system owing to its high spatial resolution [3]. On the other hand, the WHO histologic classification is based on the pathological findings. The prognosis of thymic cancer is markedly different from that of thymoma [1,4]. The 5-year survival rate of patients with stages III and IV thymoma treated by complete resection is reportedly about 90% [5], and a lower probability is described for patients with thymic cancer treated by complete resection [6]. Thymoma and thymic cancer are considered as different tumor entities [7]; therefore, it is useful to distinguish thymic cancer from thymoma pathologically using the WHO histologic classification when making a therapeutic strategy.
Recently, several studies have reported the usefulness of Diffusion- Weighted Imaging (DWI) for differentiating some tumor histological grades [8-10]. As tumor malignant grade increases, the cell density, irregularity of cell alignment and nuclear atypia increase. These pathological changes cause narrowing of the intercellular space and shrinkage of the cytoplasm, restricting diffusion. Similarly, thymic epithelial tumors have also been investigated in some DWI studies [11-13]. However, the method of Apparent Diffusion Coefficient (ADC) measurement is not consistent. As malignant grade increases in thymic epithelial tumor, the contour becomes irregular, and the presence of necrotic and cystic components occur frequently [2,14,15]. This gross pathological change may affect the ADC measurement. Consideration of tumor inhomogeneity is important in ADC measurement, as well as reproducibility. Therefore, an ADC histogram which was derived from the Region of Interest (ROI) set over the entire tumor has been proposed in some other organs, and its usefulness for tumor histological differentiation and malignant grading has been reported [8,9].
This study aimed to evaluate the utility of ADC histogram analysis for differentiating thymic cancer from thymoma in comparison with conventional MRI findings.
Materials and Methods
The institutional review board approved this retrospective study and informed consent was waived.
Subjects
First, patients who were diagnosed as having thymoma or thymic cancer after surgery within the past 5 years were recruited from the pathological database. Of these patients, those in whom the same DWI sequences were performed within 3 months before surgery were included in the study. Recurrence cases and rare histological cases such as micronodular thymoma with lymphoid stroma were excluded. Finally, the subjects consisted of 31 patients (11 men, 20 women; mean age, 60.5 years; median age, 62 years). The subjects had 27 thymomas (5 type A, 13 type AB, 3 type B1, 5 type B2, and 1 type B3) and 4 thymic cancers (squamous cell carcinoma). In the Masaoka grading system, thymomas were classified into the following: 5 stage I, 17 stage II, 4 stage III, and 1 stage IV, and thymic cancers were classified into the following: 1 stage II, 2 stage III, and 1 stage IV. The largest dimension of thymoma was 45 ± 24.5 mm (mean ± standard deviation) and that of thymic cancer was 55.3 ± 8.0 mm. Tumor size was measured by T2-Weighted Imaging (T2WI).
MR imaging protocol
MRI was performed using the 1.5-T superconductive system (Avanto; Siemens Medical Systems, Erlangen, Germany) with an eight-channel body matrix coil and a spine matrix coil. The maximum gradient strength was 45 mT/m and the slew rate was 200 T/ms.
The DWI parameters were as follows: repetition time/echo time☒(TR/TE), 3838-5730/66 msec; b-values, 100 and 800 s/mm2; matrix, 128 × 100%; FOV, 400 mm × 96.9%; slice thickness, 5.0 mm; intersection gap, 20%; average, 4; bandwidth, 2604 Hz; fat saturation, STIR; respiratory trigger technique, 2D-PACE. T2WI was performed under breath-holding and the parameters were as follows: TR/TE, 3000/96 msec; matrix, 320 × 70%; FOV, 400 mm × 65.6%; slice thickness, 5.0 mm; intersection gap, 20%; average, 1; bandwidth, 237 Hz. Noncontrast and contrast T1-weighted imaging (T1WI) was performed using a breath-hold two-dimensional gradient-echo sequence with the following parameters: TR/TE, 170/2.38 (in phase), 4.79 (out of phase) msec; matrix, 320 × 70%; FOV, 400 mm × 65.6%; slice thickness, 5.0 mm; intersection gap, 20%; average, 1; bandwidth, 460 Hz. For contrast enhanced-MRI, meglumine gadoterate (0.1 mmol/kg) was injected manually and immediately, followed by sterile saline flush (20 ml).
Measurement and evaluation
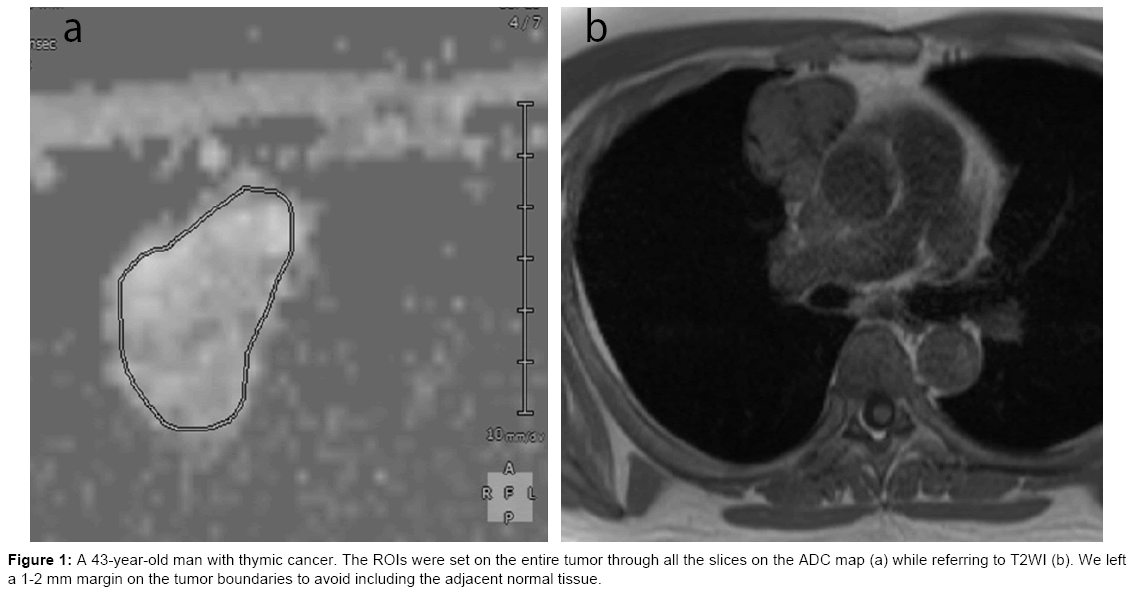
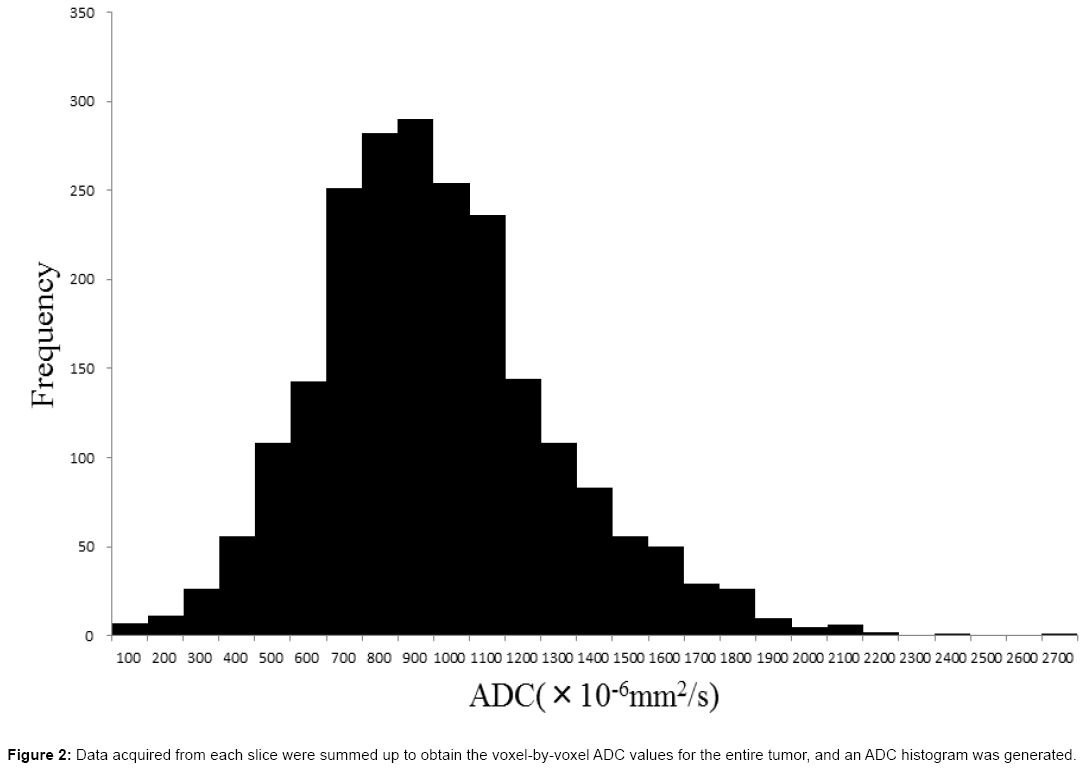
A radiologist whose specialty was chest imaging delineated the ROI of the thymic tumor on the ADC map while referring to T2WI using the Synapse Vincent workstation (Fuji Film). The ROIs were set on the entire tumor through all the slices, except for the slice detecting only a small part of the tumor to eliminate the partial volume effect. When we delineated the ROI, we left a 1-2 mm margin on the tumor boundaries to avoid including the adjacent normal tissue (Figure 1). Data acquired from each slice were summated to derive the voxel-by-voxel ADC values for the entire tumor using MATLAB (MathWorks, USA), and an ADC histogram was generated (Figure 2). The mean, standard deviation, minimum, maximum, 5th, 25th, 50th, 75th, and 90th percentiles, mode, skewness, and kurtosis were derived from the ADC histogram. To evaluate reproducibility, same radiologist delineated ROI twice at an interval of 3 months.
MRI findings were evaluated in terms of contour, capsulization, septum, hemorrhage, necrosis or cystic change, lymph node swelling, pleural effusion, major vascular invasion, and homogeneity in reference to previous reports [14,15]. Consensus reading was performed by radiologists with 4 and 24 years of experience whose specialty was chest imaging. Contour was classified into smooth, lobular, and irregular. The findings of lobular and irregular were regarded as positive for thymic cancer. Capsulization was classified into complete, partial, and none. The findings of complete and partial were regarded as positive for thymic cancer. Septum, hemorrhage, necrosis or cystic change, lymph node swelling, pleural effusion, and major vascular invasion were classified into present and absent. Present was regarded as indicating positivity for thymic cancer. Homogeneity was classified into homogenous and inhomogeneous, and inhomogeneous was regarded as positive for thymic cancer.
Statistical analysis
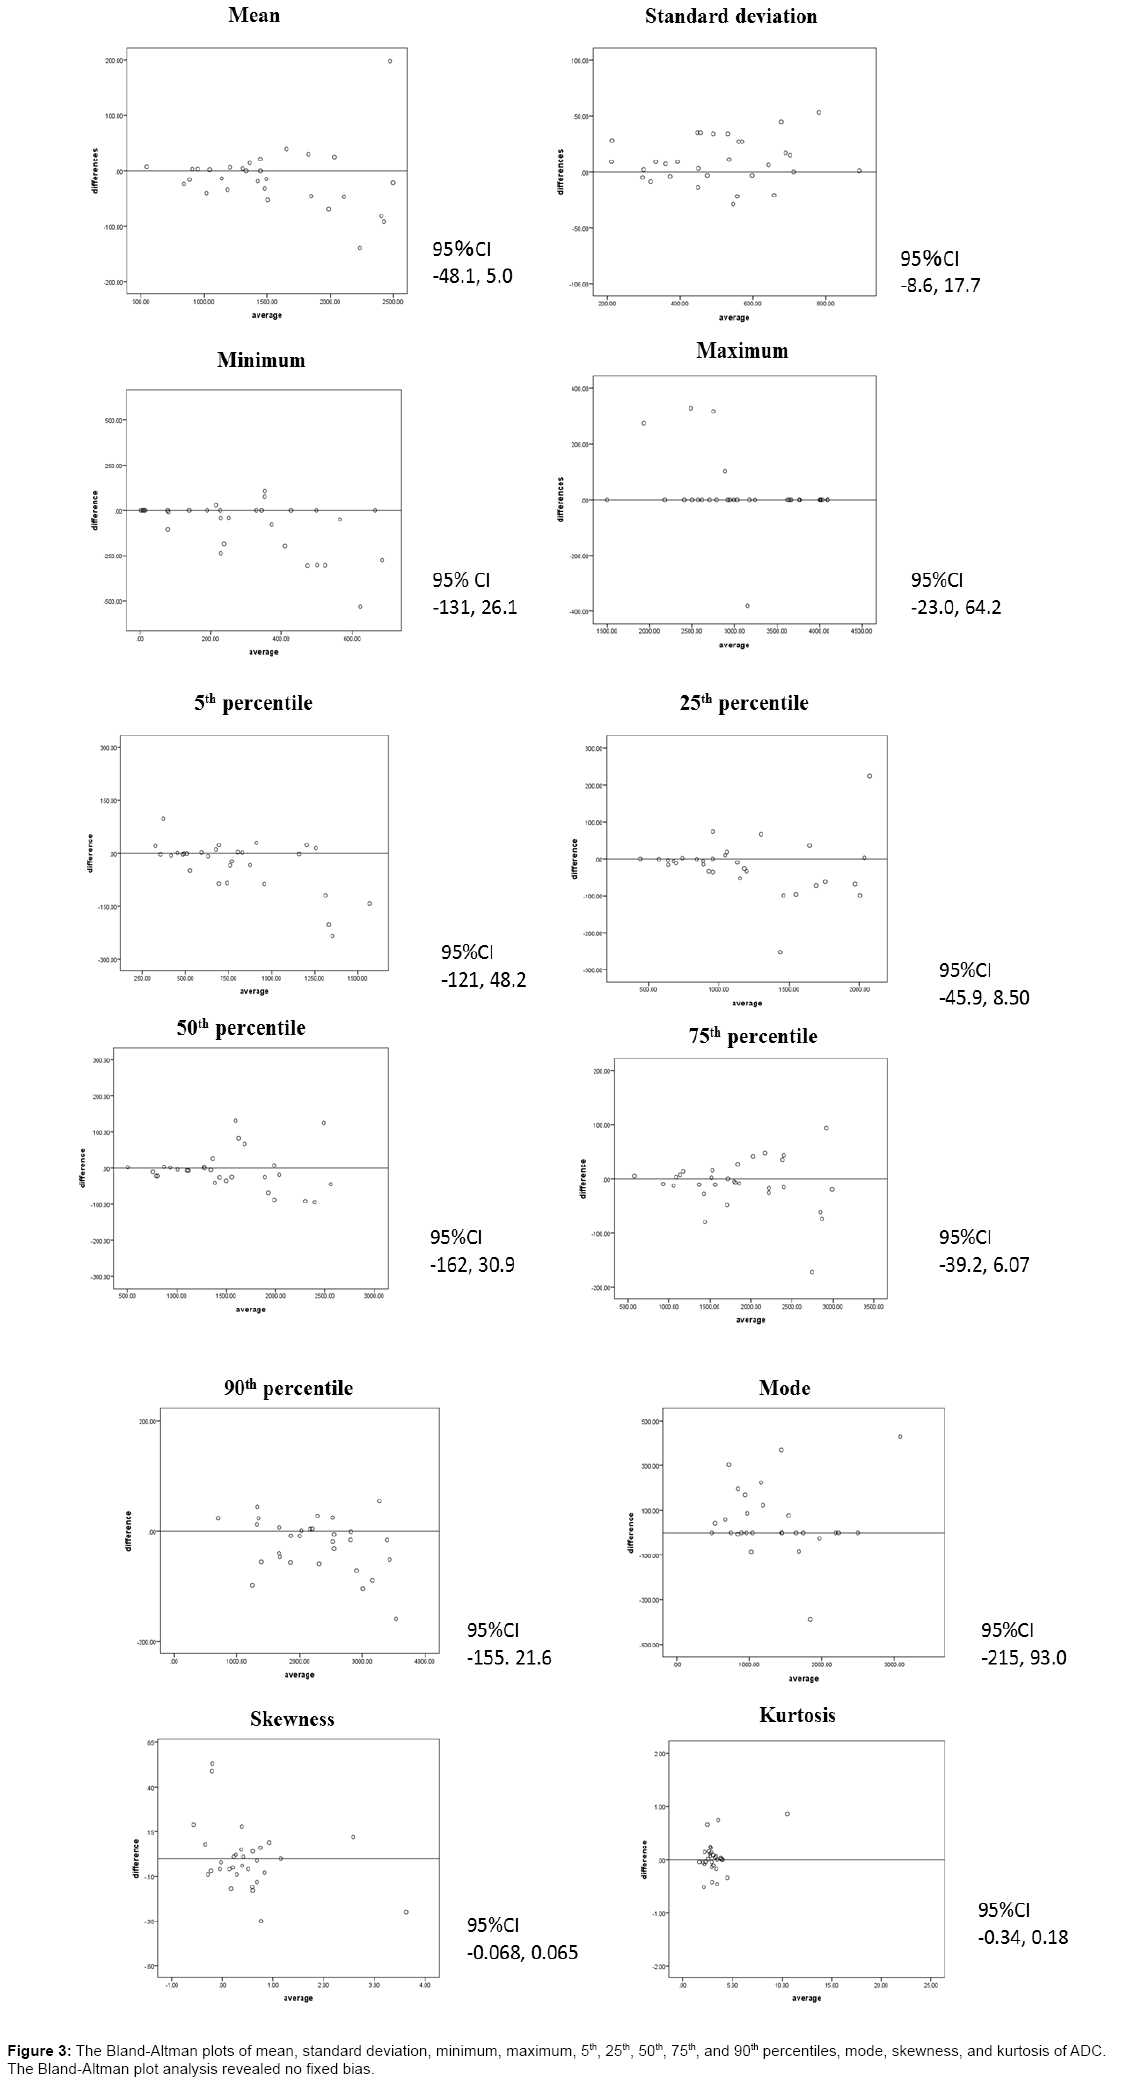
Data were shown as mean ± standard deviation. The differences between thymoma and thymic cancer in terms of the parameters of the ADC histogram and MRI findings were analyzed using the Mann–Whitney U test. A p-value of <0.05 was considered to indicate a statistically significant difference. Bland-Altman plot analysis was performed to evaluate reproducibility. ROC curves were created for the significant parameters based on these results, and thereafter the sensitivity and specificity were determined using the Youden index. Az values were calculated for diagnostic accuracy. All statistical analyses were performed using SPSS statistics software (version 22, SPSS) for Microsoft Windows.
Results
Of the 31 tumors, complete delineation of the entire tumor on the ADC map was achieved in 8 cases, and incomplete delineation was found in 23 cases because the tumor was too big to cover on DWI. The number of imaging slices covering the tumor was 6 ± 1.7.
Table 1 shows the analysis results of the ADC histogram parameters for each group at 2 times. A significant difference in the minimum ADC between thymoma and thymic cancer was observed at 2 times (p=0.010 and 0.023). The other parameters showed no significant differences. The sensitivity and specificity when the tumor had a minimum ADC of 70 × 10−6 mm2/s or lower and was considered to be thymic cancer were 75% and 93%, respectively. The Az value of the minimum ADC was 0.889. The Bland-Altman plots of mean, standard deviation, minimum, maximum, 5th, 25th, 50th, 75th, and 90th percentiles, mode, skewness, and kurtosis of ADC showed in Figure 3. The Bland-Altman plot analysis revealed no fixed bias.
| Thymoma | Thymic cancer | p-value | ||
|---|---|---|---|---|
| Mean | 1st | 1577 ± 554 (1358, 1796) | 1294 ± 341 (752, 1836) | 0.408 |
| 2nd | 1601 ± 568 (1377, 1826) | 1295 ±331 (768, 1822) | 0.408 | |
| Standard deviation | 1st | 521 ± 172 (453, 590) | 462 ± 133 (250, 674) | 0.476 |
| 2nd | 518 ± 173 (450, 587) | 447 ± 135 (232, 663) | 0.376 | |
| Minimum | 1st | 315 ± 201 (236, 394) | 63.3 ± 96.8 (-90.8, 217) | 0.010* |
| 2nd | 370 ± 246 (273, 467) | 99.8 ± 114.8 (-82.9, 282) | 0.023* | |
| Maximum | 1st | 3191 ± 722 (2905, 3476) | 2947 ± 481 (2181, 3712) | 0.345 |
| 2nd | 3182 ± 747 (2887, 3478) | 2840 ± 567 (1938, 3741) | 0.237 | |
| 5th percentile | 1st | 838 ± 373 (690, 985) | 604 ± 180 (318, 891) | 0.288 |
| 2nd | 875 ± 403 (715, 1034) | 639 ± 187 (341, 936) | 0.376 | |
| 25th percentile | 1st | 1202 ± 490 (1008, 1395) | 936 ± 203 (613, 1259) | 0.345 |
| 2nd | 1221 ±496 (1025, 1417) | 951 ± 213 (612, 1289) | 0.408 | |
| 50th percentile | 1st | 1528 ± 566 (1304, 1751) | 1281 ± 360 (708, 1854) | 0.476 |
| 2nd | 1605 ± 608 (1364, 1845) | 1270 ± 340 (728, 1811) | 0.376 | |
| 75th percentile | 1st | 1928 ± 681 (1658, 2197) | 1614 ± 487 (829, 2390) | 0.345 |
| 2nd | 1948 ± 701 (1671, 2226) | 1606 ± 469 (860, 2352) | 0.345 | |
| 90th percentile | 1st | 2278 ± 756 (1979, 2577) | 1896 ± 510 (1084, 2708) | 0.376 |
| 2nd | 2354 ± 786 (2043, 2665) | 1896 ± 502 (1098, 2695) | 0.288 | |
| Mode | 1st | 1384 ± 650 (1127, 1642) | 1036 ± 183 (744, 1328) | 0.441 |
| 2nd | 1320 ± 798 (1004, 1636) | 1356 ± 497 (564, 2147) | 0.887 | |
| Skewness | 1st | 0.52 ± 0.84 (0.19, 0.86) | 0.24 ± 0.28 (-0.20, 0.68) | 0.589 |
| 2nd | 0.52 ± 0.91 (0.16, 0.88) | 0.28 ± 0.25 (-0.12, 0.67) | 0.550 | |
| Kurtosis | 1st | 3.91 ± 3.78 (2.41, 5.40) | 3.00 ± 0.80 (1.73, 4.27) | 0.932 |
| 2nd | 4.00 ± 4.35 (2.28, 5.72) | 2.96 ± 0.77 (1.75, 4.18) | 0.887 | |
*p<0.05
Table 1: ADC histogram parameters of thymoma and thymic cancer.
Table 2 shows the MRI findings for each group. Significant differences in contour and major vascular invasion were observed between thymoma and thymic cancer (p=0.03 and p=0.009, respectively). The other MRI findings showed no significant differences. The sensitivity and specificity when the contour was lobular or irregular and when the tumor was considered to be thymic cancer were 100% and 37%, respectively. The sensitivity and specificity of the presence of vascular invasion were 25% and 100%, respectively. The Az values of contour and vascular invasion were 0.806 and 0.625, respectively.
| Thymoma | Thymic cancer | p-value | |
|---|---|---|---|
| Counter | |||
| Smooth | 17 | 0 | 0.030* |
| Lobular | 7 | 3 | |
| Irregular | 3 | 1 | |
| Capsulization | |||
| Almost complete | 5 | 0 | 0.442 |
| Partial | 12 | 2 | |
| None | 10 | 2 | |
| Septum | 15 | 1 | 0.262 |
| Hemorrhage | 2 | 0 | 0.580 |
| Necrosis or cystic change | 9 | 2 | 0.522 |
| LN swelling | 1 | 1 | 0.111 |
| Pleural effusion | 1 | 0 | 0.700 |
| Major vascular invasion | 0 | 1 | 0.009* |
| Homogeneity | |||
| Homogenous | 18 | 1 | 0.116 |
| Inhomogeneous | 9 | 3 | |
Table 2: Radiological findings of thymoma and thymic cancer.
Discussion
This study showed the usefulness of minimum ADC in differentiating thymic cancer from thymoma. Furthermore, the minimum ADC demonstrated a higher diagnostic accuracy than the MRI findings. Therefore, we believe that the addition of minimum ADC to the routine MRI sequence led to a higher diagnostic accuracy in terms of predicting not only the classification under the Masaoka grading system but also the pathological malignancy.
In the present study, we considered that mean ADC was not suitable for distinguishing thymic cancer from thymoma because it showed no significant difference and there was an obvious overlapping in the 95% confidence interval. Abdel Razek et al. reported that significant differences in mean ADC was observed among low-risk thymoma, high-risk thymoma, and thymic cancer. However, an overlapping of mean ADC was also observed between thymic cancer and thymoma [11]. Abdel Razek et al. supposed that the cellularity of high-risk thymoma and thymic cancer was higher than that of low-risk thymoma, and the cellularity affected the significant difference in mean ADC. However, we supposed that minimum ADC was more strongly reflected in hypercellularity than mean ADC.
Setting the ROI on the entire tumor enables the evaluation of inhomogeneity in the tumor, eliminates the arbitrariness, and maintains the reproducibility of the measurement. A few studies have reported the usefulness of prediagnosing thymic epithelial tumor by DWI. The different methods of delineating ROI and measuring ADC as previously reported have been attempted as follows. Mean ADC was calculated with the ROI placed at 3 consecutive slices on the ADC map including the largest tumor dimension [11], and minimum ADC was adopted after ROI placement on a single slice and ADC measurement 3 times [13]. Our method has more advantage in eliminating the effect of the measurement area than previous studies and this method revealed the reproducibility.
The prognosis of thymic cancer was worse than that of thymoma; therefore, distinguishing the 2 entities was important in making a therapeutic strategy [1,16]. A previous study has reported the differentiation among low-risk thymoma, high-risk thymoma, and thymic cancer by DWI. Recently, Weksler et al. have proposed that thymic cancer and thymoma should be classified as different entities [16]. Our present study was based on such proposal.
This study has some limitations. First, the number of subjects was small. In particular, the number of subjects with thymic cancer was small being an uncommon disease. Therefore, a multicenter study is necessary in the future. Second, the perfusion effect may affect the results of this study as we used a lower b value of 100 s/mm2. A lower b value of more than 200 s/mm2 was suitable for eliminating the perfusion effect. However, using a higher b value decreased the signal-to-noise ratio and deteriorated the spatial resolution of the ADC map. The relationship between the b value and the image quality was a trade-off; therefore, further study is necessary to decide the optimal parameter. Third, motion artifact and susceptibility artifact may have affected the results. We used the respiratory-triggered acquisition to reduce the respiratory motion; however, we did not use the cardiac-trigger acquisition because of extension of the acquisition time and deterioration of the throughput. We believe that the delineation of ROI for ADC measurement using the respiratory-trigger sequence alone was the acceptable method at present.
Conclusion
The minimum ADC was useful for differentiating thymic cancer from thymoma, and it had an additional value to the routine MRI sequence.
References
- Okuma Y, Hosomi Y, Watanabe K, Yamada Y, Horio H, et al. (2014) Clinicopathological analysis of thymic malignancies with a consistent retrospective database in a single institution: from Tokyo Metropolitan Cancer Center. BMC Cancer14:349.
- Arioka Y, Yamamoto Y, Hoshi M, Matsumoto K, Takamatsu M, et al. (2012) Pre-administration of L-tryptophan improved ADR-induced early renal failure in mice. Life Sci91:100-106.
- Hanioka N, Nonaka Y, Saito K, Negishi T, Okamoto K, et al. (2012) Effect of aflatoxin B1 on UDP-glucuronosyltransferase mRNA expression in HepG2 cells. Chemosphere89:526-529.
- Detterbeck FC (2006) Clinical value of the WHO classification system of thymoma. Ann Thorac Surg81:2328-2334.
- Kondo K, Monden Y (2003) Therapy for thymic epithelial tumors: a clinical study of 1,320 patients from Japan. Ann Thorac Surg76:878-884.
- Okereke IC, Kesler KA, Freeman RK, Rieger KM, Birdas TJ, et al. (2012) Thymic carcinoma: outcomes after surgical resection. Ann Thorac Surg93:1668-1672.
- Marx A, Rieker R, Toker A, Langer F, Strobel P (2011) Thymic carcinoma: is it a separate entity? From molecular to clinical evidence. Thorac Surg Clin21:25-31.
- Woo S, Cho JY, Kim SY, Kim SH (2014) Histogram analysis of apparent diffusion coefficient map of diffusion-weighted MRI in endometrial cancer: a preliminary correlation study with histological grade. Acta Radiol55:1270-1277.
- Kang Y, Choi SH, Kim YJ, Kim KG, Sohn CH, et al. (2011) Gliomas: Histogram analysis of apparent diffusion coefficient maps with standard- or high-b-value diffusion-weighted MR imaging--correlation with tumor grade. Radiology261:882-890.
- Saito K, Moriyasu F, Sugimoto K, Nishio R, Saguchi T, et al. (2012) Histological grade of differentiation of hepatocellular carcinoma: comparison of the efficacy of diffusion-weighted MRI with T2-weighted imaging and angiography-assisted CT. J Med Imaging Radiat Oncol56:261-269.
- Abdel Razek AA, Khairy M, Nada N (2014) Diffusion-weighted MR imaging in thymic epithelial tumors: correlation with World Health Organization classification and clinical staging. Radiology 273:268-275.
- Seki S, Koyama H, Ohno Y, Nishio M, Takenaka D, et al. (2014) Diffusion-weighted MR imaging vs. multi-detector row CT: Direct comparison of capability for assessment of management needs for anterior mediastinal solitary tumors. Eur J Radiol83:835-842.
- Usuda K, Maeda S, Motono N, Ueno M, Tanaka M, et al. (2015) Diffusion weighted imaging can distinguish benign from malignant mediastinal tumors and mass lesions: comparison with positron emission tomography. Asian Pac J Cancer Prev16:6469-6475.
- Sadohara J, Fujimoto K, Muller NL, Kato S, Takamori S, Ohkuma K, et al. Thymic epithelial tumors: comparison of CT and MR imaging findings of low-risk thymomas, high-risk thymomas, and thymic carcinomas. Eur J Radiol60:70-79.
- Tomiyama N, Johkoh T, Mihara N, Honda O, Kozuka T, et al. (2002) Using the World Health Organization Classification of thymic epithelial neoplasms to describe CT findings. AJR Am J Roentgenol 179:881-886.
- Weksler B, Dhupar R, Parikh V, Nason KS, Pennathur A, et al. (2013 ) Thymic carcinoma: a multivariate analysis of factors predictive of survival in 290 patients. Ann Thorac Surg 95:299-303.
Relevant Topics
- Abdominal Radiology
- AI in Radiology
- Breast Imaging
- Cardiovascular Radiology
- Chest Radiology
- Clinical Radiology
- CT Imaging
- Diagnostic Radiology
- Emergency Radiology
- Fluoroscopy Radiology
- General Radiology
- Genitourinary Radiology
- Interventional Radiology Techniques
- Mammography
- Minimal Invasive surgery
- Musculoskeletal Radiology
- Neuroradiology
- Neuroradiology Advances
- Oral and Maxillofacial Radiology
- Radiography
- Radiology Imaging
- Surgical Radiology
- Tele Radiology
- Therapeutic Radiology
Recommended Journals
Article Tools
Article Usage
- Total views: 3666
- [From(publication date):
February-2017 - Jul 03, 2025] - Breakdown by view type
- HTML page views : 2808
- PDF downloads : 858


