Effects of Water Flow on Water Quality of Largemouth Bass Culture Ponds
Received: 13-May-2019 / Accepted Date: 12-Jun-2019 / Published Date: 19-Jun-2019 DOI: 10.4172/2332-2608.1000291
Abstract
Induced water flows stimulating the fish to swim can improve growth and feed conversion efficiency of cultured fish, but the effects of this treatment on water qualities in fish pond is not known. In this 4-week experiment, the effect of water flow (1.0 m/s) on the levels of total nitrogen (TN), total phosphorus (TP), total ammonia nitrogen (AN), nitrite-nitrogen (NO2−-N), nitrate nitrogen (NO3−–N), ortho phosphorus (PO43--P), and total suspended solid particles (TSS) in water of ponds culturing largemouth bass (Micropterus salmoides) were explored. The results showed that as compared to the control, the recirculation flow could reduce the concentrations of TAN and PO 3--P in fish pond water, but increase the concentrations of TN, NO3--N, and TSS. There were temporal and spatial variations of water qualities in fish ponds under the condition of induced water flows, especially temporal changes of TN and TSS levels and spatial changes of NO2--N and PO 3--P levels. It indicated that the growth-improved recirculation flow treatment did not deteriorate the water qualities and largemouth bass could generally grow in such environment.
Keywords: Water flow; Water quality; Micropterus salmoides; Pond culture
Introduction
Current intensive fish culture conditions rely heavily on high stocking density and often do not allow fish to fully perform their natural swimming behavior [1]. Therefore, farmed fish generally lack the physiological benefits of swimming compared to their wild counterparts [2]. A number of studies have suggested that induced swimming can improve growth and feed conversion efficiency of cultured fish species [3,4]. Fish usually consume more material energy during exercise [5]. However, there is no report on the nitrogen and phosphorus loads of cultured fish after exercise training in fish farming ponds and on the effects of induced water flows on pond water qualities. Therefore, this study is to examine the water qualities of fish ponds influenced by induced water flows stimulating the fish to swim.
Material and Methods
Animals
Largemouth bass (Micropterus salmoides), with the weight of about 500 g, was the animal object in this study. Two square fish ponds in Nansha District, Guangzhou City, Guangdong Province (22°37'41.0"N 113°37'31.5"E) were used. One of the treatment pond and the other was the control pond. The pond area was 0.3 ha and the water depth was about 1.8 m; the density of each pond was about 30,000 fish per hectare. The study was carried out for 30 days in the pond. The feed composition was 9.12% moisture, 13.11% crude ash, 12.76% crude fat, and 50.56% crude protein. California ponds in each pond were fed twice a day, feeding 10 kg of feed each time.
At the beginning of the experiment and at the end of the experiment, 18 fish in each experimental group were anesthetized with MS-222 (100 mg/L) and the body weight and body length were measured. Calculate weight gain rate (WGR), specific growth rate (SGR), and fullness (CF). Calculated as follows:
Weight gain rate (WG,%)=(Wt-Wi)/Wi*100%
Specific growth rate (SGR,%/d)=(lnWt-lnWi)/T*100% Plumpness (CF,%)=Wt/L 3*100%
Where Wi and Wt represent initial body mass (g) and terminal body mass (g), respectively; T represents actual feeding days (d); L represents sample fish body length (cm).
Water flow driving method and sample collection
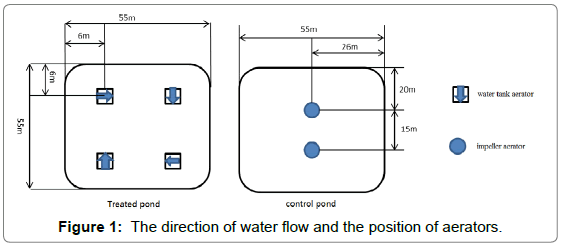
The treated pond was a flow treatment pond. Four water tank aerators (Shanghai, 2HP-380V/4P/50Hz, including 4 impellers with a diameter of 90 cm, speed 103 rpm, draft depth 2 cm) were placed in this pond. The water flow direction is perpendicular to each other Figure 1. After the aerator was turned on, the water flow in the pond formed a fixed flow direction and a steady flow rate. Two impeller aerators (Shanghai sputum, YYC-1.5, 1.5 KW) were placed in the control pond, and the continuous circulation was not formed after the aerator was turned on. The placement was shown in Figure 1. The water flow time was set from 8:00 to 17:00 daily, and the feed was fed twice in the morning and evening, from 6:00 to 7:00 and from 18:00 to 19:00.
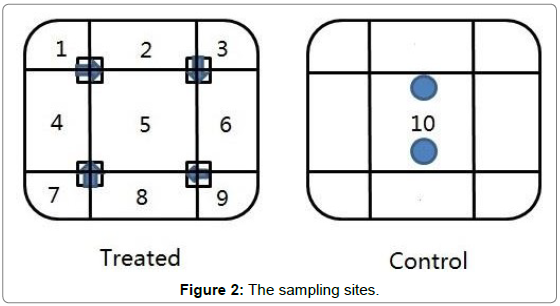
There were six times for sampling from December 13, 2017 to January 13, 2018. 1L surface water was taken at the sampling site 1-site 9 in the treatment pond and two samples were collected in the control pond (Figure 2).
Measurement of water quality parameters
The samples were filtered through Whatman glass filter paper GF/F and analysed for total nitrogen (TN), total phosphorus (TP) and inorganic nutrients (NO3-N, NO2-N, NH4-N, and PO4-P) and total suspended solids (TSS). Water quality were analysed according to the procedures described in the American Public Health Association [6,7] and also as modified by Boyd and Tucker [8].
Statistics
The experimental data were statistically analyzed using R and SPSS19.0, and Minitab16. If the data conformed to the normal distribution (tested by Shapiro-Wilk, Kolmogorov-Smirnov, and Anderson-Darling methods), t test was performed; if the data did not conform to the normal distribution, Mann-Whiney U test was used. The water quality analysis chart was drawn using GraphPad Prism 7, and the position distribution map was drawn using Golden. Soft. Surfer 8.
Results
Effects of water stimulation on the growth of largemouth bass
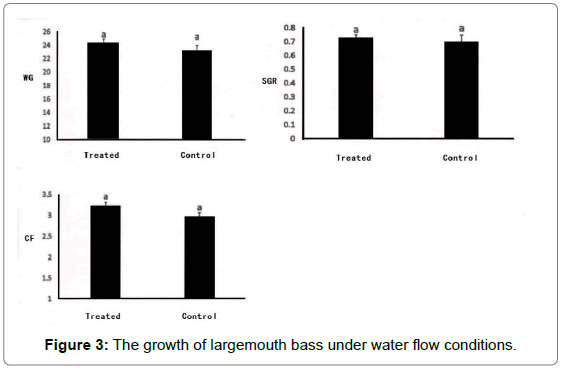
The growth data of the bigmouth bass is shown in the Figure 3 for the weight gain rate, the specific growth rate and the fullness, the experimental water flow treatment group is larger than the flow water pond, but the difference is not obvious (p>0.05).
Comparison of the influence of flowing water on the water qualities of fish ponds
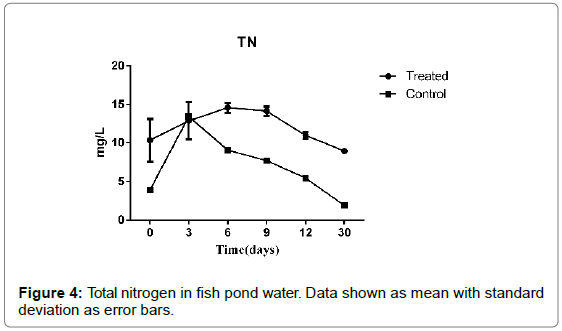
Total nitrogen: In the culture process, the average concentration of total nitrogen were shown in Figure 4. The total nitrogen concentration in the experimental pond was higher than that in the control pond, and the difference was significant (p<0.05). With the prolongation of the culture time, the total nitrogen concentration in the water increased first and then decreased.
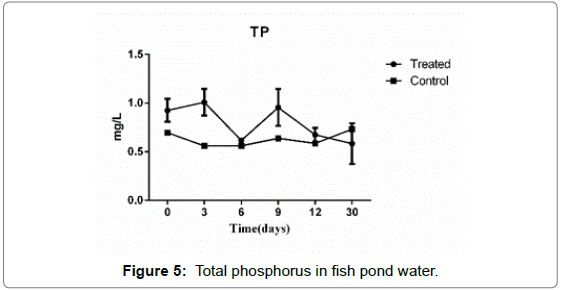
Total phosphorus: In the culture process, the concentration of total phosphorus in the pond water was shown in Figure 5. The total nitrogen concentration in the experimental pond was generally higher than that in the control pond, but the difference was not significant (p>0.05).
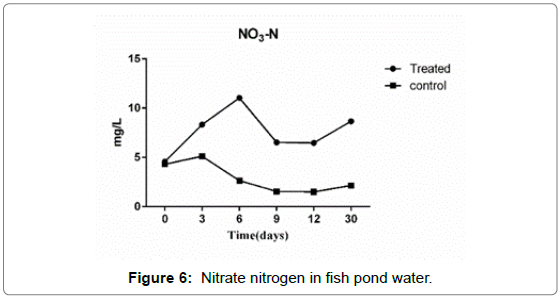
Nitrate nitrogen: The average concentration of nitrate nitrogen was shown in Figure 6. The nitrate nitrogen concentration in the experimental pond was generally higher than that in the control pond, and the difference was significant (p<0.05).
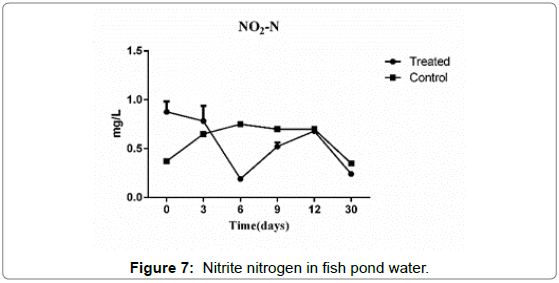
Nitrite nitrogen: The average concentration of nitrite nitrogen was shown in Figure 7. The nitrite nitrogen concentration in the experimental pond was generally higher than that in the control pond, but the difference was not significant (p>0.05).
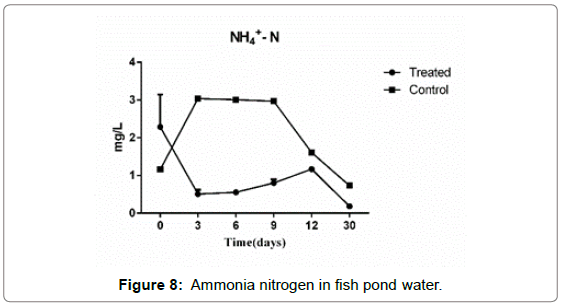
Ammonia nitrogen: The average concentration of ammonia nitrogen was shown in Figure 8. The ammonia nitrogen concentration in the experimental pond was generally lower than that in the control pond, and the difference was significant (p<0.05).
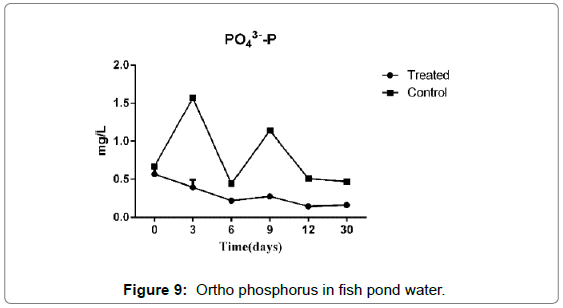
Ortho phosphorus: The average concentration of ortho phosphorus was shown in Figure 9. The concentration of ortho phosphorus in the experimental pond was generally lower than that in the control pond, and the difference was significant (p<0.05).
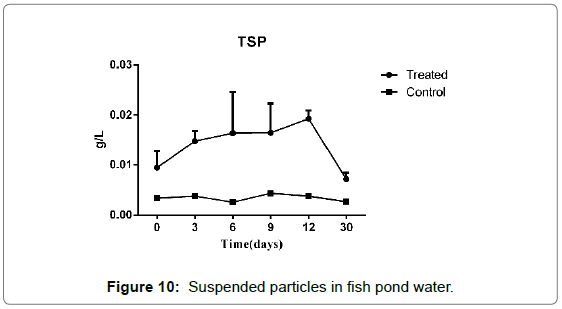
Suspended particles: The average concentration of suspended solid particles was shown in Figure 10. The concentration of suspended solids in the experimental pond was generally higher than that in the control pond, and the difference was significant (p<0.05).
Temporal and spatial changes of water qualities in aquaculture ponds under water flow conditions
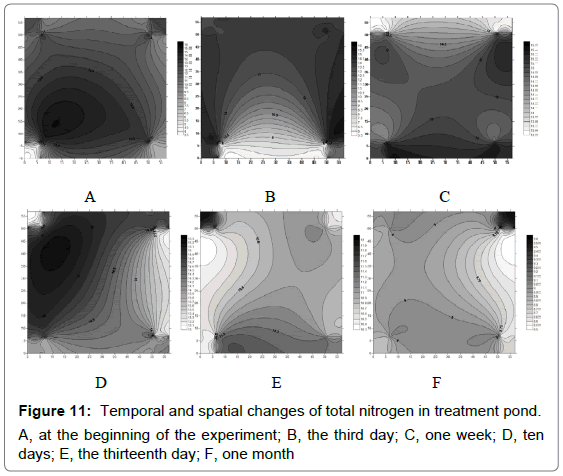
Total nitrogen: Temporal and spatial changes of total nitrogen concentration in treatment pool were shown in Figure 11. At the beginning of the experiment, the total nitrogen concentration in the middle of in the pond was higher than other parts. One month later, the regions total nitrogen was generally averagely distributed.
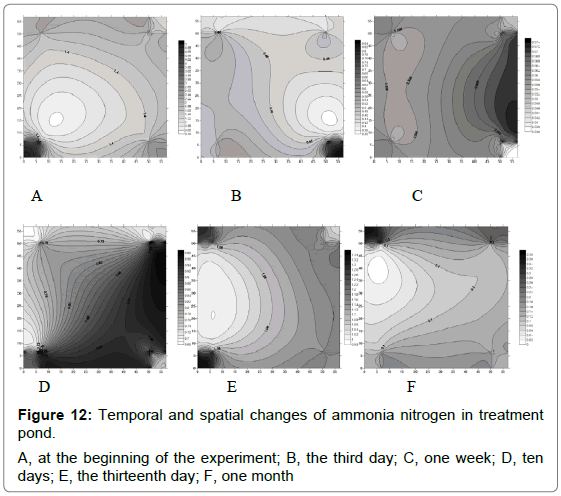
Ammonia nitrogen: Temporal and spatial changes of ammonia nitrogen concentration in treatment pool were shown in Figure 12. Generally, there was no significant temporal and spatial difference in the concentration of ammonia nitrogen in the pond (p>0.05).
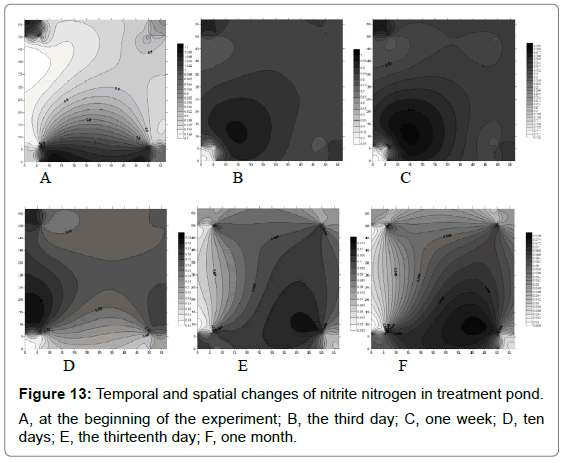
Nitrite nitrogen: Temporal and spatial changes of nitrite nitrogen concentration in treatment pool were shown in Figure 13A. From the third day to the seventh day of the experiment, the nitrite nitrogen concentrations in Site 4 and Site 5 were higher than in other regions Figure 13B and 13C. Two weeks later, the nitrite nitrogen concentrations in Site 5 and Site 6 were higher than other regions (Figure 13D-F).
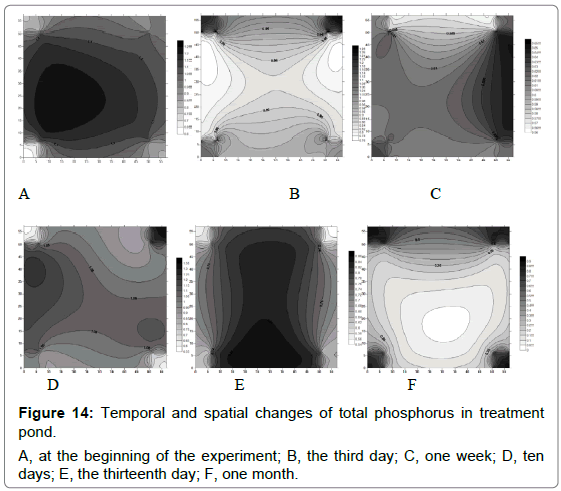
Total phosphorus: Temporal and spatial changes of total phosphorus concentration in treatment pool were shown in Figure 14. In the beginning and on the thirteenth day of the experiment, the total phosphorus concentration in Site 5 was higher than in other regions Figure 14A-E. However, on the third day of the experiment, the total phosphorus concentration in Site 5 was lower than other areas (Figure 14B).
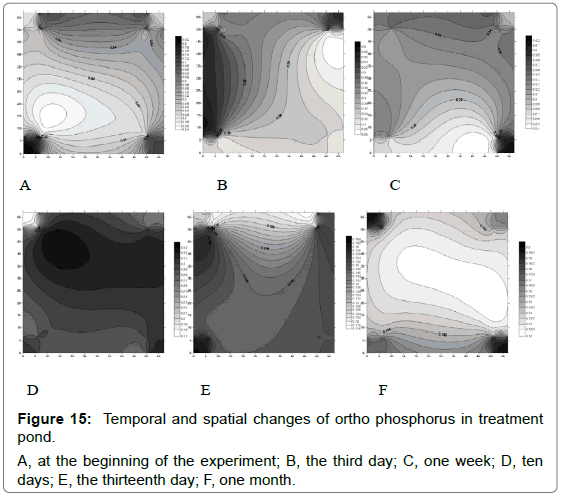
Ortho phosphorus: Temporal and spatial changes of ortho phosphorus concentration in treatment pool were shown in Figure 15. On the tenth day of the experiment, the ortho phosphorus concentration in Site 5 was higher than in other regions (Figure 15D).
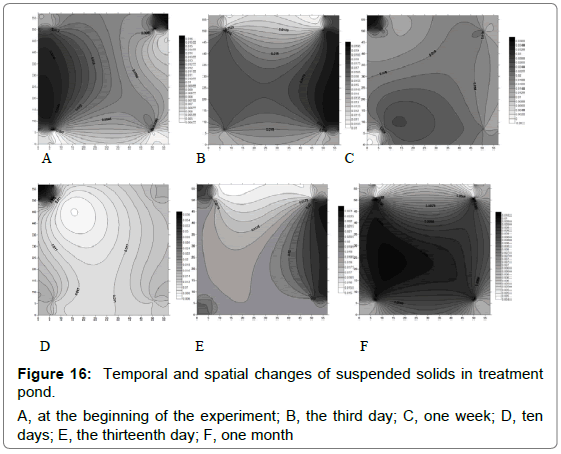
Suspended solids: Temporal and spatial changes of suspended solids concentration in treatment pool were shown in Figure 16. The levels of suspended solids in the middle of the pond were generally lower.
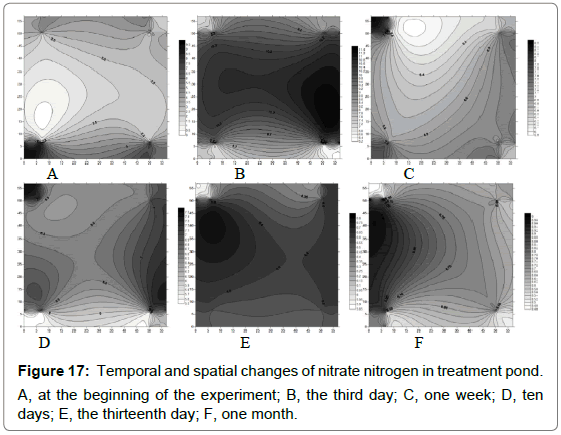
Nitrate nitrogen: Temporal and spatial changes of nitrate nitrogen concentration in treatment pool were shown in Figure 17. On the third day and the thirteenth day of the experiment, the nitrate nitrogen concentration in Site 5 was higher than in other regions (Figure 17B and 17E).
Discussion and Conclusion
Comparison of water quality between treatment pond and the control
During the breeding period, the average concentration of total nitrogen in the treatment pond decreased 13.6%, and the average concentration of total phosphorus decreased 17.7%. The average concentration of ammonia nitrogen decreased 92.1%, and the average concentration of nitrite nitrogen decreased 72.7%. The average concentrations of dissolved phosphorus decreased slightly, and the average concentration of nitrate nitrogen increased. The average concentration of ammonia nitrogen in the treatment pond was generally lower than that of the control pond (p<0.05), but the other indicators were higher than the control pond. The excretion of aquatic organisms is an important source of ammonia nitrogen in pond waters. Studies have shown that in the course of swimming training, fish reduces protein consumption [5]. This may be one of the reasons why the concentration of ammonia nitrogen in the treatment pond in the experiment is significantly lower than that in the control pond. On the other hand, the ammonia concentration in water is also related to the natural removal of ammonia. Whether water flows affected bioabsorption, physical adsorption, and air-escape of ammonia nitrogen in pond water were needed further study [9]. To facilitate ammonia excretion and to meet the increased oxygen demand, swimming induces increased ventilation rates and branchial blood perfusion, thus promoting gill permeability for gas and ion exchange [10,11]. It can be seen from the experimental results that the concentration of suspended particulate matter in the test pond is significantly increased, which may be caused by the flow of water stirring the sediments. Although the increase in suspended particulate matter reduced the transparency in the water, the role of increasing suspended particulate matter was not known. In general, the treatment pond had good water quality, especially the decrease of ammonia nitrogen level and increase of the dissolved oxygen level.
The pond circulation water culture combines the characteristics of ecological breeding. Some studies have shown that certain water flow speed have certain impact on pond water quality. In the water environment recycling, the pond circulation water concentrates and discharges the sewage and the feces.
Temporal and spatial changes of water qualities
On the first day of the formation of circulating water in the pond, the total nitrogen concentration in Site 5 was significantly higher than in other regions. During the experiment, the ammonia nitrogen concentration generally decreased, but the spatial distribution was not obvious. The concentration of nitrite nitrogen in Site 5 was generally higher than other regions. The overall change of total phosphorus was not obvious, and the area with high concentration was close to the shore of the pond. The specific factors need further study. In the early stage of the experiment, there were higher concentrations of nitrate nitrogen in Site 7, Site 8, and Site 9, but later there were higher concentrations of nitrate nitrogen in Site 5, Site 4, and Site 7. In this experiment, the data of temporal and spatial changes of water qualities from only one pond were not enough, and it needed further research to make an appropriate assessment.
Acknowledgments
This work was supported by the Ocean and Fishery Special Fund Project of Guangdong Province for Technology Extension (2017A0010) (A201601B14).
References
- Shrivastava J, Raškovic B, Blust R, De Boeck G (2018) Exercise improves growth, alters physiological performance and gene expression in common carp (Cyprinus carpio, should be italic). Comp Biochem Physiol A Mol Integr Physiol 226: 38-48.
- Palstra AP, Planas JV (2011) Fish under exercise. Fish Physiol Biochem 37: 259-272.
- Davison B, Herbert NA (2013) Swimming-enhanced growth. Swimming physiology of fish. Berlin, Heidelberg, Springer 177-202.
- Palstra AP, Planas JV (2013) Swimming Physiology of Fish: Towards using exercise to farm a fit fish in sustainable aquaculture. Springer Science & Business Media.
- Moves CD, West TG (1995) Exercise metabolism of fish. Biochemistry & molecular biology of fishes 4: 367-392.
- American Public Health Association (2005) Standard methods for the examination of water and wastewater Washington, DC: American Public Health Association.
- American Public Health Association, American Water Works Association (2017) Standard methods for the examination of water and wastewater. Washington, DC.
- Boyd CE, Tucker CS (1992) Water quality and pond soil analysis for aquaculture. Alabama Agricultural Experiment Station.
- McColl RHS (1974) Self-purification of small freshwater streams: phosphate, nitrate, and ammonia removal. N Z J Mar Freshwat Res 8: 375-388.
- Zhang L, Nawata CM, De Boeck G, Wood CM (2015) Rh protein expression in branchial neuroepithelial cells, and the role of ammonia in ventilatory control in fish. Comp Biochem Physiol A Mol Integr Physiol 186: 39-51.
- Wang HJ, Xiao XC, Wang HZ, Li Y, Yu Q, et al. (2017) Effects of high ammonia concentrations on three cyprinid fish: Acute and whole-ecosystem chronic tests. Sci Total Environ 598: 900-909.
Citation: Qian TU, Yonghui YU, Lingyun LI, Xiaoyong XIE, Wang Ming ZHU, et al. (2019) Effects of Water Flow on Water Quality of Largemouth Bass Culture Ponds. J Fisheries Livest Prod 7: 291. DOI: 10.4172/2332-2608.1000291
Copyright: © 2019 Qian TU, et al. This is an open-access article distributed under the terms of the Creative Commons Attribution License, which permits unrestricted use, distribution, and reproduction in any medium, provided the original author and source are credited.
Share This Article
Recommended Journals
Open Access Journals
Article Tools
Article Usage
- Total views: 2942
- [From(publication date): 0-2019 - Mar 29, 2025]
- Breakdown by view type
- HTML page views: 2176
- PDF downloads: 766
