Effects of Cyanobacterial Blooms on Microbial Community Distribution in Surface Sediments in Lakes
Received: 10-Apr-2019 / Accepted Date: 18-Apr-2019 / Published Date: 25-Apr-2019
Abstract
In order to explore the influence of cyanobacterial blooms on the sediment microbial population structure in lake waters, the cyanobacteria bloom of Zhushan Bay in Taihu Lake was taken as the research background. The cyanobacteria bloom situation was forecasted through long-term monitoring, and of the diversity and relative abundance of colonies in surface sediments were analyzed during algal blooms, based on 16s RNA high-throughput sequencing technology. The results revealed the following: (1) the cyanobacteria bloom period concentrated within June-September of each year, especially around the end of July and the beginning of August, in Zhushan Bay of Taihu Lake, and the peak of the cyanobacteria concentration period may still be maintained at approximately 1010 cells/L; (2) during cyanobacteria degradation, secondary pollution can be reduce if salvage can be finished within days after cyanobacteria accumulation; (3) during cyanobacterial blooms, the bacterial communities in surface sediments are mainly composed of Firmicutes (33.45%), Cyanobacteria (30.44%), Proteobacteria (27.17%), and Bacteroidetes (7.2%), but there are significant differences in microbial communities in different periods; (4) during cyanobacteria blooms, the microbial community in sediments participates in the circulation of nutrients through the signal transduction of various proteases, which regulates the metabolic pathway of microorganisms, further affecting the content and distribution of microorganisms in different environments through signal transduction.
Keywords: Cyanobacteria bloom; Degradation; Sediment; Microbial community
Introduction
Cyanobacteria is the oldest photoautotrophic organism on earth, and the long-term evolutionary process allows cyanobacteria to achieve stronger ecological competitive advantages, when compared to other algae [1]. If cyanobacteria proliferation in eutrophic lakes due to the formation of cyanobacterial blooms, this would change the water ecology and endanger water safety [2]. Cyanobacterial bloom is one of the most serious water environmental disasters, and it is undoubtedly the primary emergent issue in the recovery of water eutrophication [3,4]. Affected by human activities, many lakes in China are eutrophic, and the occurrence of cyanobacteria bloom has become frequent. Under certain meteorological conditions, the local accumulation of cyanobacteria can reach several centimeters, or even 50 centimeters. Cyanobacteria rot and decompose under the action of microorganisms, and consume a large amount of dissolved oxygen in water [5,6]. After the cyanobacteria declines, nutrients will enter the water body again, become endogenous pollution, and release toxic substances [7]. Furthermore, the decomposition of cyanobacteria would significantly change the content of nutrients and organic matter in the water, affecting the water quality of the lake [8,9].
Taihu Lake is the third largest freshwater lake in China, located in the Yangtze River Delta, with an area of 2,338 km2 and an average water depth of 2 m, The coverage area of cyanobacteria blooms in Taihu Lake has gradually expanded from a small area to a whole northwest part of Taihu Lake, and has now reached more than 1000 km2 [10,11]. The cyanobacterial blooms in drinking water sources led to the drinking water crisis in Wuxi in May 2007 [12,13].
At present, various studies have been conducted on the effects of cyanobacterial blooms on water bodies and sediments, suggesting that cyanobacterial blooms can significantly change the pH of water and stimulate the release of dissolved nutrients in the sediment, or change the nitrogen-phosphorus cycle at the sediment-water interface by changing the dissolved oxygen environment of water [14,15], Some studies have suggested that cyanobacteria can settle on the bottom of water, remineralize on the surface of the sediment, and affect the surface bacterial activity of the sediment [16-18], In wild waters, cyanobacteria with different degrees of decline tend combine. Due to the different active substances in cyanobacteria with different degrees of degradation, it would difficult to investigate the characteristics of microbial colonies in the process of cyanobacteria. Therefore, the present study used highthroughput sequencing technology, which has strong specificity and high sensitivity, and can more fully reveal the diversity and abundance of microorganisms. This technology is a valuable tool for assessing microbial distribution characteristics [19,20]. The aim of the present study was to reveal the effects of cyanobacteria blooms on surface sediment microbes during the formation phase (W1), stationary phase (W2), decay phase (W3) and dissipation phase (W4) and provide a scientific basis for the timely removal of cyanobacteria and prevention of water pollution.
Materials and Methods
Sample preparation
Zhushan bay is one of the most eutrophic bays of Lake Taihu, China. Sampling sites were shown in Figures S1-S3. The cyanobacteria of the natural water body is collected by plankton nets, transported back to the laboratory for mixing, diluted into a reactor, placed in a reaction tank, and subjected to degradation experiments. 30 ml of surface sediment (top 5 cm) were collected using an organic glass hydrophore and a sediment core sampler (Perrson MY-052, Mingyu Technology). Several samples were taken from each position and were then homogenized. Sediment samples were sampled from several different periods: cyanobacterial bloom formation period (W1), stationary phase (W2), decline period (W3), dissipation period (W4). After sampling, samples were stored in an ultra-low temperature refrigerator (-80°C). The DNA of the microorganism in the sediment sample is extracted for high-throughput sequencing.
In-situ observation of cyanobacterial accumulation
Along with sampling, in-situ observation of color and odors change of cyanobacteria during different growth phases under natural conditions was conducted.
Simulation of cyanobacterial degradation
Laboratory-scale research was also conducted to simulate the degradation of cyanobacteria. Fresh cyanobacteria sampled from Zhushan bay from various growth periods was inoculated into in 5000 mL glass flasks under controlled condition with a light intensity of 5000 lx (12 h light/12 h dark cycle), a temperature of 35 ± 2°C, and a relative humidity of 70-90%.
Analytical methods
Algal density and microscopic morphology: Algal cell density of cyanobacteria was performed using a Sedgwick–Rafter counting chamber under a microscopic magnification of 200–400x (Olympus model). Microscopic morphology was observed under same microscopic magnification.
Analysis of microbial community:
DNA extraction and PCR amplification: Total DNA extraction was performed according to the EZNA® soil kit (Omega Bio-tek, Norcross, GA, US) instructions. DNA concentration and purity were determined using NanoDrop 2000, and DNA extraction quality was measured by 1% agarose gel electrophoresis; 5'-ACTCCTACGGGAGGCAGCAG-3') and 806R (5'-GGACTACHVGGGTWTCTAAT-3') primers for PCR amplification of the V3-V4 variable region, the amplification procedure was: pre-denaturation at 95°C for 3 min, 27 cycles (denaturation at 95°C for 30 s, annealing at 55°C for 30 s, extension at 72°C for 45 s), and extension at 72°C for 10 min (PCR: ABI GeneAmp® 9700). The amplification system was 20 ul, 4 ul 5*FastPfu buffer, 2 ul 2.5 mM dNTPs, 0.8 ul primer (5 uM), 0.4 ul FastPfu polymerase; 10 ng DNA template.
Illumina Miseq sequencing: The PCR product was recovered using a 2% agarose gel, purified using AxyPrep DNA Gel Extraction Kit (Axygen Biosciences, Union City, CA, USA), eluted with Tris-HCl, and detected by 2% agarose electrophoresis. Detection quantification was performed using QuantiFluorTM-ST (Promega, USA). The purified amplified fragment was constructed into a library of PE 2*300 according to the standard operating protocol of the Illumina MiSeq platform (Illumina, San Diego, USA). The steps of constructing the library: (a) connecting the "Y" shaped linker; (b) using magnetic beads to remove the self-ligating fragment of the linker; (c) enriching the library template by PCR amplification; (d) denaturing the sodium hydroxide, producing Single-stranded DNA fragments. Sequencing using Illumina's Miseq PE300 platform (Shanghai Meiji Biomedical Technology Co., Ltd.).
Statistical treatment
Statistical analysis was performed using Origin Pro 9.0 software for Windows (Origin Lab Northampton, MA, USA). An analysis of the structure and abundance of the bacterial community distribution in surface sediments was performed using the free online platform Majorbio I-Sanger Cloud Platform (www.i-sanger.com).
Results and Discussion
Analysis of cyanobacterial blooms in Zhushan Bay, Taihu Lake
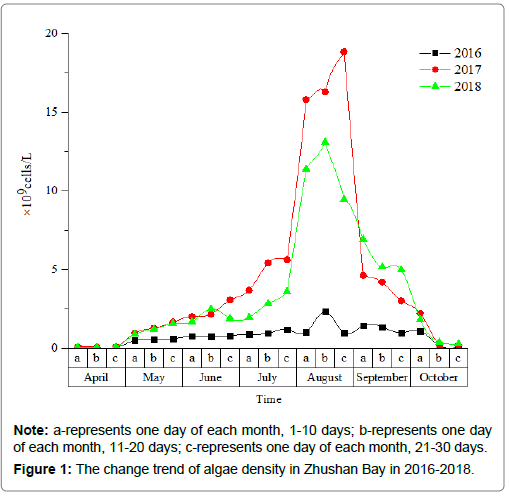
The analysis of the trend change of algae density in the water body of Zhushan Bay from April to October in 2016-2018 (Figure 1):
(1) When comparing the overall degree of cyanobacteria outbreak in 2016-2018 2017>2018>>2016, cyanobacteria began to substantially increase in the middle and late July of each year, and the amount of cyanobacteria was highest in August.
(2) In 2016, the density of cyanobacteria was close to 109 cells/L, while the highest density in 2017 and 2018 exceeded 1010 cells/L, which was more than 10 times of that of 2016.
(3) By analyzing the data of the past three years, combined with the local meteorological parameters of Zhushan.
Bay, the overall forecast of the cyanobacterial outbreak trend in these waters for the next few years is as follows: Cyanobacteria will began to rapidly grow in middle and late May of each year, and a concentrated outbreak of cyanobacteria will occur from July to September. Since the water environment treatment is a long-term project, the water quality of Taihu Lake will remain in a state of eutrophication. Therefore, the peak of the cyanobacteria concentration period may still be maintained at approximately 1010 cells/L.
Characterization changes during cyanobacterial degradation
Color change of cyanobacteria during the decline of natural conditions: Through long-term field monitoring, cyanobacteria bloom presented different color changes under natural conditions (Figure 2). During the natural decline, the color of cyanobacteria changed from yellow-green to green, subsequently changed to pale yellow, and finally changed to blue-green. It was also observed that blue-purple water appeared in the part of the blue-green algae (Figure 2d). This may be because the cyanobacteria cells ruptured and released a large amount of phycocyanin, and the release rate was greater than the decomposition rate [21]. Another part of the cyanobacteria can produce secondary metabolites, such as geosmin, dimethyl isodecyl alcohol, etc. When cyanobacteria degrade, these odor substances are released from cells into the water body, further aggravating the lake’s odor [22], Therefore, in lakes, the accumulation of high-density cyanobacteria decay areas is often accompanied by foul odor [23]. Furthermore, high concentrations of cyanobacteria exhibit a faster rate of decomposition, and this is probably because the cyanobacterial density is more conducive to the growth of bacteria, and the bacterial activity is relatively high [24].
The cyanobacteria laboratory simulates the color changes during degradation: In the laboratory cyanobacteria degradation process (Figure S2), the color changed to green, dark green, yellow-green and brown, successively, and the change started from the surface to the inside: 0th day (Figure S2a), the fresh cyanobacteria was green, and after adding to the reactor, the temperature was constant at 30°C; 1st day, the cyanobacteria appeared to be superposed on the surface layer; 3rd day, the cyanobacteria was dark green, the algae and water were layered, and gas was released; 5th day, the cyanobacteria was dark green, and the algae and water layers were obvious; 10th day (Figure S2b), the lower layer of water appeared white, the overall performance was dark green, and at the same time, a large amount of gas was released and the smell was odorous; 30th day (Figure S2c), the mixed tendency of algae and water appeared, the stratification was not obvious, the surface cyanobacteria was dark green, the lower layer appeared to be fermented, and the overall color turned brown; 60th day (Figure S2d), the algae water was clearly separated, the surface layer was brown, and the bottom algae water mixture was brown. After the degradation, the residue presented with a brownish red color after evaporation, and the odor gradually decreased.
Compared with the cyanobacterial decay process under natural conditions and laboratory simulation, the color change trend of these two was basically the same, and the comparison between these two was available. The fresh cyanobacteria became light green. When the cyanobacteria degraded on the 7th day, the blue-violet phycocyanin was released, and the process of decline underwent blue color change, stratification and mixing.
Observation of optical microscopic morphology during the decline of cyanobacteria: Cyanobacterium is single-celled, and in the case of cyanobacterial blooms, it often exists as a population (Figure S3a). Fresh cyanobacteria are clearly visible under a light microscope, the cells are cyan or black-green, and spherical, the gel is colorless and densely attached to the cells, and the cells inside the gel are tightly packed. During the degradation of cyanobacteria, the outer layer of the polysaccharide was degraded, and the cell population collapsed (Figure S3b), followed by more single cells (Figure S3c), and the intracellular substances began to degrade. Complete cyanobacteria individuals were not observed under normal light microscopy until the 60th day (Figure S3d).
Distribution of microbial communities in surface sediments
Cyanobacterial blooms affect the microenvironment of surface sediments, such as bacterial abundance, community structure and diversity, which in turn affects the migration and transformation of nutrients in sediments. Furthermore, it has a certain role in promoting the re-formation of cyanobacteria blooms. Studies have shown that a large amount of nutrients entering the sediment in the cyanobacterial bloom environment has an important influence on microbial community structure and activity [25,26]. For example, an increase in ammonia nitrogen in sediments may affect the community structure and diversity of prooxidogenic prokaryotes [27,28], and the decomposition of cyanobacteria may lead to a decrease in bacterial nitrification activity [29,30].
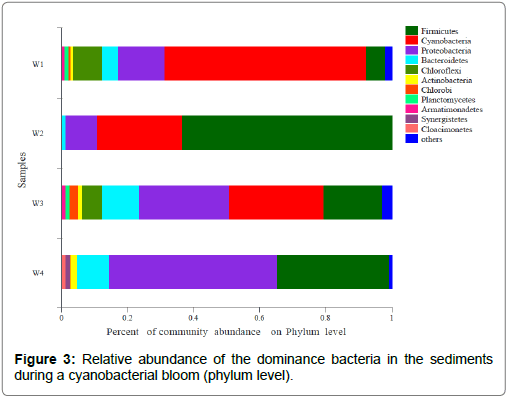
The changes in microbial abundance in the surface sediments: The changes in microbial abundance in the surface sediments of Taihu lake during cyanobacterial blooms are presented in Figure 3. During the outbreak of cyanobacterial blooms, the abundance of multiple dominant bacteria changes, such as Cyanobacteria, Firmicutes, Proteobacteria, Bacteroldetes, Actinobacteria and Chloroflexi, and this may be due to the degradation of cyanobacteria, which affects the growth and distribution of microorganisms in the surface sediment by releasing algal toxins, nutrients and dissolved oxygen. In the W1 period, the Cyanobacteria in the surface sediment were used as the dominant species. During the W2 period, the Firmicutes were the dominant species. During the W3 period, Proteobacteria and Cyanobacteria were the dominant species. During the W4 period, Proteobacteria were the dominant species. In comparing the relative abundance of Cyanobacteria in the four periods, it was found that the cyanobacteria decomposed and inhibited Cyanobacteria, indicating that the demise of cyanobacteria would cause the living space of the Cyanobacteria group in the sediment to be compressed, allowing Proteobacteria to have an increased competitive advantage and become a dominant group, which may be correlated to its own characteristics. Proteobacteria contains a variety of bacteria that can adapt to extreme environments through facultative or obligate anaerobic and heterotrophic life. These results indicate the significant selection and adaptation of sediment Proteobacteria in lakes with differing trophic statuses [31,32].
During the W2 period, the cyanobacteria broke out in large areas. During this period, the diversity index of bacterial communities in sediments reached the lowest value, and the relative proportions among various groups also significantly changed. For example, during the W3 and W4 periods, Proteobacteria and Bacteroldetes became the dominant species, and the abundance significantly increased, leading to a decrease in the diversity and uniformity of Cyannobacteria. During the W2 period, cyanobacteria formed, and the external environment was relatively stable, which caused the sediment environment to become relatively stable, resulting in fewer microbial species in the surface sediment during this period. During the W3 and W4 periods, with the decomposition of cyanobacteria, the nutrient content of the water greatly changed, the content of organic matter in the surface sediment increased, and the sediment environment was in a state of change, which led to the strengthening of microbial activities and an increase in species. During this period, Proteobacteria and Bacteroldetes were multiplied, and the living space of other kinds of microorganisms was compressed, causing changes in the distribution of bacterial communities.
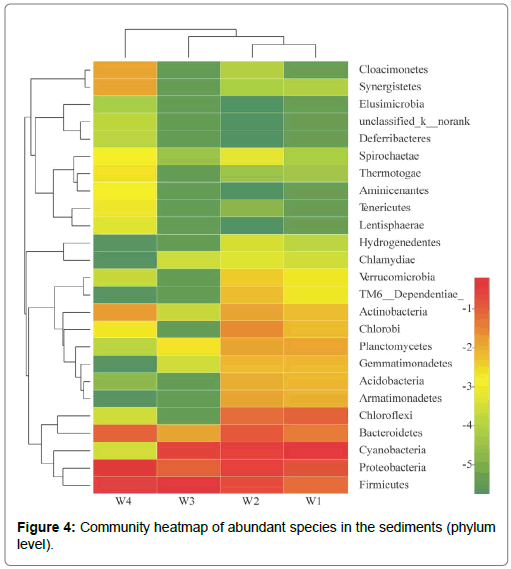
Community heatmap of abundant species in the sediments: The heat map analysis of species with more abundance in sediment microorganisms is presented in Figure 4, showing the abundance expression of Firmicutes, proteobacteria, Cyannobacteria and Bacteroidetes species. Through the cluster analysis of samples from different periods, W4 was far away from the other three periods, while W1 and W2 were the closest, which can be clustered into one category. The overall expression patterns of microbial species abundance in the surface sediments of the four periods of cyanobacterial blooms were very different: In the W1, W2 and W3 groups, the abundance exhibited an upregulated expression pattern (red band). Among these, W1 and W2 were more obvious, while W4 initially went down (green strip) and subsequently went up (red strip). The reason was because W1 and W2 were within the large-scale survival period of cyanobacteria, the water environment was in a gradual change stage, and the abundance expression law was relatively stable. W3 was in a mixed period of various forms of cyanobacteria, and the death of algae caused a change in the expression of total abundance. The dissipating period after the degradation of cyanobacteria in the W4 period was the transition period from W3 to W1. Hence, the abundance was first adjusted, and subsequenlty adjusted upward.
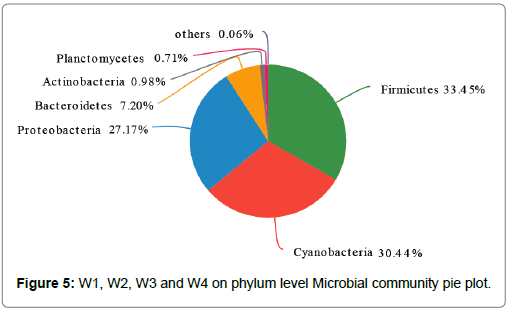
The overall abundance analysis: The overall abundance analysis of different species of microorganisms in the sediments of the surface layer is presented in Figure 5. The higher content was Firmicutes (33.45%), Cyannobacteria (30.44%) Proteobacteria (27.17%) and Bacteroidetes (7.2%), and the above groups occupied 98.26%. Firmicutes is a nutrient-rich type that can produce spores. It can resist extreme environments, has strong adaptability, and is the most abundant in the surface sediment during the bloom. Cyannobacteria is widely distributed in various eutrophic waters, and is also distributed in the sediments of shallow lakes, especially in the early stage of Cyanobacteria formation. Its abundance changes with the continuous accumulation and apoptosis of Cyanobacteria. Proteobacteria is the largest of the bacteria, which include various pathogens, such as Escherichia coli, Salmonella, Vibrio cholerae, and Helicobacter pylori, and various other bacteria that can be used for nitrogen fixation, and the migration and transformation of nitrogen nutrients. Bacteroidetes is the dominant flora in the hydrolysis acidification reaction, which is mainly distributed in two stages, W3 and W4.
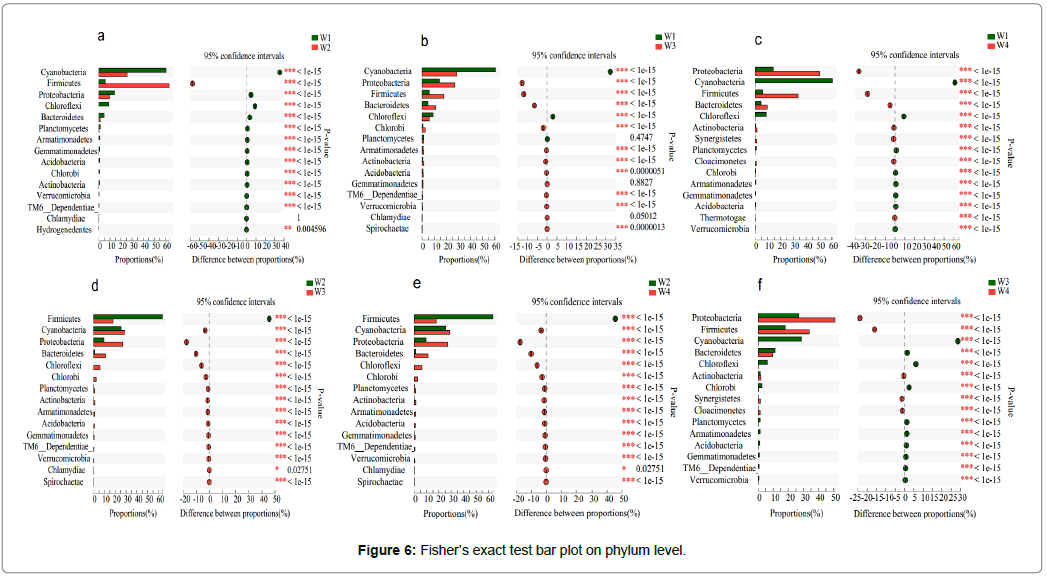
The Fisher’s exact test bar plot at the Phylum level: The Fisher’s exact test bar plot at the Phylum level for relative abundance of dominant flora in W1-W4 samples is shown. The results are presented in Figure 5, and there was a significant difference between the two sample groups.
In comparing W1 and W2 (Figure 6a), except for Firmicutes, the proportions were expressed as W1>W2, and except for Chlamydiae (p>0.05), there were extremely significant differences among the 14 species (p<0.01). Compared W1 and W3 (Figure 6b), except for Cyanobacteria, Chlorobi and Planctomyetes, the proportions were W3>W1, and there were extremely significant differences among the other 12 species (p<0.01), except for Planctomyetes, Chlamydiae and Gemmatimonadetes (p>0.05). In comparing W1 and W4 (Figure 6c), the proportions of Planctomyetes, Firmicutes, Bacteroldetes, Actionbacteria, Synergistetes, Cloacimonetes and Thermotogae all exhibited W4>W1, while the remaining proportions were W1>W4, among which, 15 kinds of microorganisms were significantly different (p<0.01). In comparing W2 and W3 (Figure 6d), except for Firmicutes, the proportions were W2>W3, while others were W3>W2, and 15 of these had significant differences (p<0.05). In comparing W2 and W4 (Figure 6e), except for Firmicutes, the proportions were W3>W4, while the others were W4>W3, and 15 of these had significant differences (p<0.05). In comparing W3 and W4 (Figure 6f), except for Planctomyetes, Firmicutes, Actionbacteria, Synergistetes and Cloacimonetes, the proportions were W4>W3, while the others were W3>W4, and 15 of these had significant differences (p<0.01).
The results revealed that in the Zhushan Bay water area of Taihu Lake, the diversity of bacterial community structure in sediments was significantly correlated with the cyanobacterial blooms. Different types of microbial content would undergo significant changes at different time points. Some scholars have investigated the vertical distribution of bacterial community structure under different nutrient levels [33,34]; d the distribution of bacterial communities in surface sediments [35]; and the trend of bacterial community structure at specific time points [36]. These results show that changes in external environmental factors (temperature, dissolved oxygen in water, and nutrients) lead to the growth rate and diversity of microorganisms in surface sediments. Moreover, after the death of cyanobacteria, the internal nutrients would re-settle and be released into the water to stimulate the growth of microorganisms in the sediment [26,31]. and the metabolism of functional microorganisms in sediments would also change. Microorganisms participate in the circulation of nutrients and affect the release of nitrogen and phosphorus nutrients in sediments [13,24,37].
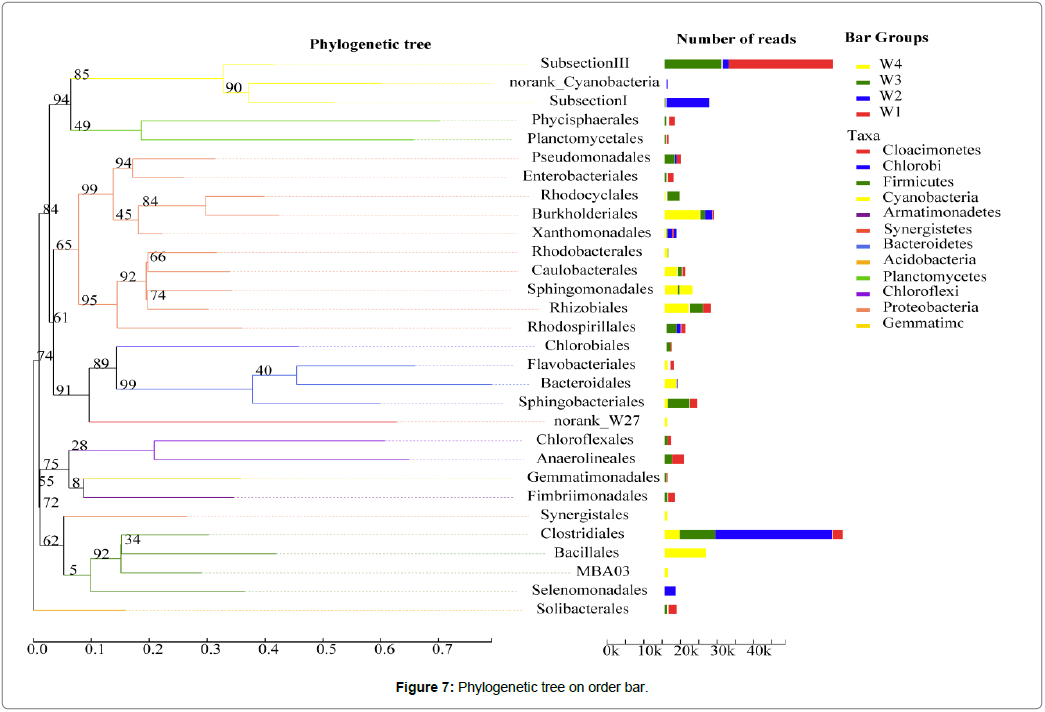
The phylogenetic tree analysis: The phylogenetic tree analysis of microbial communities from the two levels of phylum and order is presented in Figure 7: From the taxa in the evolutionary tree, the following could be concluded: During the occurance of cyanobacterial blooms, the sediments mainly include Cyanobacteria, Proteobacteria, Bacteroidetes, and Firmicutes. Cyannobacteria mainly includes Subsection III and Subsection I, and are mainly distributed in the W1, W3 and W2 periods. Proteobacteria mainly includes 10 species, such as Pseudomonadales, Burkholderiales, Rhodobacterales, Sphingomonadales, Rhizobiales and Rhodospirillales, and are mainly distributed in the W4 period. Bacteroidetes mainly include Flavobacteriales, Bacteroidales, and Sphingobacteriales, in which Bacteroidales are mainly distributed in the W4 period, while Sphingobacteriales are mainly distributed in the W3 period. Firmicutes mainly include Clostridiales, Bacillales, MBA03, and Selenomonadales, in which Clostridiales are mainly distributed in the W2 and W3 period, while Bacillales are mainly distributed in the W4 period. The phylogenetic tree order bar shows that Proteobacteria and Bacteroidetes have recently evolved, and Firmicutes forms a distinct group within the archaea, which is far from the evolutionary distance of other species with high abundance [38].
The level of COG was performed on the proteins of microorganisms: The database of Clusters of Orthologous Groups (COG) of proteins is a phylogenetic classification of proteins encoded in completely sequenced genomes [39]. An attempt has been made to organize these proteins into groups of orthologs, which are direct evolutionary counterparts correlated by vertical descent [40]. The COG database annotates protein families, rather than individual proteins, and the method used for the construction of the COG often allows distant relationships to be discerned. Thus, the use of the COG database for the annotation of a newly sequenced genome would probably increase the number of functional assignments [41]. By annotating the COG function of the microorganisms in the sample, 25 groups of COG function classifications were compared in the COG database (Figure S4). Functional categories:
(1) Information storage and processing: (J: Translation, ribosomal structure and biogenesis; K: Transcription; L: DNA replication, recombination and repair).
(2) Cellular processes and signaling: (D: Cell division and chromosome partitioning; V: Defense mechanisms; O: Posttranslational modification, protein turnover, chaperones; M: Cell envelope biogenesis, outer membrane; N: Cell motility; T: Signal transduction mechanisms).
(3) Metabolism: (C: Energy production and conversion; G: Carbohydrate transport and metabolism; H: Coenzyme transport and metabolism; P: Inorganic ion transport and metabolism; E: Aminoacid transport and metabolism; F: Nucleotide transport and metabolism; Q: Secondary metabolites biosynthesis, transport and catabolism).
(4) Poorly characterized: (R: General function prediction only; S: Function unknown).
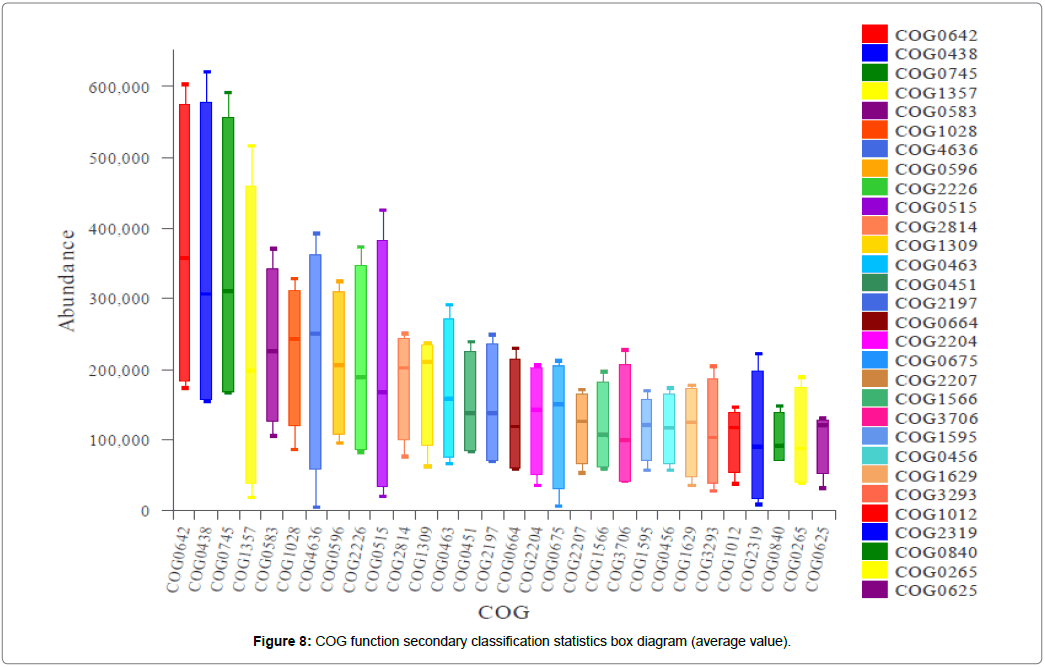
It was found that the COG function in different periods was not significantly different between the groups, although the types and contents of microorganisms were different. Mainly manifested as cellular processes and signaling, information storage and processing, metabolism and other functions, these functions are linked to the growth and metabolism of cyanobacteria. This indicates that cyanobacterial bloom affects the expression of microbial function in sediments, and microbial communities are involved in nutrient cycling. On this basis, the function level 2 of COG was performed on the proteins of microorganisms in all samples (Figure 8).
In Figure 8, the functional protein corresponding to each COG label is shown in the attached Table S1, in which the abundance values of histidine kinase (COG0642), glycosyltransferase (COG0438), and regulator (COG0745) are above 300,000, and the expression is more significant in the sediments of the surface layer during the cyanobacteria bloom. Furthermore, pathogenesis (COG1357), transcriptional regulator (COG0538), dehydrogenase reductase (COG1028), pfam: DUF820 (COG4636), and alpha beta hydrolase (COG0596) also have higher abundance (>200,000). Some of the functional proteins can reflect the metabolism of microbial microorganisms in the surface layer [41]. These functional proteins mainly include histidine kinase and glycosyltransferase.
Histidine kinase enables the response regulator (RR) protein associated with it to exhibit phosphatase activity, which can act as a regulator of the intracellular phosphorylation of RR protein through the dephosphorylation of the RR protein, with more distribution in the W1 and W3 samples. This is consistent with a report stating that this type of histidine kinase functions in conjunction with the replicative phosphatase [42]. Glycosyltransferase is distributed in organelles and is widely distributed in the W1 and W3 stages. The regulator response consists of a CheY-like receiver domain and a winged-helix DNA-binding domain, and these are involved in the regulation of growth and metabolism in living organisms. Studies have revealed the interactions between different proteases. For example, glycosyltransferase (COG0438) has a good interaction with asparagine synthase (COG0367), and simultaneously with the winged helix family two-component transcriptional regulator (COG0745) [43]. Furthermore, there was good connection between COG0745 and the tetR family transcriptional regulator (COG1309), in which both of these were involved in transcription. COG0745 even exhibited good linkage with the ABC transporter (COG0178) [43]. In addition, it has been indicated that during the cyanobacterial bloom, microorganisms also regulate their metabolic pathways through the signal transduction of various proteases, and this further influences the content and distribution of microorganisms in different environments.
Conclusion
In conclusion, the analysis of cyanobacterial blooms in the waters of the Zhushan Bay in Taihu Lake in the next few years reveal that cyanobacteria will begin to rapidly grow in middle and late May, and the germination period of cyanobacteria will occur in from July to September. The results of the simulation of cyanobacteria degradation in the laboratory revealed that secondary pollution can be reduced if salvage can be finished within seven days after the cyanobacteria accumulate.
In cyanobacterial blooms, the bacterial communities in surface sediments are mainly composed of Firmicutes (33.45%), Cyannobacteria (30.44%) Proteobacteria (27.17%), and Bacteroidetes (7.2%). Furthermore, cyanobacterial blooms have significant effects on microbial species and its distribution in surface sediments, and there are significant differences in microbial communities in different periods. In addition, during the occurrence of cyanobacteria blooms, microbial community in the sediment participates in the circulation of nutrients through the signal transduction of various proteases, which regulates the metabolic pathway of microorganisms, and further affects the content and distribution of microorganisms in different environments through signal transduction.
Acknowledgements
This study was financially supported by ABA Chemicals for funding support and National Science and Technology Major Project (2017ZX07204005-04). Thanks to. We thank the anonymous reviewers for their valuable comments and suggestions. Thanks to Ms. Zhang Pengying for modifying the images in this article.
References
- Oliver R, Ganf G (2000) Freshwater blooms. In: The ecology of cyanobacteria: Their diversity in time and space, Kluwer Academic Publishers, Netherlands pp: 149-194.
- O’Neil JM, Davis TW, Burford MA, Gobler CJ (2012) The rise of harmful cyanobacteria blooms: The potential roles of eutrophication and climate change. Harmful Algae 14: 313-334.
- Ma J, Qin B, Paerl HW, Brookes JD, Hall NS, et al. (2016) The persistence of cyanobacterial (Microcystis spp.) blooms throughout winter in lake taihu, China. Limnol Oceanogr 61: 711-722.
- Xia L, Lu X, Chen Y (2011) The effects of temperature and nutrient ratios on microcystis blooms in lake Taihu, China: An 11-year investigation. Harmful Algae 10: 337-343.
- Deng DG, Xie P, Zhou Q, Yang H, Guo LG (2010) Studies on temporal and spatial variations of phytoplankton in lake chaohu. J Integr Plant Biol 49: 409-418.
- Zhang XJ, Chen C, Ding JQ, Hou A, Li Y, et al. (2010) The 2007 water crisis in Wuxi, China: Analysis of the origin. J Hazardou Mater 182: 130-135.
- Cao X, Wang Y, He J, Luo X, Zheng Z, et al. (2016) Phosphorus mobility among sediments, water and cyanobacteria enhanced by cyanobacteria blooms in eutrophic Lake Dianchi. Environ Pollut 219: 580.
- Park HD, Sasaki Y, Maruyama T, Yanagisawa E, Hiraishi A, et al. (2010) Degradation of the cyanobacterial hepatotoxin microcystin by a new bacterium isolated from a hypertrophic lake. Environ Toxicol 16: 337-343.
- Chuai X, Wei D, Chen X, Wang X, Miao A, et al. (2011) Phosphorus release from cyanobacterial blooms in Meiliang Bay of Lake Taihu, China. Ecol Eng 37: 842-849.
- Qin B, Xu P, Wu Q, Luo L, Zhang Y, et al. (2007) Environmental issues of Lake Taihu, China. Hydrobiologia 581: 3-14.
- Chen Y, Qin B, Teubner K, Dokulil MT (2003) Long-term dynamics of phytoplankton assemblages: Microcystis-domination in Lake Taihu, a large shallow lake in China. J Plankton Res 25: 445-453.
- Qin B, Zhu G, Gao G, Zhang Y, Li W, et al. (2010) A drinking water crisis in Lake Taihu, China: Linkage to climatic variability and lake management. Environ Manage 45: 105-112.
- Jiao H B, Zha Y, Gao J (2006) Estimation of chlorophyll: A concentration in Lake Tai, China using in situ hyperspectral data. Int J Remote Sen 27: 4267-4276.
- Xie L Q, Xie P, Tang H J (2003) Enhancement of dissolved phosphorus release from sediment to lake water by Microcystis blooms: An enclosure experiment in a hyper-eutrophic, subtropical Chinese lake. Environ Pollut 122: 391-399.
- Denis L, Grenz C, Alliot É (2001) Temporal variability in dissolved inorganic nitrogen fluxes at the sediment–water interface and related annual budget on a continental shelf (NW Mediterranean) Oceanologica Acta 24: 85-97.
- Grenzll C, Hager SW, Cole BE (2000) Dynamics of nutrient cycling and related benthic nutrient and oxygen fluxes during a spring phyto- plankton bloom in South San Francisco Bay (USA). J Mar Ecol Prog 197: 67-80.
- Boon AR, Duineveld GCA (1998) Relationships between benthic activity and the annual phytopigment cycle in near-bottom water and sediments in the Southern North Sea. Estuar Coast Shelf Sci 46: 1-13.
- Koho KA, Langezaal AM, Lith YAV (2008) The influence of a simulated diatom bloom on deep-sea benthic foraminifera and the activity of bacteria: A mesocosm study. Deep Sea Res Part I Oceanogr Res Pap 55: 696-719.
- Tong Z, Fang HHP (2006) Applications of real-time polymerase chain reaction for quantification of microorganisms in environmental samples. Appl Microbiol Biotechnol 70: 281-289.
- Cumpson PJ, Sano N, Fletcher IW (2015) Multivariate analysis of extremely large ToFSIMS imaging datasets by a rapid PCA method. Surf Interface Anal 47: 986-993.
- Huang J, Graham N, Templeton MR, Zhang Y, Collins C, et al. (2009) A comparison of the role of two blue–green algae in THM and HAA formation. Water Res 43: 3009-3018.
- Smith JL, Boyer GL, Zimba PV (2008) A review of cyanobacterial odorous and bioactive metabolites: Impacts and management alternatives in aquaculture. Aquaculture 280: 5-20.
- Downes MT (1988) Aquatic nitrogen transformations at low oxygen concentrations. Appl Environ Microbiol 54: 172-175.
- Yuanyuan W, Feizhou C (2008) Decomposition and phosphorus release from four different size fractions of Microcystis spp. taken from Lake Taihu, China. J Environ Sci 20: 891-896.
- Graf G, Bengtsson W, Diesner U, Schulz R, Theede H (1982) Benthic response to sedimentation of a spring phytoplankton bloom: Process and budget. Mar Biol 67: 201-208.
- Khangembam CD, Sharma JG, Chakrabarti R (2017) Diversity and abundance of ammonia-oxidizing bacteria and archaea in a freshwater recirculating aquaculture system. Hayati J Biosci 24: 215-220.
- Cébron A, Berthe T, Garnier J (2003) Nitrification and nitrifying bacteria in the lower Seine River and estuary (France). Appl Environ Microbiol 69: 7091-7100.
- De-Corte D, Yokokawa T, Varela MM, Agogué H, Herndl GJ (2009) Spatial distribution of bacteria and archaea and amoA gene copy numbers throughout the water column of the Eastern Mediterranean Sea. ISME J 3: 147.
- Carini SA, Joye SB (2008) Nitrification in Mono Lake, California: Activity and community composition during contrasting hydrological regimes. Limnol Oceanogr 53: 2546-2557.
- Hansen LS, Blackburn TH (1992) Effect of algal bloom deposition on sediment respiration and fluxes. Mar Biol 112: 147-152.
- Chen GY, Qiu SL, Zhou YY (2009) Diversity and abundance of ammonia-oxidizing bacteria in eutrophic and oligotrophic basins of a shallow Chinese lake (Lake Donghu). Res Microbiol 160: 173-178.
- Schmid M, Twachtmann U, Klein M, Strous M, Juretschko S, et al. (2000) Molecular evidence for genus level diversity of bacteria capable of catalyzing anaerobic ammonium oxidation. Syst Appl Microbiol 23: 93-106.
- Zeng J, Yang L, Li J, Liang Y, Xiao L, et al. (2009) Vertical distribution of bacterial community structure in the sediments of two eutrophic lakes revealed by denaturing gradient gel electrophoresis (DGGE) and multivariate analysis techniques. World J Microbiol Biotechnol 25: 225-233.
- Shao K, Gao G, Wang Y, Tang X, Qin B (2013) Vertical diversity of sediment bacterial communities in two different trophic states of the eutrophic Lake Taihu, China. J Environ Sci 25: 1186-1194.
- Liu FH, Lin GH, Gao G, Qin BQ, Zhang JS, et al. (2010) Bacterial and archaeal assemblages in sediments of a large shallow freshwater lake, Lake Taihu, as revealed by denaturing gradient gel electrophoresis. J Appl Microbiol 106: 1022-1032.
- Shao K, Gao G, Qin B, Tang X, Wang Y, et al. (2011) Comparing sediment bacterial communities in the macrophyte-dominated and algae-dominated areas of eutrophic Lake Taihu, China. Canadian J Microbiol 57: 263-272.
- Verhamme DT, Prosser JI, Nicol GW (2011) Ammonia concentration determines differential growth of ammonia-oxidising archaea and bacteria in soil microcosms. ISME J 5: 1067.
- Stevens H, Stübner M, Simon M, Brinkhoff T (2010) Phylogeny of proteobacteria and bacteroidetes from oxic habitats of a tidal flat ecosystem. FEMS Microbiol Ecol 54: 351-365.
- Tatusov RL, Koonin EV, Lipman DJ (1997) A genomic perspective on protein families. Science 278: 631-637.
- Fitch WM (1995) Uses for evolutionary trees. Philosophical Transactions of the Royal Society of London 349: 93-102.
- Natale DA, Shankavaram UT, Galperin, MY, Wolf YI, Aravind L, et al. (2000) Towards understanding the first genome sequence of a crenarchaeon by genome annotation using clusters of orthologous groups of proteins (COGs). Genome Biology 1: h1-h9.
- Greagg MA, Fogg MJ, Panayotou G, Evans SJ, Connolly BA, et al. (1999) A read-ahead function in archaeal DNA polymerases detects promutagenic template-strand uracil. Proceedings of the National Academy of Sciences 96: 9045-9050.
- Tripathy S, Maiti NK (2014) Construction of Geobacillus thermoglucosidasius cDNA library and analysis of genes expressed in response to heat stress. Mol Biol Rep 41: 1639-1644.
Citation: Zhang W, Gu P, Wang N, Zhu W, Jiang M, et al. (2019) Effects of Cyanobacterial Blooms on Microbial Community Distribution in Surface Sediments in Lakes. J Bioremediat Biodegrad 10: 461.
Copyright: © 2019 Zhang W, et al. This is an open-a ccess article distributed under the terms of the Creative Commons Attribution License, which permits unrestricted use, distribution, and reproduction in any medium, provided the original author and source are credited.
Select your language of interest to view the total content in your interested language
Share This Article
Recommended Journals
Open Access Journals
Article Usage
- Total views: 4918
- [From(publication date): 0-2019 - Oct 30, 2025]
- Breakdown by view type
- HTML page views: 3940
- PDF downloads: 978

