Effect of the Little Ice Age on Climate and Vegetation Recorded byn-Alkanes and Glycerol Dialkyl Glycerol Tetraether Proxies
Received: 13-Jan-2016 / Accepted Date: 02-Feb-2016 / Published Date: 06-Feb-2016 DOI: 10.4172/2157-7617.1000331
Abstract
Organic matter preserved in sediments originates from aquatic and terrestrial sources in a basin. In the absence of anthropogenic influence, variation in its composition may be related to changes in climate and vegetation composition. Here, a 400 yr sedimentary record from the Barigui river was investigated using n-alkane distributions and glycerol dialkyl glycerol tetraether (GDGT) indices to assess any environmental changes which occurred in the transition from the Little Ice Age to modern times. Three stages were observed: (i) between 1600 and 1730 AD, the climate was warmer and was less humid, and herbaceous plants overlapped with woody plants; (ii) between 1730 and 1800, the temperature gradually decreased and the level of precipitation remained low, hence, so woody plants predominated; (iii) the last stage was from 1800 to the present day, when the temperature and precipitation increased, resulting in optimum conditions for the blooming of phytoplankton and aquatic plants.
Keywords: Climatic changes; Little ice age; n-Alkane distributions; GDGT proxies
Introduction
The period which was subjected to much colder winters followed by warmer periods is known as the little ice age (LIA). It documented as being between about 1300 and 1870 (Mann, 2002). However, climate change could vary geographically [1]. The period is divided into two phases; the first was around 1300 until the late 1400s and the second warmer period was in in the 1500s [2]. The period between 1600 and 1850 marks its height and was characterized by changes in the hydrological cycle and perturbation of the ecosystem [2-4].
Even although there much evidence for the LIA, the causes and mechanism are still under debate. The only certainty is that it was a global event. Most studies have focused on the northern hemisphere [3-5], and there are few studies demonstrating the occurrence of the event in the southern hemisphere. For instance, in South America [6,7], advance in glaciers in the Andes was demonstrated [8], as well as aridity in the lowlands of Argentina [9] and Venezuela [8], and there is evidence from mountain glaciers suggesting increasing glaciation in Patagonia [10]. In Brazil, some studies have demonstrated change in vegetation composition during the LIA and sea level regression in northeastern and southeastern Brazil [11-13].
At present, paleoclimate can be reconstructed due the widespread occurrence of biomarkers multi-proxy data derived from them. The spatial and temporal character of such putative climate epochs revived the discussion and understanding of and mechanism for the LIA, as well as of the implications for climate change in the future.
Typically, n-alkanes are derived from different sources (algae, photosynthetic bacteria and higher plants [14]. Different distribution patterns of n-alkanes in sediments provides information about different climatic environments and hence is widely used to understand the evolution of vegetation and reconstruct environmental changes [14,15]. The magnitude of the anthropogenic impact on the climate and the environment was recently measured from biomarker distributions [4,14]. Yet, some biomarkers can be more specific in their information than n-alkanes. For example, increasing attention has been driven to glycerol dialkyl glycerol tetraether (GDGT) compounds, polar basic constituents of the cell membrane and comprising a polar head group bonded to a non-polar hydrocarbon [16]. The structures of GDGTs are temperature dependent. When temperature increases, cyclopentane moieties are formed within the isoprenoid chain [17]. With more cyclopentane rings, the membrane is kept in a liquid crystalline state and, as a consequence, proton permeation is reduced.
According to Weijers et al. [18] there are some environmental controls on the distributions of GDGTs, so two indices were proposed for quantifying the degree of methylation (MBT) and cyclization (CBT), both being effective in palaeoenvironmental studies to reconstruct mean annual air temperature (MAAT). Since branched GDGTs are transported into water bodies, they become part of the sedimentary archive. Their distribution, expressed in the methylation index of branched tetraethers and cyclisation ratio of branched tetraethers (MBT-CBT), can be used to explain and assess past soil pH and temperature change on land, and in geological or recent times, including the last glacial- interglacial transition [18-20].
In this work, n-alkanes and GDGTs have been used to reconstruct and assess the LIA period in South Brazil. Information about changes in the composition of vegetation was obtained from n-alkane distributions And GDGTs provided information about mean air temperature over time.
Study area and sampling
The watershed of the Barigüi River lies on the First Parana Plateau, in the metropolitan region of Curitiba, South Brazil, between 25°13′24″and 25°38′23″ south and 49°15′00″ and 49°22′29″ west, facing a general north-south direction toward the cities of Almirante Tamandare, Curitiba, and Araucaria (Figure 1). The river is 67 km long, draining a watershed of 279 km2;, and with 120 km2; of drainage located in the municipality of Almirante Tamandare, 144 km2; in the municipality of Curitiba and 15 km2; in the municipality of Araucaria. The pattern of drainage is predominantly dendritic, Froehner, et al.
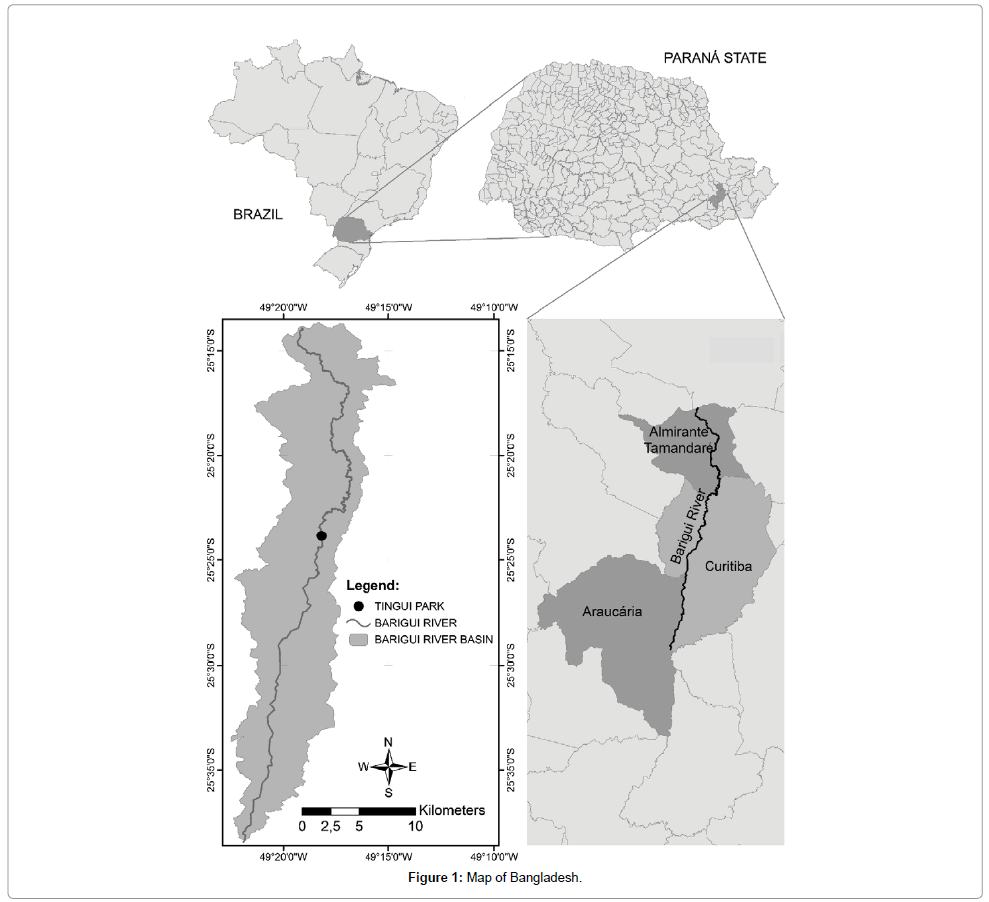
Figure 1: Map of Bangladesh.
Areas with dense terrestrial vegetation appear mainly to the north of the watershed, while aquatic macrophytes are present throughout the river, and limnological conditions vary along its length. The forest vegetation consists basically of caducifolia, subtropical trees of Araucaria angustifolia, Bracatinga (Mimosa scabrella) and tropical and subtropical rainforest [21]. Species of Myrtaceae, Lauraceae, Aquifoliaceae and Flacourtiaceae are also found. Herbaceous pteridophytes are predominant and consist of Poaceae, Cyperaceae and Dryopteridaceae, in addition to scrubs of the Solanaceae and Asteraceae [22]. Regardless of aquatic plants, three families of macrophytes are generally found in southern Brazil: Haloragaceae (Myriophyllum aquaticum), Onagraceae (Nymphoides indica) and Pontederiaceae (Eichhornia azurea) [23].
In the northern watershed, where a small village was settled, the predominant land use is still rural and there are only scattered urban areas. In the middle of the watershed, which contains part of the capital of the state (city of Curitiba), the occupation is preponderantly urban, with predominantly residential use, trade and services [24].
The weather in the area is subtropical humid and mesothermal, with warm summers, severe frosts in the winter and no dry season. The annual precipitation is quite well distributed and the mean air temperature in the last decade was 17.8°C [25].
The core (see below) was collected at 25°23'55.81″ latitude and 37°35'33.84″ longitude, in a municipal park (Tingui Park). The study area was selected due to previous monitoring campaigns, which define the area as reliable for collection and encompass the most significant data [21,24]. The Barigui River watershed corresponds to 35% of the city of Curitiba (total area). The selected site has been strongly influenced by urbanization, because the river flows from north to south through the city and hence has considerable potential to represent environmental shifts over time.
In 2011, a 100 cm sediment core (PT) was drilled using a small gravity corer with a 6 cm internal diameter (i.d.) barrel. It was extruded and sectioned at 2 cm intervals. The sections were stored at 4°C in an ice box. In the laboratory sub-samples were frozen at -20°C and later lyophilized prior to analysis [25].
Materials and Methods
Chronology
210Pb and fallout 137Cs dating were performed on bulk sediment, which had been ground to <63 μm, using an EG and G ORTEC® low background gamma spectrometer (hyper-pure Ge, model GMX25190P) following the method described by Figueira et al. [26]. Precision and accuracy were evaluated using three certified reference materials, IAEA-326 (soil), IAEA-327 (soil) and IAEA-385 (marine sediment), to determine the radionuclides of interest. The activity concentration obtained for the certified radionuclides were close to the reported values with mean deviation and error not exceeding 6%.
Two models were used to calculate the sedimentation rate [26]: concentration initial concentration of unsupported 210Pb (CIC) and constant rate of supply of unsupported 210Pb (CRS). The CIC model assumes a continuous sediment input to the system and results in a mean sedimentation rate for the core. The CRS model is intended for dating sediment profiles, but can be used to assess time-variable sedimentation rate. Mass accumulation rate (MAR) values were calculated on the basis of bulk density measurements and 210Pb and fallout 137Cs data. The age of sample deposition (I) was established, considering sample depth in the core (z) and time of core collection (A0), and sedimentation rate (v), according to I=A0−(v/z), and considering the time of core collection (2011). Below 56 cm (around 1770) dating becomes uncertain due to 210Pb values dropping to background level and the limitation of 210Pb dating methodology (250 yr; [26-28]). From that point, the depth age curve was extrapolated using the lower most calculated MAR, factoring in changes in laminate thickness [29].
Extraction and analysis of n-alkanes
The procedure proposed by Hofmann et al. [30] and Holtvoeth et al. [31] were followed. Briefly, bulk sediment (5 g) was extracted using an accelerated solvent extractor (ASE; Dionex) in 5-minute static cycles (100°C; 4 MPa) with a mixture of dichloromethane (DCM) and acetone (1:1 v/v). Internal standard (5α (H)-cholestane) was added prior to analysis. To the extracts, activated copper was added to remove the possible traces of sulphur.
The fraction containing n-alkanes was isolated using columns (7 mm i.d.) filled with silica gel (ca. 1.5 g) and eluted 3 × with 4 ml hexane. The solvent was removed from the n-alkane fraction with a gentle N2 flow prior to dissolution in 80 μ dichloromethane (DCM). A standard solution with 35 n-alkanes (AccuStandard alkanes mix DRH-008S-R2) was used to assign the gas chromatography (GC) peaks. Recovery was >70% for most of the n-alkanes.
The n-alkanes were assigned and quantified using an Agilent 6890 Series gas chromatography instrument equipped with flame ionization detection (GCFID) and fitted with a J and W Scientific D-5MS column (60 m × 0.25 mm i.d.; 5% phenyl/95% methyl polysiloxane, 0.1 μm film thickness). The carrier gas was He at 1.6 ml/min. The temperature program was: 60°C to 170°C (held 1 min) at 6°C/min, then to 315°C (held 10 min) at 2.5°C/min. The n-alkanes were assigned from their relative retention times compared with the standard. The quantification was achieved through relative peak area comparison and their respective peak area in the internal standard. The lower limit of quantification was 10 n/g sediment.
GDGTs
GDGT content and distribution in bulk sediments were used to calculate the MBT, CBT and branched and isoprenoid tetraether (BIT) indexes. GDGT structures are shown in Figure 2. Extractions and analysis were conducted according to procedures described by McClaymont, et al. [32] and Blaga, et al. [16]. Briefly, 5 g bulk sediment were extracted using an accelerated solvent extraction (ASE; Dionex) in 5 min static cycles (90°C 4 MPa) with DCM/MeOH (9:1 v/v). n-Tetracontane (C46; >98%, Sigma 87096) was added as internal standard. The extract was concentrated and separated using a flash column filled with activated silica (7 mm i.d., ca. 1.5 g) into two fractions-non-polar and polar. A mixture of hexane: EtOAc (1:1 v/v) was used as eluent for the non-polar fraction (including GDGTs), while the polar fraction was eluted with MeOH. The solvent was removed from the non-polar fraction and the residue dissolved in 2 ml 99:1 v/v hexane:isopropanol using sonication. Before injection, the solution was filtered through a 0.45 μm PTFE filter.
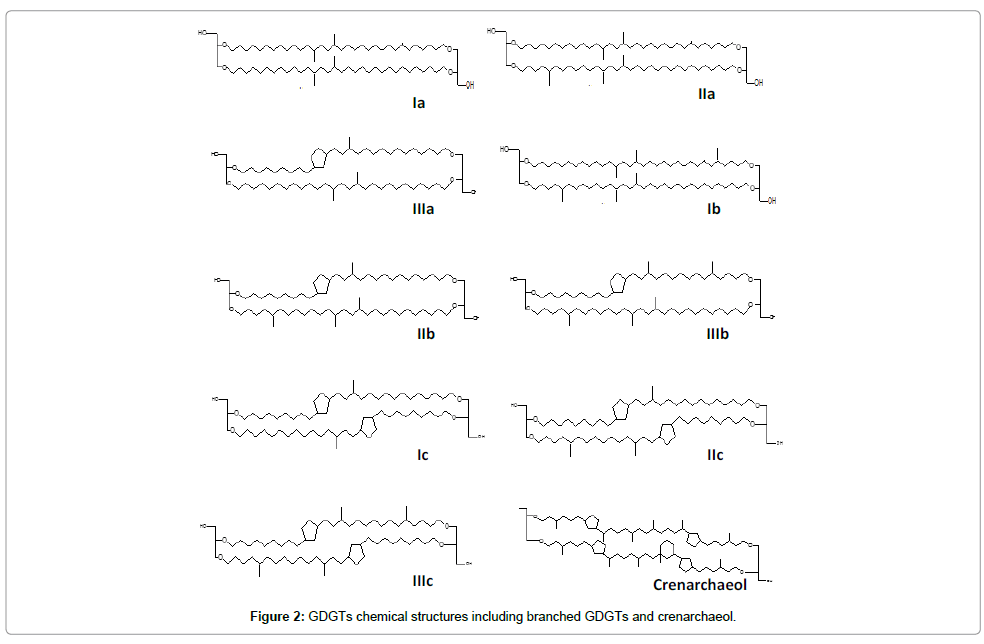
Figure 2: GDGTs chemical structures including branched GDGTs and crenarchaeol.
Determination of GDGTs was achieved using an Agilent 1200 high performance liquid chromatography (HPLC) instrument coupled to an Agilent 6130 quadrupole mass spectrometry (MS) instrument; a normal phase Grace Prevail Cyano HPLC column (3 m × 150 mm × 2.1 mm i.d.) and a guard column of the same material were used. Separation was achieved at 30°C and 0.2 ml. min with the following gradient: 1% isopropanol (IPA) in hexane (0-5 min); 1.8% IPA in hexane (at 25 min); 10% IPA in hexane at 30 min (held 10 min). Analysis was performed in single ion monitoring (SIM) mode via the [M+H]+ ions of crenarchaeol and branched GDGTs (1022, 1020, 1018, 1050, 1036, 1034, 1032, 1292). For calculation of indices, only the corresponding peaks with at least one order of magnitude above background noise were considered.
MBT, CBT and BIT indices were calculated using the Eqs. 1, 2 and 3 respectively [16]:
 (1)
(1)
 (2)
(2)
 (3)
(3)
The annual mean air temperature (MAAT) profile was obtained according to the Eq. 4, proposed by Buckles et al. [33]:
 (4)
(4)
Results
The relative abundance of n-alkanes is shown in Figure 3. In all the samples they ranged from C15 to C36 and the total concentration varied from 0.1 to 270 μg/g (Figure 4a). An abrupt variation in total concentration was observed in the segment corresponding to the 1900s. In the rest of core, the profile did not show any considerable change.
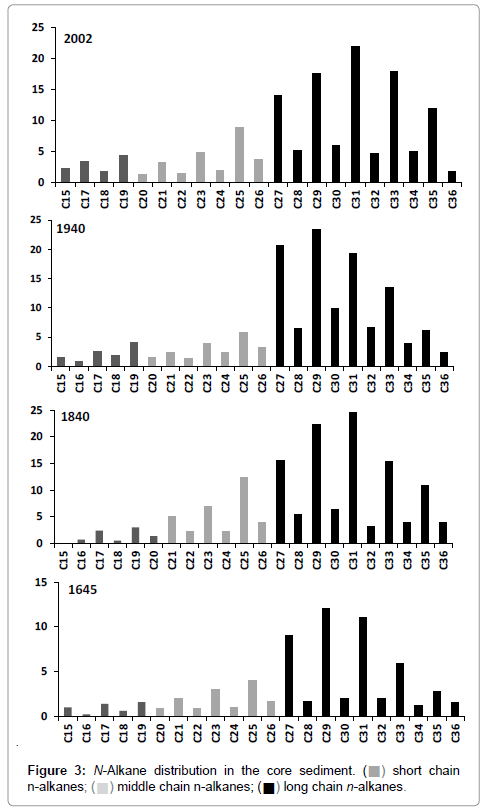
Figure 3: N-Alkane distribution in the core sediment. (?) short chain n-alkanes; (?) middle chain n-alkanes; (?) long chain n-alkanes.
The purpose of obtaining indices like MBT and CBT was the determination of past temperature, in other words, calculate the MAAT profile since 400 years ago to the present (Figure 4b). Until 1730, MAAT remained around 14°C and then decreased. A minimum could be observed in 1800 (10.2°C), followed by a sudden rise to 13.4°C in 1850. After then, an increase to 17.3°C in modern times was observed. Two unusual drops in temperature, in 1890 and 1970, were apparent.
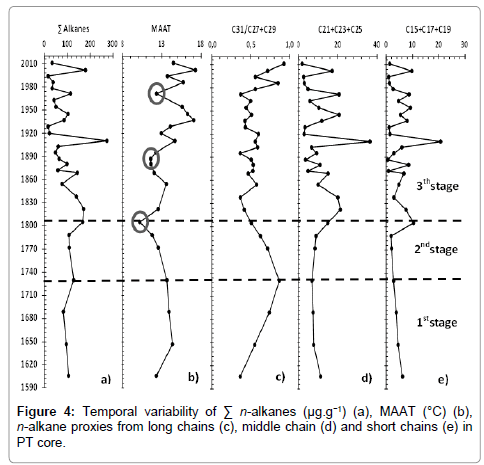
Figure 4: Temporal variability of Σ n-alkanes (μg.g−1) (a), MAAT (°C) (b), n-alkane proxies from long chains (c), middle chain (d) and short chains (e) in PT core.
According to Peterse, et al. [19], MBT is controlled by temperature and soil pH, whereas CBT is related only to the pH. Moreover, Peterse et al. [20] observed that the MBT-CBT ratio should only be used at sites with a catchment area where sufficient soil formation takes place and the soil thereby contains substantial amounts of branched GDGTs. To estimate the input of allochthonous terrigenous isoprenoid GDGTs, Weijers et al. [34] suggested using the BIT index. It is based on the relative abundance of crenarchaeol plus three main branched GDGTs produced by anaerobic soil bacteria. Values of the index range from 0 to 1. Values close to unity indicate soil organic matter input, whereas low values are associated with different organic material input, except for soil source. Here, the BIT index values were >0.96, accounting for a substantial soil input.
Although, the data are reliable for palaeoenvironmental studies, or MAAT reconstruction, it is necessary to consider the analytical error for both CBT and MBT indices, reflected in MAAT values. To minimize errors, a local validation is recommended [18]. Recent MAAT values here were compared with in situ measurements in 2002 to 2011 [25] and the difference ranged from 1.5 to 1.8°C higher than the MAAT reconstructed in here. A standard error of up to ± 5°C was reported between reconstructed and measured MAAT [17,18].
Discussion
n-Alkane distribution
The distribution was dominated by mid-long chains (>C20; Figure 3), with C29 and C31 dominant. In general, aquatic sources, such as algae and photosynthetic bacteria are dominated by C15, C17 and C19 [35]. Aquatic macrophytes commonly maximize at C21, C23 and C25 [36], whereas vascular plants contain high proportions of C27, C29 and C31 in their epicuticular wax [35]. The profile provided a clear guide to a terrestrial contribution of organic matter. Algae and photosynthetic bacteria have had a minimal contribution along the core.
Although non-emergent macrophytes (submerged and floating leaves) display enhanced abundances of mid chain n-alkanes (C21, C23 and C25), emergent macrophytes may have a distribution similar to those of terrestrial plants, typically dominated by long chains (>C27; [37]). Thus, Ficken et al. [36] formulated a proxy ratio (Paq) to discriminate the relative contribution of non-emergent/emergent macrophytes and terrestrial vegetation in the mid-chain distribution, using the relative proportion of mid chain to long chain homologues, as shown in Eq. 5:
 (5)
(5)
Where Paq<0.1 corresponds to terrestrial plants, 0.1-0.4 to emergent macrophytes and 0.4-1 to submerged/floating macrophytes. Here, the values ranged from 0.15 to 0.43 (avg. 0.23), indicating a mixed input, whereby emergent macrophytes were the predominant source of middle chains, with less contribution from submerged/floating macrophytes.
The carbon preference index (CPI): Eq. 6, was used to better understand and reconstruct the sources of carbon content in the core.
 (6)
(6)
The CPI index varied from 3.4 to 7.4. Higher plants retain water in their leaves by biosynthesis of epicuticular wax with long chain n-alkanes, while algae synthesize short n-alkanes, so CPI values >5 are attributed to a terrigenous source, while those close to unity can be associated with petroleum contamination [38].
Environmental significance of n-alkane variation
The Barigui River watershed is on the first plateau of the Parana state such that the declivity decreases from north to south. Significant anthropogenic influence in the area, such as deforestation and fecal pollution, started after 1840 with a rise in occupation [27,28]. Thus, before 1840 temperature and precipitation were the main factors controlling the development of terrigenous vegetation [39].
Palaeoenvironmental variation indicated by changes in vegetation are generally reported from pollen assemblages [40,41]. Some studies have demonstrated that the concentration of long chain n-alkanes (C27, C29 and C31) coincides well with pollen information in the same sequence [42,43,15]. Thus, long chain n-alkanes could reflect temperature and precipitation change, assuming that the vegetation cover is sensitive to climatic change and plays an active role in the climate system via feedback mechanisms [15]. In this study, C27, C29 and C31 were the predominant n-alkanes.
Woody plants are much more resistant to low temperature and humid conditions and are sources for C27 and C29, while herbaceous plants are the main source of C31 and are more sensitive to cold weather and arid weather. Thus, changes in the composition of terrigenous plants can be associated with changes in climate and hydrology conditions. According to Zhang et al. [44], Lin et al. [14] and Sun et al. [15] the ratio C31/(C27+C29) reveals the proportion of woody and herbaceous plants, and correlates with temperature and precipitation. The ratio shows that the values increase until 1730 and then gradually decrease (Figure 4c). After 1840, oscillations in the ratio can be attributed to human intervention, such as deforestation [27,28].
The biomass of aquatic plants (emergent and submerged/floating) is influenced by temperature, sunlight intensity, nutrient supply and dissolved inorganic carbon (DIC). In the Barigui River, due to the high biomass of aquatic macrophytes, their main source of nutrients is the sediment surface [23]. Thus, the nutrient supply in surface sediments is a limiting factor and a significant amount of nutrients is necessary for their growth. The main type of DIC used by aquatic macrophytes is HCO3 –. Due to small amount of DIC necessary for macrophyte photosynthesis [45], the water of Barigui River is sufficient to supply aquatic plant development and DIC is not a limiting factor [46]. With regard to sunlight, although its intensity under water is important for aquatic plants, the river is shallow. Nevertheless, their germination, flowering and dormancy are restricted by temperature. Thus, nutrient supply and temperature are obvious limiting factors for aquatic macrophytes in the river. Higher nutrient supply, on the other hand, is often associated with higher precipitation via run-off into the river [4,14,23,28]. Thereby, the sum of mid chain n-alkanes (C21+C23+C25) from aquatic plants could be associated with temperature and precipitation. In this study, the values were constant, until early 1800, when a sharp rise occurred in 1820, followed by a decrease until 1850. From a palaeoenvironmental viewpoint, this can be interpreted as an increase in temperature/precipitation in this period (Figure 4d). Significant oscillations were observed after 1850 until the present.
The sum of short chain n-alkanes (C15+C17+C19), which represent primary productivity, followed the same pattern as mid chain n-alkanes (Figure 4e), since algal and some photosynthetic bacterial biomass are also influenced by nutrients and temperature [14].
MAAT and vegetation cover variation
The results could separated into three stages (Figure 4). The stages are characterized by environmental changes since 1600 expressed in the n-alkane distributions and MAAT reconstruction (Figure 4). The stages seem to be a consequence of the LIA, in which the Earth became, on average, slightly colder [2]. The existence of three episodes of the LIA is generally accepted: at around 1600, 1770 and 1850, each separated by slight warming intervals [12], although the worldwide effects of might differ in time and magnitude.
Thus, in the first stage, between 1600 and 1730, it seems that vegetation resurfaced from adverse climatic conditions before 1600 (first minimum of the LIA). The MAAT around 14°C indicates a slight warming, reflected in the type of vegetation. Herbaceous plants steadily increased and predominated until 1730, superimposed on woody plants, according to the C31/(C27+C29) ratio (Figure 4c). Such behavior was also observed by Behling et al. in an area with similar characteristics to our study area (south Brazil). In the period between 1520 and 1770, Weinmannia sp., an endemic grass plant, became a common species in the Araucaria forest, suggesting a shift to warmer climate conditions on the highlands, consistent with the change observed here. Despite the variation in long chains, mid and short chains the n-alkane distribution (Figure 4d and 4e) reveals that aquatic plants and phytoplankton development were restricted by temperature and likely by a scarce supply of nutrients due to less humid climatic characteristics consistent with the LIA period.
The second stage is defined between 1730 and 1800. It encompasses a steady decline toward the second lowest temperature registered by the LIA (ca. 1770) reported by Pereira et al. [12]. Within 150 yr (1650 to 1800) the mean temperature dropped by 4.2°C (Figure 4b). This temperature defines the time of minimum temperature in the LIA registered in 1800 (Figure 4b). According to Mann et al. [1], the minimum in the LIA in the Pacific and Atlantic oceans occurred around 1800, coinciding with our data. The pattern of temperature decline is also reflected in the C31/(C27+C29) ratio (Figure 4c), which also declines, indicating low temperature and less humid climatic characteristics in this stage. In anomalous climatic conditions, woody plants tend to be more resistant than herbaceous plants. Results from Machado et al. reported, for the same core, a slight increase in the concentration of sitosterol, stigmasterol and campesterol, typical for higher plants, since 1730, concomitant with the decline in C31/(C27+C29) here. It is reasonable to suppose that the increase in sterols derived from higher plants in the sediments can be related to the deposition of dead and biodegraded biomass, probably because of decline in the temperature and less humid conditions observed in the second stage. Pereira et al. [12], also observed similar shifts in vegetation composition in southeast Brazil in the same periods the first and second stages of this study. Initially, a reduction of the forests and an increase of the savannah/fields were noticed. After that, the forest started to increase and finally, there was a recovery of the dense forest and a reduction of the savannah/fields. This suggests that the effect of the LIA was similar in several regions of Brazil. The absence of aquatic plant and phytoplankton blooms, reflected in mid and short chain n-alkanes respectively, in the second stage (Figure 4d and 4e) indicates that less humid conditions remained. Sea level regression, accompanied by drier conditions in the same period, was observed for Brazil [11-13], such observations supporting our findings.
The third, and final stage is between 1800 and the present. It corresponds to the end of the LIA, reported in several studies to be between 1850 and 1890 and marked by warming and wetter climate [47]. Both mid and short chain n-alkanes showed an increase from 1800 to 1850 reflecting terrestrial and submerged aquatic plant blooming (Figure 4d and 4e), due to warming and greater precipitation from 1800, also reported for Rio de Janeiro and Amazonia. An increase in precipitation affects runoff and consequently leads to higher nutrient input to the river, which is associated with the warming, results in a rise in primary productivity (phytoplankton and aquatic macrophytes). In this period the temperature increased roughly until the present (Figure 4b), but presented two significant decreases. The first was in 1890, also reported by Pereira et al. for southern Brazil and Mann et al. for the Atlantic and Pacific oceans. The second, around 1970, led to one of the coldest winters in the history of the region, including a snow event [48], which is rare due to the warm-temperate regional climate.
It is impossible to associate the n-alkane distribution of terrestrial and aquatic vegetation as a response to climatic changes in the PT core area after 1850, due to an anthropogenic influence in the study area from 1840, such as deforestation and bush fires [27,28] Although evidence of change in vegetation composition based on n-alkane distributions is limited by anthropogenic influence, warming observed here is in accord with local measurements from 1970.
Consideration of the LIA in South America
Most of the conventional records for the LIA were obtained from the northern Hemisphere, especially from Europe and North America [3-5]. The findings in this study corroborate several studies in Brazil [11-13,47] and some parts of South America [7,49], portraying the cooling and decrease in precipitation during the LIA, which showed a climatically anomalous period between 1550 and 1850. However, these findings contrast with an increase in precipitation in South America as reported by Peng and Miller [50] and Haug et al. [51]. The cause of the LIA remains uncertain and the cooling constitutes a meaningful climate event with significant historical consequences, which varied with time and space. Today, the iontertropical convergence zone (ITCZ) migration and southern oscillation (SO) [52] significantly influence the climate in South America. During the LIA climate shifts in the northern Hemisphere continents led to changes in climate in the whole world, including the ITCZ which due winds strengthening, shifted southward and low latitude continental areas became more arid [6]. In such conditions, other current of air masses were affected, diversifying the climate changes on a global level [53,6]. Thus, although studies of the effects of these climate shifts in South America remain limited, they seem to be linked to regional atmospheric factors, which may have contributed to anti-correlated findings in South America [54].
Despite questions about diversity in its effect and magnitude, the LIA period raises questions about the current increase in global average temperature. Currently, there is in debate the possibility of the Earth's climate change being a recovery from the LIA and that human activity is not the decisive factor in present temperature trends, although this idea is not widely accepted.
Conclusion
The evolution of vegetation and palaeoenvironmental changes in the south of Brazil since 1600 were revealed from n-alkane distributions and GDGT indices. Several studies reported in the literature and measurements in situ support these changes. Three distinct stages were observed in terms of changes in climate and vegetation, which correspond to the LIA period. The first (1600-1730) revealed slight warming (ca. 14°C) and less humid conditions i.e. there seems to have been be a recovery in the minimum temperatures before 1600. In this period, herbaceous plants overlapped woody plants, becoming predominant. Then, in the second stage (1730-1800) the temperature decreased gradually towards 10.2°C in 1800. Concomitantly, woody plants dominated herbaceous plants due to a decline in temperature and drier conditions. In the third stage, (1800-present) the end of the LIA was evident by way of warming and higher precipitation levels reflected in blooming of phytoplankton and submerged aquatic plants.
Although some LIA palaeoenvironmental information has been reported for the south of Brazil, studies are scarce and this study provides new information about climate and vegetation evolution during the LIA and the transition to the modern times.
Acknowledgements
K.S.M. would like to thank CAPES-Brazil for a doctoral scholarship. We extend our acknowledgments to B. van Dongen (University of Manchester) for GDGT analysis, T. Bleninger and C. Fernandes for assistance in the field, R. Figueira for the chronological data, and J. Sánez and J. Holtvoeth for comments.
References
- Mann ME, ZhangZ, RutherfordS, BradleyRS, Hughes MK, et al. (2009) Global signatures and dynamical origins of the Little Ice Age and Medieval Climate Anomaly. Science 326: 1256-1260.
- White S (2014) The Real Little Ice Age. Journal of Interdisciplinary History 44: 327-352.
- Dezileau L, Sabatier P, Blanchemanche P, Joly B, Swingedouw D, et al. (2011) Intense storm activity during the Little Ice Age on the French Mediterranean coast. Palaeogeography, Palaeoclimatology, Palaeoecology 299: 289-297.
- Leroy SAG, Lahijani HAK, Djamali M, Naqinezhad A, Moghadam MV, et al. (2011) Late Little Ice Age palaeoenvironmental records from the Anzali and Amirkola Lagoons (south Caspian Sea):Vegetation and sea level changes. Palaeogeography, Palaeoclimatology, Palaeoecology 302: 415-434.
- Stansell ND, Steinman BA, Abbott MB, Rubinov M, LacayoMR(2013) Lacustrine stable isotope record of precipitation changes in Nicaragua during the Little Ice Age and Medieval Climate Anomaly. Geology 41: 151-154.
- Gutierrez D, Sifeddine A, Field DB, Ortlieb L, Vargas G, et al. (2009) Rapid reorganization in ocean biogeochemistry off Peru towards the end of the Little Ice Age. Biogeosciences 6: 835-848.
- Morales M, Barberena R, Belardi JB, Borrero L, Cortegoso V, et al. (2009) Reviewing human-environment interactions in arid regions of southern South America during the past 3000 years. Palaeogeography, Palaeoclimatology, Palaeoecology 281: 283-295.
- Iriondo M (1999) Climatic changes in South America plains:Records of continent-scale oscillation. Quaternary International 57-58: 93-112.
- Cioccale MA (1999) Climatic fluctuations in the Central Region of Argentina in the last 1000 years. Quaternary International 62: 35-47.
- GroveJM(2001) The initiation of the Little Ice Age in regions round North Atlantic. Climatic Change 48: 53-82.
- Cohen MCL, Behling H, Lara RJ (2005) Amazonian mangrove dynamics during the last millennium:The relative sea-level and the Little Ice Age. Review of Palaeobotany and Palynology136:93-108.
- Pereira SD, Chaves HAF, Coelho LG (2009) The Little Ice Age in the region of the Sepetiba Bay, Rio de Janeiro-Brazil. Journal of Coastal Research 56: 252-256
- Oliveira FM, Macario KD, Simonassi JC, Gomes PRS, Anjos RM, et al. (2014) Evidence of strong storm events possibly related to the little Ice Age in sediments on the southern coast of Brazil. Palaeogeography, Palaeoclimatology, Palaeoecology 410: 1-7.
- Lin X, Zhu L, Wang Y, Wang J, Xie M,et al. (2008) Environmental changes reflected by n-alkanes of lake core in Nam Co on the Tibetan Plateau since 84 ka BP. Chinese Science Bulletin 53: 3051-3057.
- Sun D, Tan W, Pei Y, Zhou L, Wang H, et al. (2011) Late Quaternary environmental change of Yellow River Basin:An organic geochemical record in Bohai Sea (North China). Organic Geochemistry 42: 575-585.
- Blaga CI, Jan Reichart G, Schouten S, Lotter AF, Werne JP, et al. (2010) Branched glycerol dialkyl glycerol tetraethers in lake sediments:Can they be used as temperature and pH proxies? Organic Geochemistry 4: 1225-1234.
- Tierney JE, Russell JM, Eggermont H, Hopmans EC, Verschuren D, et al. (2010) Environmental controls on branched tetraether lipid distributions in tropical East African lake sediments. Geochimica et Cosmochimica Acta 74: 4902-4918.
- Weijers JWH, Steinmann P, Hopmans EC, Schouten S, SinningheDamsté JS (2011) Bacterial tetraether membrane lipids in peat and coal:Testing the MBT-CBT temperature proxy for climate reconstruction. Organic Geochemistry 42: 477-486.
- Peterse F, Schouten S, Van der Meer J, Van der Meer MTJ, SinningheDamsté JS (2009a) Distribution of branched tetraether lipids in geothermally heated soils:implications for the MBT/CBT temperature proxy. Organic Geochemistry 40: 201-205
- Peterse F, Kim JH, Schouten S, Kristensen DK, Koça N, et al. (2009b) Constraints on the application of the MBT/CBT palaeothermometer at high latitude environments (Svalbard, Norway). Organic Geochemistry 40: 692-699.
- Froehner S, Martins RF, (2008) Evaluation of the chemical composition of sediments from Rio Barigüi Metropolitan region of Curitiba. Quimica Nova 3: 2020-2046.
- Kozera C, Dittrich VAO, Silva SM (2006) Floristic composition of Araucaria Forest Montana Park, Barigüi, Curitiba, PR RevistaFloresta 36: 45-58.
- Maltchik L, Oliveira GR, Rolon AS, Stenert C (2005) Diversity and stability of aquatic macrophyte community in three shallow lakes associated to a floodplain system in the south of Brazil. Caracas 30: 166-170.
- Froehner S, Souza DB, Machado KS, Rosa EC (2010) Tracking Anthropogenic Inputs in Barigui River, Brazil, Using Biomarkers. Water Air Soil Pollution 210: 33-41
- SIMEPAR-Institute of Technology and Environmental Information http: //wwwsimeparbr-Acessed in 06/17/2014
- Figueira RCL, Tessler MG, MahiquesMM, Fukumoto MM (2007) Is there a technique for the determination of sedimentation rates based on calcium carbonate content? A comparative study on the Southeastern Brazilian shelf. Japanese Geotechnical Society 47: 649-656.
- Machado KS, FigueiraRCL, Côcco LC, Froehner S, Cristovão CVS, et al. (2014a) Sedimentary record of PAHs in the Barigui River and its relation to the socioeconomic development of Curitiba, Brazil. Science of the Total Environment 482-483: 42-52.
- Machado KS, Froehner S, Sanez J, Figueira RCL, Ferreira PAL (2014b) Assessment of historical fecal contamination in Curitiba, Brazil, in the last 400 years using fecal sterols. Science of the Total Environment 493: 1065-1072.
- SmittenbergRH, Pancost RD, Hopmans EC, Paetzel M, SinningheDamste JS, et al. (2004) A 400-year record of environmental change in an euxinic fjord as revealed by the sedimentary biomarker record. Palaeogeography, Palaeoclimatology, Palaeoecology 202: 331-351.
- Hofmann T, Micic V, Kruge AA, Koster J (2011) Natural, anthropogenic and fossil organic matter in river sediments and suspended particulate matter:A multi-molecular marker approach. Science of the Total Environment 409:905-919.
- Holtvoeth J, Vogel H, Wagner B, Wolff G (2010) Lipid biomarkers in Holocene and glacial sediments from ancient Lake Ohrid (Macedonia, Albania). Biogeosciences 7: 3473-3489.
- McClymont EL, Ganeshram RS, Pichevin LE, Talbot HM, van Dongen B, et al. (2012) Sea-surface temperature records of Termination 1 in the Gulf of California:Challenges for seasonal and interannual analogues of tropical Pacific climate change. Paleoceanography 27: 1-15.
- Buckles LK, Weijers JWH, Tran XM, Waldron S, SinningheDamsté JS (2014) Provenance of tetraether membrane lipids in a large temperate lake (Loch Lomond, UK):implications for glycerol dialkyl glycerol tetraether (GDGT)-based palaeothermometry. Biogeosciences 11: 5539-5563.
- Weijers JWH, Schouten S, Spaargaren OC, SinningheDamsté JS (2006) Occurrence and distribution of tetraether membrane lipids in soils:implications for the use of the TEX86 proxy and the BIT index. Organic Geochemistry 37: 1680-1693.
- Rieley G, Collier RJ, Jones DM, Eglinton G (1991) The biogeochemistry of Ellesmere Lake, UK—I:source correlation of leaf wax inputs to the sedimentary lipid record. Organic Geochemistry 17: 901-912.
- Ficken KJ, Li B, Swain DL, (2000) Ann-alkane proxy for the sedimentary input of submerged/floating freshwater aquatic macrophytes. Organic Geochemistry 31: 745-749.
- Su RL, Li W (2005) Advances in research on photosynthesis of submerged macrophytes. Chinese Bulletin of Botany 22: 128-138.
- Jeng WL (2006) Higher plant n-alkane average chain length as an indicator of petrogenic hydrocarbon contamination in marine sediments. Marine Chemistry 102: 242-251.
- Bertolo LS, Rocha JV, Young AF (2005) Temporal evolution of vegetation index the urban area of Curitiba-PR.SensoriamentoRemoto 16: 2051-2058.
- Empson L, Flenley J, Sheppard P (2002) Dated pollen record of vegetation change on Mayor Island (Tuhua) throughout the last 3000 years. Global and Planetary Change 33:329-337.
- Toledo MB, Bush MB (2008) Vegetation and hydrology changes in Eastern Amazonia inferred from a pollen record. Annals of the Brazilian Academy of Sciences 80: 1 91-203.
- Schwark, L, Zink, K, Lechterbeck, J (2002) Reconstruction of postglacial to early Holocene vegetation history in terrestrial Central Europe via cuticular lipid biomarkers and pollen records from lake sediments. Geology 30: 463-466.
- Zou SB, Cheng GD, Xiao HL, Xu BR, Feng ZD (2009) Holocene natural rhythms of vegetation and present potential ecology in the Western Chinese Loess Plateau. Quaternary International 194: 55-67.
- ZhangWJ, Gao ZQ (2005) Study on the response of vegetation cover to precipitation and temperature in Central/East Tibetan Plateau. Progress in Geography 24: 13-22.
- Pierini SA, ThomazSM (2004) Adaptations of submerged plants to inorganic carbon uptake.Acta Botanica Brasilica 18: 629-641.
- Müller CV, Athayde GB, Rosa Filho EF, Bittencourt AVL, Mantovani LE, et al. (2008) Hydrogeochemistry in Curitiba Ãguas Subterrâneas 22: 25Â38.
- Behling H, Pillar VD, Orlo L, Orloci L, Bauermann SG(2004) Late Quaternary Araucaria forest, grassland (Campos), fire and climate dynamics, studied by high-resolution pollen, charcoal and multivariate analysis of the Cambara. doSul core in southern Brazil. Palaeogeography, Palaeoclimatology, Palaeoecology 203: 277-297.
- SenkoEC (2012) Reflection on writing, theory and methodology of Curitiba History Outros. Tempos 9: 240-243.
- Kock J, Kilian R, (2005) Little Ice Age glacier fluctuations, Gran Campo Nevado, southernmost Chile. The Holocene 15: 20-28
- Peng X, Miller RL (2008) Abrupt seasonal migration of the ITCZ into the summer hemisphere. Journal of the Atmospheric Sciences 65: 1878-1895.
- Haug G, Hughen KA Sigman DM, Peterson LC, Rohl U (2001) Southward migration of the inter-tropical convergence zone through the Holocene. Science 293: 1304-1308.
- Hendy EJ, Gagan MK, Alibert CA, McCulloch MT, Lough JM, et al. (2002) Abrupt decrease in Tropical Pacific sea surface salinity at end of Little Ice Age. Science 295: 1511-1514.
- MayewskiPA,Rohling E, Stager JC, Karlén W, Maasch KA, et al. (2004) Holocene climate variability. Quaternary Research 62: 243-255.
- Zhu C, Weijers JWH, Wagner T, Pan JM, Chen JF, et al.(2011) Sources and distributions of tetraether lipids in surface sediments across a large river-dominated continental margin. Organic Geochemistry 42: 376-386.
Citation: Machadoa KS, Froehnerb S (2016) Effect of the Little Ice Age on Climate and Vegetation Recorded by n-Alkanes and Glycerol Dialkyl Glycerol Tetraether Proxies. 7: 331. Doi: 10.4172/2157-7617.1000331
Copyright: © 2016 Machadoa KS, et al. This is an open-access article distributed under the terms of the Creative Commons Attribution License, which permits unrestricted use, distribution, and reproduction in any medium, provided the original author and source are credited.
Share This Article
Recommended Journals
Open Access Journals
Article Tools
Article Usage
- Total views: 12329
- [From(publication date): 2-2016 - Jul 17, 2024]
- Breakdown by view type
- HTML page views: 11586
- PDF downloads: 743