Research Article Open Access
Effect of Spine Density on Excitability in Accumbal Medium Spiny Neurons-A Computational Approach
Mrunal Rane1,2* and Rohit Manchanda1
1Department of Biosciences and Bioengineering, IIT Bombay, Mumbai, Maharashtra, India
2Department of Biomedical Engineering, D. J. Sanghvi College of Engineering, Mumbai, Maharashtra, India
- *Corresponding Author:
- Mrunal Rane
Department of Biosciences and Bioengineering
IIT Bombay, Mumbai, Maharashtra, India
Tel: +91-22-25767765
E-mail: mrunal.rane@iitb.ac.in
Received date: June 28, 2017; Accepted date: July 19, 2017; Published date: July 26, 2017
Citation: Rane M, Manchanda R (2017) Effect of Spine Density on Excitability in Accumbal Medium Spiny Neurons-A Computational Approach. J Addict Res Ther 8:337. doi:10.4172/2155-6105.1000337
Copyright: © 2017 Rane M, et al. This is an open-access article distributed under the terms of the Creative Commons Attribution License, which permits unrestricted use, distribution, and reproduction in any medium, provided the original author and source are credited.
Visit for more related articles at Journal of Addiction Research & Therapy
Abstract
The nucleus accumbens (NAc), the major subdivision of the ventral striatum plays an important role in the reward pathway. GABAergic Medium Spiny Neurons (MSNs) are the principal cell type of NAc. These neurons receive excitatory synaptic inputs over the numerous spines which are present on their complex dendritic arbours. Alterations in spine density and morphology can affect the integrative properties of MSNs. We developed a biophysically realistic, spiny model of MSN. We found that inclusion of spines in an existing aspiny model changed passive as well as active properties of the cell. The spiny model was tuned to match its properties with that of the earlier aspiny model. We found that a total of 192 inputs from middle and distal dendrites were required to generate a characteristic bimodal behaviour of the membrane potential. Using this model, we investigated the effect of loss of spines on the excitability of the cell. We found that with no spine loss, when only the number of activated inputs was reduced by 15%, spike frequency of the cell reduced to zero, rendering the cell completely inexcitable. However, spine loss of 15% along with 15% reduction in activated synaptic inputs decreased the spike frequency to 1.1 Hz. Our results suggest that when spines are lost along with synaptic inputs, excitability of the cell is not abolished completely, although this might happen when only synaptic inputs are lost. Instead, in such a case the excitability can be increased by slightly enhancing the input connections.
Keywords
Nucleus accumbens; MSN; Spine density; Excitability
Introduction
NAc is the one of the brain regions, together with such region as ventral tegmental area (VTA), amygdala, prefrontal cortex (PFC) and septum involved in the rewarding and reinforcing effects of drugs of abuse [1-4]. Medium Spiny Neurons (MSNs) are the principal output cell of the NAc [5]. Dendrites of MSNs are covered with spines [6] which are tiny bulbous protrusions [7]. These spines receive glutamatergic excitatory inputs from prefrontal cortex (PFC), amygdala, thalamus and hippocampus [8]. The primary function of the spines is to increase the dendritic surface area in order to maximize potential synaptic connections [9]. There are many other functions which have been proposed for spines such as Ca2+ compartmentalization, electrical filtering, and isolation of synaptic inputs [9,10]. Spines prevent saturation of dendrites from activation of multiple inputs at the same time and contribute to the integration of synaptic inputs [9]. The morphology of spines is reported to be altered based on the learning experiences to which they are exposed. For example, in the immature hippocampus, the density and morphology of spines is altered during long-term potentiation (LTP) [11]. Deformities in spine morphology or density could have been implicated in several psychiatric or neurological diseases like Parkinson’s syndrome, dementia, Alzheimer’s disease, Schizophrenia, Attention Deficit Hyperactive Disorder (ADHD) and autism [12-14]. However, their role in these diseases is not yet clear. Experiments show that drugs of abuse can alter the dendritic branching complexity, as well as the number and size of dendritic spines on neurons in several brain regions depending on the type of the drug, nature of drug administration and neuronal cell type [15]. For example, morphine and cocaine alter the density of dendritic spines in MSNs [15-17]. In vitro studies carried out in rats [16] have shown that treatment with either amphetamine or cocaine increased the spine density in MSN of NAc shell. In this study rats were given injections of either 0.9% saline, 3 mg/kg D-amphetamine sulphate or 15 mg/kg cocaine HCl. Injections were given consecutively for 5 days and then repeated again after a break of 2 days. To monitor their motor activity, the rats were kept in the cages attached to running wheels. This condition was maintained for 24-25 days after which their brains were removed to study the alterations in the morphology of the MSN. A similar protocol was used in other experiments [17] which were carried out to examine the effect of morphine on the spine density in the MSN of NAc shell. The only difference between the two studies was instead of cocaine, in this study rats were injected with 10 mg/kg of morphine. After 24-25 days their brains were processed to study the alterations in the morphology of the MSN. It was found that the density of thin and immature decreased upon exposure to morphine.
Administration of cocaine was also found to elicit NMDA (N-Methyl-D-Aspartic Acid)-dependent LTP resulting in bigger, mushroom shaped, mature spines. Cocaine-induced changes in morphology and density of spines were observed in striatum and prefrontal cortex of rats after 45 min of acute cocaine administration [18]. Ethanol, as well as cannabinoid withdrawal, results in the hypodopaminergic state in the MSN of NAc which can cause a reduction in spine density in these neurons [19,20].
Spines are heterogeneous in size and shape and are modifiable depending on activity and experience [20]. These activity-dependent changes in their morphology and/or electrical properties may affect the integrative properties in MSNs. Loss of spines in alcohol-dependent rats has been shown to affect the intrinsic excitability of these neurons [21]. The aim of our current work is to investigate the effect of the change in spine density on synaptic excitability which in turn may affect information processing in MSNs. NAc is the key structure involved in the neuronal circuits implicated in addiction. Therefore, we decided to study the behaviour of its principal cell, the MSN, by varying spine density and synaptic input conditions.
To this end, a detailed model of MSN of NAc was developed which is based on existing models [8,22]. The model contains all the intrinsic currents known to be present in the MSN. The model has also included detailed synaptic currents which were employed for studying the effects of synaptic inputs on neuron behaviour. Unlike in a previous model [22], spines in our model were distributed randomly in all middle and distal dendrites (Methods). We have determined the number of spines required to be activated in order to display the characteristic bimodal behaviour of the membrane potential of the MSN cell.
Simulation studies have been carried out in the past to show the effect of spine loss on the neuronal output [19]. However, the structural changes (spine loss) were not incorporated in the model. Instead the conductance of 30% synapses was reduced to zero. Therefore, it would be difficult to determine the relationship between loss of spines and excitability of the cell. With this in mind, we investigated effects of loss of spines on MSN excitability by developing and validating a model of a MSN in which spines are also included. We explored the role of reduced spine density on input resistance of the cell as well as excitability. It was found that decrease in the spine density produced an enhanced input resistance (Rin) as well as excitability of the neuron. However, when spine density was reduced along with activated synaptic inputs, excitability diminished with increase in spine loss. Also, the number of spikes was greater as compared to that when only synaptic inputs were reduced. This implies that reduction in spine density lowered the excitability of the MSN significantly which in turn will also affect its functionality. However, since loss of spines increases Rin, a relatively small augmentation in synaptic inputs (by 5%) is sufficient to not just restore but increase the MSN’s excitability above control levels. We conclude that 15% spine loss increased the spike frequency by 18%. This implies that reduction in the spine density enhanced the excitability of the MSN significantly. This in turn may have implications for behaviours associated with responses to the intake of addictive substances. For instance, a reduction in the excitability of accumbal MSNs has been reported to enhance the stimulation of locomotor activity by cocaine [23]. Thus, as shown by our results, loss of spines, by virtue of enhancing Rin and thereby MSN excitability, could bring about a diminution in the stimulation of locomotor activity by cocaine. Such an effect may influence drug-induced locomotor activity, an important element in addiction-linked behaviour.
Methods
We developed a multi-compartment stylized model of the MSNs using the NEURON simulation platform. Our model is based on the model previously described in the literature [8,22,24]. Though the earlier model [8] was validated against experimental data, development of a physiologically realistic spiny model of a neuron can be of great use in exploring the true operating characteristics of MSNs. Therefore, the model was enhanced structurally and functionally. The model developed has four primary dendritic branches, as seen in Figure 1. Each of these bifurcates to produce 8 secondary dendrites, each of which further bifurcates to give a total of 16 tertiary dendrites.

Figure 1: Model of MSN (A) Stylized morphology showing soma. (B) Enlarged view from the shaded area of (A), showing soma, proximal, middle and distal dendrites, and spines (C) Schematic of a single spine. PSD: post synaptic density. Each red dot indicates location of a synapse on spine PSD.
In the earlier model [8] spines were not modelled explicitly, rather an area attributable to spines was compensated. This method aims to compensate for spines by appending their surface area to the dendritic surface area. The folding factor (F) previously derived [25] and was used in the earlier model [8], as a modifier for the evaluation of lengths and diameters of dendrites. Lengths and diameters of the dendrites were increased using following equations [8].

Where l and d are the length and diameter of the dendritic branch with spines and l’ and d’ corresponds to the scaled dimensions (without spines) of the same. We used these relations while developing the spiny model of the MSN. Lengths and diameters of the dendrites from the original model [8] were modified by keeping the axial resistance constant. The modified dimensions are provided in Table 1.
| Number | L (µm) | l' (µm) | D (µm) | d' (µm) | F | |
|---|---|---|---|---|---|---|
| Soma | 1 | 16 | - | 16 | ||
| Proximal dendrites | 4 | 20 | 20 | 2.25 | 2.25 | 1 |
| Middle dendrites | 8 | 20 | 24.23 | 1 | 1.1 | 1.33 |
| Distal dendrites | 16 | 190 | 395.2 | 0.5 | 0.72 | 3 |
Table 1: Anatomical dimensions of the model [8]; F is folding factor; l and d are the length and diameter of the dendritic branch with spines and l^' and d^' corresponds the scaled dimensions (without spines) of the same.
Spine morphology was divided into three parts: (i) the postsynaptic density (PSD), (ii) the head, and (iii) the neck [22] which is connected via an axial resistance. All the sections were modelled as cylinders with geometrical dimensions as shown in Table 2.
| Length (µm) | Diameter (µm) | |
|---|---|---|
| Spine PSD | 0.05 | 0.5 |
| Spine head | 1 | 1.175 |
| Spine neck | 1.5 | 0.1 |
Table 2: Dimensions of a spine [12]; PSD: Post synaptic density.
The distribution of the spines on dendrites is random [26]. Therefore, we distributed spines using a digitized spine density distribution curve [26] as shown in the Figure 2. In the previous work [26] spine density was calculated especially for a neuron in neostriatum. Spine density in neostriatum neurons varies as a function of distance from the soma and follows a specific trend which is similar in shape across different species such as cat [27], monkeys [28] and rat [26]. Figure 2 shows a number of spines per 10 μm as a function of distance from the soma. According to the spine density curve (black traces), the density of spine first rises peaking at a distance of about 50 to 60 μm from the soma and from there onwards, it declines almost linearly. There were almost no spines for first few micrometres from the soma. A linearized representative curve (Figure 2, red trace) was used for modelling purposes. According to this curve,

Figure 2: Black trace (digitized curve from earlier experiments [24]). Red trace-linearized graph used for modelling. Extrapolated graph marked from distance 200 to 293.33 was not used for modelling. Points marked in red are significant points used for calculations.
1. Spine density was zero for the initial 20 μm distance from the soma,
2. Beyond 20 μm from the soma it increased linearly, reached to a peak value of 25 spines/10 μm at a distance of 60 μm from the soma,
3. There onwards, it decreased linearly to 10 spines/10 μm at a distance of 200 μm, further decreasing to 0 at about 295 μm from the soma.
From the experimental studies [26], the average length from the soma to the tip of the tertiary dendrite was found to be 200 μm. This length was shorter than length of the scaled (no spines) as well as the un-scaled (with spines) neuron considered for the modelling in the previous computational study [8]. Therefore, the graph is extrapolated as shown in the figure and all the required values of spine density were calculated, as summarized in Table 3 (marked in red in Figure 2).
| Number of spines/10 µm | 0 | 12.5~13 | 25 | 10 | 6.78~7 | 0 |
| Distance from soma (µm) | 20 | 40 | 60 | 200 | 230 | 293.3 |
strong>Table 3: Significant points on spine density curve.
The total length of the un-scaled neuron of the modified model from the edge of the soma is,
Proximal dendrite+Middle dendrite+Distal dendrite (4)
=(20+20+190) μm=230 μm
Values shown in bold are calculated indirectly from the slope of the graph.
From the graph and calculated values, the number of spines was computed using the area under the curve.

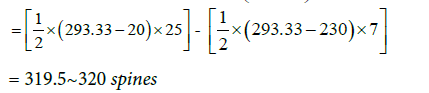
These are the total number of spines on each of the eight secondary dendrites and each of the 16 tertiary dendrites. The same method was used to calculate the number of spines present on middle dendrites which were equal to 12.5~13. Therefore, the total number of spines present on distal dendrite was equal to 307. The distribution of spines for an entire model is given in Table 4. 5016 spines in total were distributed randomly along the length of the middle and distal dendrites. All spines were endowed with uniform dimensions as mentioned in Table 2.
| Numbers | Number of spines/dendrite | Total number of spines | |
|---|---|---|---|
| Proximal dendrite | 4 | 0 | 0 |
| Middle dendrite | 8 | 13 | 104 |
| Distal dendrite | 16 | 307 | 4912 |
| Total number of spines | 5016 |
Table 4: Distribution of spines.
The model is endowed with fourteen intrinsic ionic currents, known to be present in MSNs. These include two types of sodium currents: fast and persistent sodium (NaF and NaP), six types of potassium currents: fast and slow A-type potassium (KAf and KAs), inward rectifying potassium (KIR) currents, 4-AP resistant persistent potassium currents (KRP), and large and small conductance calcium-dependent potassium currents (BKKCa and SKKCa). The following types of calcium currents are present: N-, Q-, R- and T-types, as well as high and low voltage activated L-type calcium currents (CaL1.2, CaL1.3). Conductance values of all the channels, except NaP, KAf and KIR were in accordance with previous studies [8,24]. The conductance of NaP, KAf and KIR was tuned to match the response of the spiny model to that of the aspiny model. Synaptic currents were also included in the model as point processes. Excitatory glutamatergic receptors are present on the spine PSD [22]. Therefore, the two types of glutamatergic synapses, namely AMPA (α-amino-3-hydroxy-5-methyl-4-isoxazolepropionic acid) and NMDA synapses were placed at each synapse on each spine PSD. They were co-localized at a 1:1 ratio, as done in earlier studies [8,22,29] making our model comparable with them in this respect. Inhibitory GABAergic (gamma amino butyric acid) synapses are present throughout the cell but have a higher concentration near the soma [30]. Hence, 16 GABA synapses were placed on the soma, three each in proximal and middle dendrites, and two in distal dendrites.
Tuning the model
Response to current injection: Membrane potential responses from the spiny model to somatic current injections were compared with those obtained from the original aspiny model [24] (Figure 3). On inclusion of all the spines in the model, Rin dropped by ~28% (Rin for the spiny model=59.45 MΩ and Rin for the aspiny model was 83 MΩ [24]). Also, a current of intensity 0.248 nA, which elicited a spike in the aspiny model, was not able to elicit a spike in a spiny model (red trace). A single spike with a longer latency was generated with higher current stimuli intensity (current amplitude 0.29 nA, latency 356 ms (green trace)).

Figure 3:Validation of the model by recording somatic voltage following current injection. Note that response of the model described previously [22] to current injection of 0.248 nA (blue dashed trace) closely matches with response from tuned spiny model employed in this study (orange trace) to the current injection of 0.245 nA.
In the previous computational study [8] leak and KIR conductances were tuned to the apparent Rin of their in vitro cells. Since KIR is the major determinant of Rin and KAs is responsible for the ramp potential, conductance of these channels along with leak conductance was tuned to match the ramp, Rin and latency of the spiny model with the corresponding features of the aspiny model. Rin for the tuned spiny model was 81 MΩ. When membrane potential was recorded in response to an injected current of 0.245 nA in the modified spiny model (orange trace), it was found to be similar to that obtained in the earlier model [8,24] (blue dashed trace) with a latency of 339 ms.
Response to synaptic inputs: Somatic voltage recordings in response to synaptic inputs are shown in the Figure 4. Transitions were observed from the down-state to the up-state and vice versa, and APs were generated only during the up-state. Out of a total 5012 spines, 95 (15 from middle dendrites and 80 from distal dendrites) were activated. A protocol similar to the one described earlier [8,24] was used to activate synaptic inputs. Each of the excitatory (AMPA and NMDA) synapses on spine PSD or inhibitory (GABA) synapses on dendrites received a spike train that was generated using NEURON. To make synaptic input activation stochastic, the following algorithm was followed. First, a spike train with a constant inter-spike interval (ISI) was generated at a frequency of 3 Hz for down-state and 7.5 Hz for up-state. Then, each spike in the train was shifted in time, the amount of shift being randomly chosen from a Gaussian distribution with a mean of 0 and a standard deviation of 25% of the ISI. Finally, the entire spike train was once again shifted in time randomly by a stochastically varying value between 0 and ISI. To provide completely random inputs to all the synapses, this procedure was repeated for each of the synapses.

Figure 4:Response to synaptic input. (A) Original aspiny model, (B) Spiny model: Result of activation of 95 spines (15 from middle and 80 from distal dendrites).
Since the synaptic drive was modelled as a train of spikes which activates synapses randomly, we performed 30 trials for each study involving synaptic drive. With each trial a different set of spines was activated which caused spike frequency to vary stochastically from trial to trial. The result was represented as the mean and the standard deviation of the spike frequency. Figure 4 shows the response of the aspiny and spiny model to synaptic input. In the aspiny model activation of 252 inputs resulted in 9 spikes (Figure 4A). In the spiny model, activation of 274 inputs also resulted in the same number of spikes (Figure 4B). Since the two responses match closely, this response was considered as a reference for our future trials. All the foregoing results repose confidence in the robustness of our spiny model, which was subsequently used to carry out further simulations.
Results
To observe the effect of loss of spines on the excitability of the MSN, simulations were carried out by eliminating spines from the model. Since excitatory inputs are formed on the spines, when spines are lost, along with them the inputs to the neuron are also lost [31,32]. The probability that new inputs might have formed during the pruning phase of the spines cannot be overlooked. These new inputs which are formed can be either equal or more than the number of spines which are lost so, the actual number of inputs to the neuron either remains the same or it can be greater (respectively). On these lines, simulations were carried for the following cases:
i. Only synaptic inputs are lost
ii. Only spines are lost (synaptic inputs remain the same)
iii. Spines, as well as synaptic inputs, are lost
iv. Spines are lost, but synaptic inputs are increased
To mimic loss of input connections, we reduced the number of spines activated. With a reduction in the number of inputs, a decrease in spike frequency was expected. When synaptic inputs were reduced by 10%, spike frequency was reduced by ~94% (mean spike frequency for a native model (neither inputs nor spines were lost was 6.27 ± 0.55 Hz while with loss of inputs it was 0.38 ± 0.36 Hz (Figure 5A)). With a 15% loss of inputs, the spike frequency fell to zero (Figure 5B). However, when only spine loss was modelled (without loss of inputs) spike frequency was enhanced as compared to that in the native model (Figure 5C). A 15% loss of spines caused roughly an 18% increase in the spike frequency (mean spike frequency with 15% spine loss being 7.38 ± 0.5 Hz).

Figure 5:Effect of loss of spines and/or inputs on excitability in MSN. Response to synaptic inputs (A) for a native model (15 spines from middle and 85 spines from distal dendrites were activated) (B) inputs were reduced by 15% (C) 15% spines were eliminated from the model (no loss of inputs) (D) 15% spines as well inputs were reduced (E) 5% inputs were increased along with 15% loss of spines.
We found that the loss of spines affected the input resistance (Rin) of the cell. With greater extents of spine loss, Rin increased commensurately (Figure 6), which may serve to increase the excitability of the neuron. But when synaptic inputs were lost along with the spines, the excitability was also supressed. When synaptic inputs were reduced by the same amount as lost spines, spike frequency was 1.1 Hz. The spike frequency went down by ~82% subsequent to 15% loss in both spine density as well as synaptic inputs (mean spike frequency with loss of spines as well as synaptic inputs was 1.11 ± 0.22 Hz compared with 6.27 ± 0.55 Hz in control, Figures 5D and 7).

Figure 6:Input resistance (Rin) as a function of spine loss. Rin increases with increase in spine loss. Zero percent spine loss indicates a native model. The value of Rin remains constant for all the trials for a specific case, it is not subjected to stochastic variation and hence Rin is not represented in terms of mean and standard deviation
As the spike frequency was enhanced when only spines were lost, it was expected that spike frequency would rise if inputs were increased. With only a 5% increase in synaptic inputs along with a 10% loss in spines, the spike frequency went up by 44% in comparison with spike frequency of the native model (mean spike frequency with a 10% loss of spines and a 5% increase in synaptic inputs was 9 ± 0.31 Hz, Figures 7 and 8).

Figure 7:Mean spike frequency and its standard deviation, as a function of loss of spines or/and inputs. The spike frequency increases with increase in spine loss (without loss of inputs). Note that, when only inputs are lost (15%), excitability reduced to zero but, along with spine loss, excitability is not completely abolished. Figures in the column indicate average spike frequency. In this study 30 trials were performed. With each trial different set of spines were activated. The result was represented as the mean and the standard deviation of the spike frequency.

Figure 8:Mean spike frequency and its standard deviation as a function of increase in number of inputs. The spike frequency increased with increase in inputs (spine loss=10%). Note that 5% increase in inputs caused spike numbers to increase from 6.2 to 9 (44% rise). In this study 30 trials were performed. With each trial different set of spines were activated. The result was represented as the mean and the standard deviation of the spike frequency.
Discussion
Ethanol withdrawal signs and symptoms appear after the discontinuation of prolonged ethanol consumption [21]. Morphological alterations in MSNs of NAc shell was found in rats subjected to ethanol withdrawal. It was found that ethanol withdrawal caused the density of thin long spines to reduce by 40%. This result suggested the occurrence of abnormal structural plasticity in MSN that was associated with alcohol withdrawal [21]. Impairment in DA signalling has been suggested to be the cause of the structural alteration in MSN. In view of these findings it was interesting to investigate effect of altered structure on synaptic excitability.
We developed an enhanced model of the MSN, previously reported in the literature [8,24]. The developed model includes spines in accordance with the spine density curve [26]. To make the model realistic, unlike in other models [22], we distributed spines randomly on each of the middle and distal dendrites. Inclusion of spines in the aspiny model increased the membrane surface area. Surface area of a cell is inversely related to its input resistance [6] and hence inclusion of spines in the model resulted in smaller Rin. After tuning the model, Rin of our validated model (after inclusion of spines), is 81 MΩ as compared with 83 MΩ in the aspiny model [24] both of which are within the range reported in the literature [5] for NAc neurons. Our model successfully emulated the passive and active properties of the physiological cell [8] as well as the previously validated models [8,24].
We found that the spiny model needed a higher number of inputs to yield the same number of spikes as compared to the aspiny model. In the aspiny model, synapses were formed on the dendritic shaft directly, and in the spiny model they were formed on the spines. Spines filter the synaptic potentials travelling from the synapse to the soma, thus attenuating the amplitude of the potential reaching the soma [29,33-35]. Such attenuation is additional to the attenuation caused by the dendrites. Therefore, though the Rin of both the models (after tuning of the spiny model) was the same, in the case of the spiny model a larger number of inputs was needed to generate the same number of spikes. The responses of the model to current injection and synaptic inputs matched with those of the physiological cell and the earlier model [8]. This placed confidence in the model, and we used it to carry out further simulations.
Altered spine density has been observed in alcohol as well cannabinoid-dependent rats. We performed simulations to examine the effect of loss of spines on the excitability of the MSN under various conditions (see results). It has been reported previously that loss of spines results in the strong reduction in the excitability of these neurons [19]. In one of the tested conditions in which 15% inputs were reduced (with no spine loss), spike frequency reduced to zero. This implies that loss of as little as 15% of the synaptic inputs makes the MSN completely inexcitable, pointing to the potency of synaptic inputs in regulating excitability. We observed that loss of spines led to an augmented value of Rin and for augmented excitability as compared to that when only inputs were reduced. A reduction in spine density of 15% (with same number of synaptic inputs) increased the spike frequency by 18%.
Reduction in only synaptic inputs (with no spine loss) did not affect Rin. The main function of the spine is to increase the membrane surface area so that larger number of connections can be formed on the dendrites of a neuron [9]. When spines are lost, the dendritic surface area is reduced and hence Rin is enhanced. A higher value of Rin results in a larger depolarization for the same value of injected current in turn leading to increased excitability. However, when spines are lost along with synaptic inputs, the effect of Rin on excitability was dominated by the reduced number of synaptic inputs. With greater loss in spines as well as synaptic inputs, the spike frequency was diminished. A reduction in spine density as well synaptic inputs of 15% reduced the spike frequency by 82%. These results indicate that as compared to the case where only inputs are lost the excitability was increased by 18% in the case where spines as well as synaptic inputs were lost.
We also examined the effect of increased synaptic inputs on neuron’s excitability. It was found that when one tenth of spines were lost, enhancing the synaptic inputs by 5% increased the spike frequency by 44%. Since a 10% spine loss caused Rin to increase, a small degree of enhancement in the synaptic inputs (of just 5%) was sufficient to increase the excitability of the cell. This implies an in-built compensatory mechanism; in that loss of spines itself results in a higher Rin and therefore higher excitability, such that a relatively small fraction of additional active synapses can compensate for spine loss. This compensation may represent a type of homeostatic process additional to the type proposed by [31], where the compensation takes place by means of enhanced signalling at remaining glutamate receptors.
NAc is involved in a variety of behaviours [36] and hence alteration in MSN excitability can have broad functional significance [24,37]. Changes in the cell behaviour in response to intrinsic-synaptic modulation have been found to be opposite to that due to intrinsic modulation [37]. It has been reported earlier that alcohol withdrawal in rodents [38] and non-human primates [39] resulted in an increased intrinsic excitability. The reverse held true in our study of synaptic modulation. When we mimicked alcohol withdrawal by reducing 15% spines, synaptic excitability reduced by 82%. We suggest that reduction in the excitability due to spine loss along with synaptic inputs is lesser as compared to the case when only inputs are lost. Since the loss of spines results in elevated Rin and excitability, enhancing input connections may restore the neuron’s altered excitability caused due to loss of spines and inputs.
Conclusion
This paper confines itself to the effects of loss of spines on the excitability of MSNs. However, during cannabinoid or alcohol withdrawal, where spines are lost, other functional changes are also noticed. For instance, the hypodopaminergic state observed in these disorders is held to be responsible for increased NMDA current in MSNs [21]. Activation of dopamine receptors modulates intrinsic as well as synaptic currents [40]. Therefore, reduced dopamine levels may exert lesser modulatory effects on these currents in the case of drug addiction or withdrawal. The role of these factors along with spine loss is yet to be explored.
We have simulated the possible conditions which may occur during alcohol or cannabinoid withdrawal states. These conditions remain to be verified by further experimental studies. Such studies might answer questions relating to the extent to which synaptic inputs are reduced when, in ethanol- or in cannabinoid-dependent rats, loss of spines occurs. They may also help reveal whether new spines are also formed during the pruning process. The answers to such questions are likely to shed light on the effects of loss of spines on neuronal input-output processing in addictive disorders.
Acknowledgement
We would like to thank Department of Biotechnology, New Delhi for their financial support (project no. BT/PR12973/MED/122/47/2016) for this project.
References
- Hyman SE, Malenka RC, Nestler EJ (2006) Neural mechanisms of addiction: The role of reward-related learning and memory. Annu Rev Neurosci 29: 565-598.
- Lüscher C, Malenka RC (2011) Drug-evoked synaptic plasticity in addiction: From molecular changes to circuit remodeling. Neuron 69: 650-663.
- Dichter GS, Damiano CA, Allen JA (2012) Reward circuitry dysfunction in psychiatric and neurodevelopmental disorders and genetic syndromes: Animal models and clinical findings. J Neurodev Disord 4: 19.
- Dubuc B (2017) The brain from top to bottom.
- O��?Donnell PO, Grace AA (1995) Synaptic interactions among excitatory afferents to nucleus accumbens neurons: Hippocampal gating of prefrontal cortical input. The J Neurosci 15: 3622-3639.
- Wilson CJ (1984) Passive cable properties of dendritic spines and spiny neurons. J Neurosci 4: 281-297.
- Fiala JC, Spacek J, Harris KM (2002) Dendritic spine pathology: Cause or consequence of neurological disorders? Brain Res Brain Res Rev 39: 29-54.
- Wolf JA, Moyer JT, Lazarewicz MT, Contreras D, Benoit-Marand M, et al. (2005) NMDA/AMPA Ratio impacts state transitions and entrainment to oscillations in a computational model of the nucleus accumbens medium spiny projection neuron, The J Neurosci 25:9080-9095.
- Yuste R (2011) Dendritic spines and distributed circuits. Neuron 71: 772-781.
- Koch C, Zador A (1993) The function of dendritic spines: Devices sub serving biochemical rather than electrical computation. J Neurosci 13 413-413.
- Matsuzaki M, Honkura N, Ellis-Davies GC, Kasai H (2004) Structural basis of long-term potentiation in single dendritic spines. Nature 429: 761-766.
- Villalba RM, Lee H, Smith Y (2009) Dopaminergic denervation and spine loss in the striatum of MPTP-treated monkeys. Exp Neurol 215: 220-227.
- Penzes P, Cahill ME, Jones KA, VanLeeuwen JE, Woolfrey KM (2011) Dendritic spine pathology in neuropsychiatric disorders. Nat Neurosci 14: 285-293.
- Villalba RM, Smith Y (2013) Differential striatal spine pathology in Parkinson��?s disease and cocaine addiction: A key role of dopamine? Neuroscience 251: 2-20.
- Russo SJ, Dietz DM, Dumitriu D, Morrison JH, Malenka RC, Nestler EJ (2010) The addicted synapse: Mechanisms of synaptic and structural plasticity in nucleus accumbens. Trends Neurosci 33: 267-276.
- Robinson TE, Kolb B (1999a) Alterations in the morphology of dendrites and dendritic spines in the nucleus accumbens and prefrontal cortex following repeated treatment with amphetamine or cocaine. Eur J Neurosci 11: 1598-1604.
- Robinson TE, Kolb B (1999) Morphine alters the structure of neurons in the nucleus accumbens and neocortex of rats. Synapse 33: 160-162.
- van Spronsen M, Hoogenraad CC (2010) Synapse pathology in psychiatric and neurologic disease. Curr Neurol Neurosci Rep 10: 207-214.
- Spiga S, Lintas A, Migliore M, Diana M (2010) Preclinical study: Altered architecture and functional consequences of the mesolimbic dopamine system in cannabis dependence. Addiction biology 15: 266-276.
- Peterson VL, McCool BA, Hamilton DA (2015) Effects of ethanol exposure and withdrawal on dendritic morphology and spine density in the nucleus accumbens core and shell. Brain Res 1594: 125-135.
- Spiga S, Talani G, Mulas G, Licheri V, Fois GR, et al. (2014) Hampered long-term depression and thin spine loss in the nucleus accumbens of ethanol-dependent rats. Proc Natl Acad Sci USA 111: E3745-E3754.
- Mattioni M, Le Novère N (2013) Integration of biochemical and electrical signaling multiscale model of the medium spiny neuron of the striatum. PloS one 8: e66811.
- Dong Y, Green T, Saal D, Marie H, Neve R, et al. (2006) CREB modulates excitability of nucleus accumbens neurons. Nature neuroscience 9: 475.
- Steephen JE, Manchanda R (2009) Differences in biophysical properties of nucleus accumbens medium spiny neurons emerging from inactivation of inward rectifying potassium currents. J Comput Neurosci 27: 453-470.
- Segev I, Burke RE (1998) Compartmental models of complex neurons. In Methods in neuronal modeling: From ions to networks (2nd ed. pp. 93-136), C Koch & I Segev (Eds.), Cambridge, MA: MIT Press.
- Wilson CJ, Groves PM, Kitai ST, Linder JC (1983) Three-dimensional structure of dendritic spines in the rat neostriatum. J Neurosci 3: 383-388.
- Kemp JM, Powell TPS (1971) The termination of fibres from the cerebral cortex and thalamus upon dendritic spines in the caudate nucleus: A study with the Golgi method. Philos Trans R Soc Lond B Biol Sci 262: 429-439.
- Pasik P, Pasik T, DiFiglia M (1975) Quantitative aspects of neuronal organization in the neostriatum of the Macaque monkey. Res Publ Assoc Res Nerv Ment Dis 55: 57-90.
- Bloodgood BL, Giessel AJ, Sabatini BL (2009) Biphasic synaptic Ca influx arising from compartmentalized electrical signals in dendritic spines. PLoS Biol 7: e1000190.
- Fujiyama F, Fritschy JM, Stephenson FA, Bolam JP (2000) Synaptic localization of GABAA receptor subunits in the striatum of the rat. Eur J Neurosci 416: 158-172.
- Day M, Wang Z, Ding J, An X, Ingham CA, et al. (2006) Selective elimination of glutamatergic synapses on striatopallidal neurons in Parkinson disease models. Nat Neurosci 9: 251.
- Azdad K, Chà vez M, Bischop PD, Wetzelaer P, Marescau B, et al. (2009) Homeostatic plasticity of striatal neurons intrinsic excitability following dopamine depletion. PloS ONE 4: e6908.
- Araya R, Jiang J, Eisenthal KB, Yuste R (2006) The spine neck filters membrane potentials. Proc Natl Acad Sci USA 103: 17961-17966.
- Gulledge AT, Carnevale NT, Stuart GJ (2012) Electrical advantages of dendritic spines. PLoS ONE 7: e36007.
- Koch C, Zador A (1993) The function of dendritic spines: Devices sub serving biochemical rather than electrical computation. J Neurosci 13: 413-413.
- Mermelstein PG, Song WJ, Tkatch T, Yan Z, Surmeier DJ (1998) Inwardly rectifying potassium (IRK) currents are correlated with IRK subunit expression in rat nucleus accumbens medium spiny neurons. J Neurosci 18: 6650-6661.
- Steephen JE (2011) Excitability range of medium spiny neurons widens through the combined effects of inward rectifying potassium current inactivation and dopaminergic modulation. Neurocomputing 74: 3884-3897.
- Marty VN, Spigelman I (2012) Long-lasting alterations in membrane properties, K+ currents and glutamatergic synaptic currents of nucleus accumbens medium spiny neurons in a rat model of alcohol dependence. Front Neurosci 6: 1-15.
- Carlson VCC, Seabold GK, Helms CM, Garg N, Odagiri M, et al. (2011) Synaptic and morphological neuroadaptations in the putamen associated with long-term, relapsing alcohol drinking in primates. Neuropsychopharmacology 36: 2513.
- Moyer JT, Wolf JA, Finkel LH (2007) Effects of dopaminergic modulation on the integrative properties of the ventral striatal medium spiny neuron. J Neurophysiol 98: 3731-3748.
Relevant Topics
- Addiction Recovery
- Alcohol Addiction Treatment
- Alcohol Rehabilitation
- Amphetamine Addiction
- Amphetamine-Related Disorders
- Cocaine Addiction
- Cocaine-Related Disorders
- Computer Addiction Research
- Drug Addiction Treatment
- Drug Rehabilitation
- Facts About Alcoholism
- Food Addiction Research
- Heroin Addiction Treatment
- Holistic Addiction Treatment
- Hospital-Addiction Syndrome
- Morphine Addiction
- Munchausen Syndrome
- Neonatal Abstinence Syndrome
- Nutritional Suitability
- Opioid-Related Disorders
- Relapse prevention
- Substance-Related Disorders
Recommended Journals
Article Tools
Article Usage
- Total views: 3417
- [From(publication date):
August-2017 - Jul 01, 2025] - Breakdown by view type
- HTML page views : 2560
- PDF downloads : 857