Research Article Open Access
Effect of Salinity and Potassium Levels on Different Morpho-Physiological Characters of two Soybean (Glycine max L.) Genotypese
| Hashi US1, Karim A2, Saikat HM2, Islam R2and Islam MA3* | |
| 1EXIM Bank Agricultural University, Bangladesh | |
| 2Bangabandhu Sheikh Mujibur Rahman Agricultural University, Bangladesh | |
| 3Department of Genetics and Plant Breeding, EXIM Bank Agricultural University, Bangladesh | |
| Corresponding Author : | Dr. Md. Ariful Islam Department of Genetics and Plant Breeding EXIM Bank Agricultural University Bangladesh Tel: +88-01711872774 E-mail: i.aarif@yahoo.com |
| Received: March 25, 2015 Accepted: July 04, 2015 Published: July 09, 2015 | |
| Citation:Hashi US, Karim A, Saikat HM, Islam R, Islam MA (2015) Effect of Salinity and Potassium Levels on Different Morpho-Physiological Characters of two Soybean (Glycine max L.) Genotypes. J Rice Res 3: 143. doi:10.4172/2375- 4338.1000143 | |
| Copyright: ©2015 Hashi US, et al. This is an open-access article distributed under the terms of the Creative Commons Attribution License, which permits unrestricted use, distribution, and reproduction in any medium, provided the original author and source are credited | |
| Related article at Pubmed, Scholar Google | |
Visit for more related articles at Rice Research: Open Access
Abstract
A field experiment was conducted in the field of Department of Agronomy of Bangabandhu Sheikh Mujibur Rahman Agricultural University, Gazipur, Bangladesh to assess the effect of potassium on different mineral ions accumulation pattern in leaves of salt affected soybean and to draw the relationship between the dry matter production and mineral ions accumulation in leaves for better understanding the effect of potassium in mitigating salinity stress. The plant height decreased with the increase in salinity levels. In general, Galarsum (V1 ) was taller than Bangladesh Soybean-4 (V2 ) at all levels of salinity. Potassium in general increased relative plant height under salinity. Galarsum with K2 (119.52 kg/ha) potassium showed relatively higher plant height at mild salinity, though at the high level of salinity the plant height increased with the higher level of potassium. The minimum relative plant height of Galarsum was obtained at the highest salinity with no potassium fertilizer. Application of different levels of K increased the production of relative stem dry weight at both 5 dS/cm (S1 ) and 7.5 dS/cm (S2 ) levels of the salinity compared to the control (S0 ). At 5 dS salinity the relative stem DW in Galarsum ranged from 46 to 66% and that at 7.5 dS salinity from 35 to 40%. Whereas, in Bangladesh Soybean-4 the stem DW ranged from 58 to 75% at S1 and that from 34 to 52% at S2 level of salinity. Therefore, the percent reduction in stem DW due to salinity was more in V2 than V1 when salinity increased from S1 to S2 under K0 and K1 potassium treatments. Moreover, the positive effect of K on the production of relative stems DW under different level of salinity. Irrespective of K levels salinity decreased the leaf dry weight in both the genotypes and the reduction in leaf DW increased with the increasing of salinity levels. The leaf DW of Galarsum (V1 ) was much higher than that of Bangladesh Soybean-4 at all level of salinity and potassium. At the control (S0 ) the increasing levels of K application decreased the leaf DW production in V1 , though in V2 the weight increased substantially. The relative leaf DW of two soybean genotypes increased with increasing K application in each salinity level except S1 K2 , S2 K3 treatments of V1 . Bangladesh Soybean-4 showed higher negative relationship (y=-40.89x+17.92, R2 =0.80) than Galarsum (y=-46.96x+24.22, R2 =0.74) between Na:Ca ratio and total dry weight. The R2 value indicates that about 73% of the contribution to the TDW of V1 and 80% of V2 can be explained by the Na:Ca ratio. TDW decreased with increasing Na:Ca ratio concentration in leaves of two soybean genotypes.
| Keywords |
| Salinity; Potassium level; Stress; Plant height; Mineral ions accumulation |
| Introduction |
| Salinity is a great problem in agriculture, especially in the coastal areas of the world. In many arid and semi-arid regions the soil salinity is caused by natural processes or by crop irrigation with saline water [1]. The United Nations Environment Program (UNEP) estimated that 20% of the agricultural land is salt affected in the world [2,3]. Also reported the matter where he claimed that over 8 × 10⁸ ha, which is about 6% of the worlds land area is affected by salinity. In Bangladesh, about twenty percent of land in the southern coastal belt is affected by various degrees of salinity. The salinization in Bangladesh is mainly caused by seepage of seawater, inundation of coastal land with seawater due to cyclone and intrusion of brackish water into sweet water river during dry season [4]. Most of the salt stresses in nature are due to Na+ salts, particularly NaCl. Sodium is a nonessential plant nutrient for most of the crops. High salt content, especially high Na+ accumulation, reduces the growth and development of a plant by affecting physiological processes, including modification of ion balance, water status, mineral nutrition, stomatal behavior, and photosynthetic efficiency. Plant physiological processes at both whole plant and cellular levels are affected by osmotic and ionic stresses caused by salinity [5]. High concentration of salts in the root zone reduces soil water potential. Consequently, plant cannot uptake water freely from the soil, and the deficiency of water causes dehydration at the cellular level. So far, a large number of experiments employing more than hundreds of soybean genotypes have been conducted at the Department of Agronomy of Bangabandhu Sheikh MujiburRahman Agricultural University for evaluating the genotypic variations in yield performance and their salt tolerance generally, salinity impaired the normal uptake of K+ as well as other essential plant nutrients in soybean found that the grain and dry matter yield of wheat at both saline and sodic soil increased significantly by addition of also showed that improving K nutrition of plants under salt stress could be essential in minimizing oxidative cell damage, at least in part by reducing reactive oxygen species (ROS) formation during photosynthesis. Therefore, it is important to examine that whether application of higher levels of potassium could ameliorate the toxic effect of salinity on nutrients uptake and subsequent growth in soybean. Such possibility was disclosed by [4,6-9]. Where they found that application of higher potassium doses enhanced the salinity tolerance of mungbean (Vigna radiata). This study was therefore, initiated with the following objectives: |
| 1. To assess the effect of potassium on different mineral ions accumulation pattern in leaves of salt affected soybean and |
| 2. To draw the relationship between the dry matter production and mineral ions accumulation in leaves for better understanding the effect of potassium in mitigating salinity stress. |
| Materials and Methods |
| An experiment was carried out at department of Agronomy, Bangabandhu Sheikh Mujibur Rahman Agricultural University, Gazipur, Bangladesh. The plants were grown in plastic pots of 24 cm (diameter) ×30 cm (height) under natural sunlight inside vinyl house. The pots were filled with 14 kg of air-dried soils. Four levels of potassium and three levels of salinity were the treatment variables. The source of potassium was muriate of potash (MP). Genotypes: V1=Galarsum and V2=Bangladesh Soybean-4, Four different Potassium: Four levels, namely K0=Control or native potassium, K1=Recommended dose (RD) i.e.59.76 kg/ha, (Fertilizer Recommendation Guide, BARC), K2=double to the RD i.e.119.52 kg/ha and K3=triple to the RD i.e.179.28 kg/ha. Salinity: Three levels of salinity created by dilution of sea water such as S0=Control (tap water), S1=5.0 dS/m and S2=7.5 dS/m. Eight healthy seeds were sown in each pot on 17 April 2012. Immediately after sowing seed, a light irrigation was given for the ease of seed germination. Nitrogen, phosphorus, sulphur and boron were applied as urea, TSP, gypsum and borax at the rate of 60, 175, 120, 115 and 10 Kg per hectare respectively for all treatment. The amount of different fertilizers for each pot containing 8 kg dry soil was calculated and mixed with soil during pot filling. Thinning was done during the appearance of second trifoliate and kept two uniform and healthy plants in each pot. Weeding was done intensively to keep the pots weed free. To protect the plant from cutworm Carate was sprayed when it was needed. Irrigation was applied with tap water in all the pots up to imposition of salinity treatment. Tap water of 0.1 dS/cm electrical conductivity (EC) was applied to the pots up to the emergence of 1st trifoliate leaf. Afterwards the tap water was applied only to the control plot. Seawater was collected from the Bay of Bengal at the Cox’s Bazar point. The initial EC value of the seawater was 49 dS/m. The seawater was diluted with tap water and a sufficient amount of diluted seawater of 2.5 dS/m was applied to the pots in excess so that the excess seawater dripped out from the bottom of the pots. Two days later the diluted seawater of 5.0 dS/m (S1) was applied similarly. As the salinity concentration of the applied solution increased by 2.5 dS/cm every alternate day, it increased to 7.5 dS/m (S2) after 4 days of salinity imposition. Thus, the salinity treatments were S0=Control, S1=5.0 dS/m and S2=7.5 dS/m. The saltwater was applied till harvest, on 27 August, 2013. The salinity was applied for 3 months and 14 days. After harvest, the plants were partitioned into root, stem, leaf and pod (in Bangladesh soybean-4 only). Therefore, it was not possible to collect yield data in either of the two genotypes. The plant parts were oven dried at 700C for 72 hours. Total dry weight (DW) was calculated by summing up the dry weight of roots, stem, leaf and petiole of the plant. Shoot DW was calculated by excluding dry weight of root from total dry weight. Root: shoot ratio was calculated for all the treatments. The sodium, potassium, calcium and magnesium contents of leaves were analyzed. The leaves were collected after harvesting the plants. Leaves those dropped during treatment imposition were also considered for measuring leaf DW. The exchangeable nutrients (Na, K, Ca and Mg) was extracted with neutral and measured with Atomic Absorption Spectrophotometer (Model No 170-30. HITACHI. Japan). The design used for this experiment was Randomized Complete Block Design. The data recorded on different parameters were statistically analyzed with the help of MSTAT program. The difference between the treatments means were compared by the least significant difference (LSD) test at 5% level of significance after calculating analysis of variance (ANOVA). Correlation coefficients were calculated between total dry weight and concentrations of mineral ions accumulated in leaves. |
| Results |
| Salinity affected plant height of both the soybean genotypes. The plant height decreased with the increase in salinity levels. In general, Galarsum (V1) was taller than Bangladesh Soybean-4 (V2) at all levels of salinity. Potassium in general increased relative plant height (percent value to the control) under salinity. However, under control condition K increased plant height in V1 only and there was no effect of K on V2. Galarsum with K2 potassium showed relatively higher plant height at mild salinity (S1: 5 dS/cm), though at the high level of salinity (S2: 7.5 dS/cm) the plant height increased with the higher level of potassium. The minimum relative plant height (76%) of Galarsum was obtained at the highest salinity (S2) with no potassium fertilizer. Relative plant height of this genotype ranged from 87% to 101% at S1 salinity level and that was 76% to 92% at S2 salinity (Table 1). |
| In case of Bangladesh Soybean-4 (V2) K did not affect the plant height under control condition, though the plant height was increased with increasing potassium at both salinity levels. Relative (per cent of control) plant height of this genotype ranged from 82% to 93% at S1 salinity and that was 67% to 76% at S2 level of salinity.Therefore, application of increasing rate of potassium increased relative plant height more in V1 than V2 |
| Application of different levels of K increased the production of relative stem dry weight (DW) at both 5 dS/cm (S1) and 7.5 dS/cm (S2) levels of the salinity compared to the control (S0). At S1 salinity the relative stem DW in Galarsum ranged from 46 to 66% and that at S2 salinity from 35 to 40%. Whereas, in Bangladesh Soybean-4 the stem DW ranged from 58 to 75% at S1 and that from 34 to 52% at S2 level of salinity. Therefore, the percent reduction in stem DW due to salinity was more in V2 than V1 when salinity increased from S1 to S2 under K0 and K1 potassium treatments. The percent reduction in stem DW due to salinity was more in V1 than V2 when salinity increased from S1 to S2 under K2 and K3 potassium treatments. Moreover, the positive effect of K on the production of relative stem DW under different level of salinity was cleare in V2 than that of V1. Irrespective of K levels salinity decreased the leaf dry weight in both the genotypes and the reduction in leaf DW increased with the increasing of salinity levels .The leaf DW of Galarsum (V1) were much higher than that of Bangladesh Soybean-4 at all level of salinity and potassium. At the control (S0) the increasing levels of K application decreased the leaf DW production in V1, though in V2 the weight increased substantially. Contrary, at both 5 dS/cm (S1) and 7.5 dS/cm (S2) K increased the leaf DW in both V1 and V2. The relative leaf DW production of V1 at S1 level ranged from 50-73% and that at S2 level from 35-43%. In V2 the relative leaf dry weight production increased with the increasing doses of K at both S1 and S2 levels of salinity. At the S1 salinity level the relative leaf dry weight ranged from 75-113% in V2 and that at S2 salinity level from 35 to 72%. The relative leaf DW of two soybean genotypes increased with increasing K application in each salinity level except S1K2, S2K3 treatments of V1. |
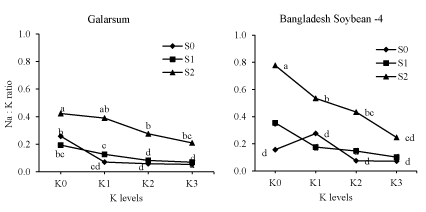
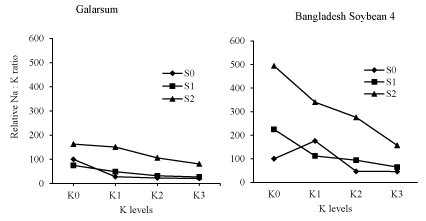
| Therefore, the relative leaf DW was increased due to increasing levels of K more in V2 than V1 under saline conditions. Salinity increased the Na: K ratio irrespective of K application in both the genotypes and the ratio increased with the increasing in the salinity levels (Figure 1). Application of K decreased the ratio substantially at all levels of salinity. The ratio decreased steadily with the increase in K levels. In general, the ratio was higher in Bangladesh Soybean-4 (V2) than V1. The relative value of the Na:K ratio increased noticeably with the increased in saliniy levels. In general, the relative value was higher in V2 than in V1. Increasing application of K doses decreased the ratio (Figure 2). In V1, at salinity S0 the Na:K ratios were 21% at K3 and 28% at K1 potassium level and at S1 level the ratios were 27% at K3 to 75% at K0, and at S3 level of salinity, these were 81% at K3 and 163% at K0. Similarly, in V2 at the S0 salinity level the Na:K ratio showed 46% at K3 and 176% at K1 potassium level, at S1 that ranged from 65% at K3 to 225% at K0, and at S2 salinity the ratio ranged from 157% at K3 to 494% at K0 potassium level (Table 2). |
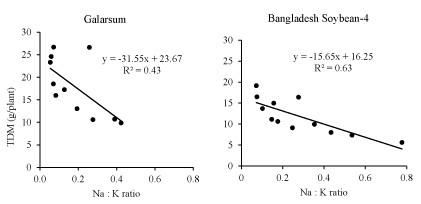
| Correlation between Na:K ratio and total dry weight is shown in. There was a negative and weakly significant relationship between Mg++ concentration in leaves and TDW in both V1 (r=-0.641 significant at 5% level) and V2 (r=-0.793, significant at 1% level) as presented. Between the two genotypes, V2 showed stronger negative relationship between Na:K ratio compared to V1 and total dry weight (y=-15.65x+16.25, R2=0.63) than Galarsum (y=-31.55x + 23.67, R2=0.43). The R2 value indicated that about 43% of the contribution to the TDW of V1 and 62% of V2 can be explained by the Na:K ratio. This equation also stated that TDW decreased with the increasing Mg++ concentration in leaves of two soybean genotypes (Figure 3). |
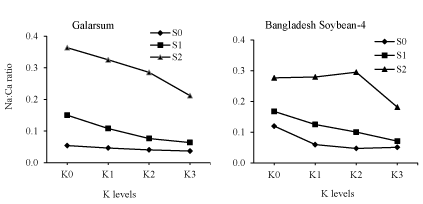
| The Na: Ca ratio increased by the salinity at all levels of K in both the genotypes and the ratio increased with the increasing in the salinity levels. Application of K decreased the ratio substantially at all levels of salinity. The ratio decreased steadily with the increase in K levels (Figure 4). |
| The relative value of the Na:Ca ratio increased noticeably with the increase in saliniy levels. At all the K and salonity levels the relative values were noticeably higher in V1 than in V2. Increasing application of K doses decreased the ratio at all level of salinity. In V1, at the S0 salinity the Na:Ca ratio ranged from 68% at K3 to 86% at K1 potassium level, at S1 the ratio ranged from 117% at K3 to 277% at K0, and at S3 salinity it ranged from 391% at K3 to 672% at K0. Similarly, in V2 at the S0 salinity level the Na:Ca ratio ranged from 42% at K3 to 50% at K1 potassium level, at S1 that ranged from 59% at K3 to 139% at K0, and at S2 salinity the ratio ranged from 151% at K3 to 203% at K0 potassium level. |
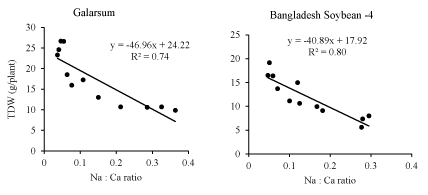
| Relationship between Na:Ca ratio and total dry weight is shown. There was a negative and strongly significant relationship between Na:Ca ratio in leaves and TDW in both V1 (r=-0.85, significant at 1%) and V2 (r=-0.89, significant at 1%) showed . Bangladesh Soybean-4 showed higher negative relationship (y=-40.89x+17.92, R2=0.80) than Galarsum (y=-46.96x+24.22, R2=0.74) between Na:Ca ratio and total dry weight. The R2 value indicates that about 73% of the contribution to the TDW of V1 and 80% of V2 can be explained by the Na:Ca ratio. This equation also stated that TDW decreased with increasing Na:Ca ratio concentration in leaves of two soybean genotypes (Figure 5). |
| Discussion |
| Application of K increased the dry matter production in different plant parts of the two soybean genotypes, especially under saline conditions. The higher the amount of K applied the greater was the production of dry matters. Potassium (K) is a vital element to many plant processes involving the basic biochemical and physiological systems of plants. While K does not become a part of the chemical structure of plants, it plays many important regulatory roles in plant physiological processes [10]. Moreover, K+ is the main cation in plant cell that plays an important role in maintaining cell osmotic potential [11]. When plants are K deficient, the rate of photosynthesis and adenosine triphosphate (ATP) production is reduced, and all the plant processes dependent on ATP are slowed down. Conversely, plant respiration increases which also response to slower growth and reduced shoot dry matter production. The activation of enzymes by K and its involvement in ATP production is probably more important in regulating the rate of photosynthesis. The absorption of K+ and Ca2+ is generally inhibited when the Na+ level is high under saline conditions, because the corresponding pathways |
| work as a Na+ transporter [12]. Therefore, the additional application of potassium could be helpful to reduce harmful effect of salinity in relation to dry matter production in different plant parts and as such K played an important role in improving salinity tolerance in soybean. Potassium also increased the concentrations of K and Ca and decreased the Mg++ concentration, and Na:K and Na:Ca ratio. Under saline conditions, the maintenance of low Na+/Ka+ ratio as as well as low Na+/Ca++ ratio is important mechanism of salt tolerance [13]. High salt stress increased the deposition rate of Na+ in the growing region of the roots and decreased the selectivity for K+. It is plausible that when additional K was applied, root growth of the soybean plants was maintained by plasma membrane selectivity of K+ over Na+. Thus, the rate of reaction in cell was increased by the rate at which K+ enters the cell. The accumulation of K+ in plant roots produced a gradient of osmotic pressure that draws water into the roots. The positive effects of K on dry matter production under saline conditions as found in this study was presumably due to lessening of osmotic and ionic effects on plant growth. |
| Acknowledgement |
| The author would like to express deepest and sincere gratitude to her Major Professor and Chairman of the advisory committee professor Dr. M. Abdul Karim, Department of Agronomy, Bangabandhu Sheikh Mujibur Rahman Agricultural University (BSMRAU), Bangladesh for his continued guidance, encouragement and suggestions in all phases of study, research and other activities as well as preparation of this paper. The author would like to extend heartiest gratitude to the respected Members of the Advisory Committee Prof. Dr. Md. Rafiqul Islam, Dr Md Ariful Islam, Department of Genetics and Plant Breeding for their inspiration and constructive guidance and finally thanks and gratitude to all the staffs of the Department of Agronomy, BSMRAU for their whole hearted cooperation during field and research works. |
References |
|
Tables and Figures at a glance
| Table 1 | Table 2 |
Figures at a glance
 |
 |
 |
 |
 |
| Figure 1 | Figure 2 | Figure 3 | Figure 4 | Figure 5 |
Relevant Topics
- Basmati Rice
- Drought Tolerence
- Golden Rice
- Leaf Diseases
- Long Grain Rice
- Par Boiled Rice
- Raw Rice
- Rice
- Rice and Aquaculture
- Rice and Nutrition
- Rice Blast
- Rice Bran
- Rice Diseases
- Rice Economics
- Rice Genome
- Rice husk
- Rice production
- Rice research
- Rice Yield
- Sticky Rice
- Stress Resistant Rice
- Unpolished Rice
- White Rice
Recommended Journals
Article Tools
Article Usage
- Total views: 16015
- [From(publication date):
October-2015 - Mar 29, 2025] - Breakdown by view type
- HTML page views : 11375
- PDF downloads : 4640
