Research Article Open Access
Effect of Motor Imagery After Motor Learning for 30 sec on Excitability of Spinal Neural Function and its Impact on Accurate Control of Muscle Force
Yuki Fukumoto1*, Yoshibumi Bunno1,2 and Toshiaki Suzuki1,21Graduate School of Health Sciences, Graduate School of Kansai University of Health Sciences
2Clinical Physical Therapy Laboratory Faculty of Health Sciences, Kansai University of Health Sciences
- *Corresponding Author:
- Dr. Yuki Fukumoto
Graduate School of Kansai University of Health Sciences 2-11-1 Wakaba
Sennangun Kumatori, Osaka, Japan
Tel: 072-453-8251
E-mail: fukumoto_3197@yahoo.co.jp
Received date: January 31, 2017; Accepted date: February 27, 2017; Published date: March 06, 2017
Citation: Fukumoto Y, Bunno Y, Suzuki T (2017) Effect of Motor Imagery After Motor Learning for 30 sec on Excitability of Spinal Neural Function and its Impact on Accurate Control of Muscle Force. J Nov Physiother 7:339. doi: 10.4172/2165-7025.1000339
Copyright: © 2017 Fukumoto Y, et al. This is an open-access article distributed under the terms of the Creative Commons Attribution License, which permits unrestricted use, distribution, and reproduction in any medium, provided the original author and source are credited.
Visit for more related articles at Journal of Novel Physiotherapies
Abstract
This study aimed to examine the effects of motor imagery on the excitability of spinal neural function and accurate control of muscle force. In total, 30 healthy volunteers (15 men and 15 women; mean age, 21.1 ± 1.2 years) participated in the study. The methodology involved recording F-waves under resting conditions with a touching sensor. Also, the subjects learned to maintain the 50% maximum voluntary contraction (MVC) value of the pinch by viewing a meter display for 30 sec. Next, the pinch force was measured for 10 sec without using visual feedback (1st trial of pinch task). Subsequently, the subjects engaged in motor imagery and the F-waves were recorded. Finally, the pinch force was measured again, as in 1st trial of the pinch task (2nd trial of pinch task). In the control group, the subjects did not use motor imagery on similar processes as in the motor imagery condition phase from different days. F-waves were analyzed with persistence. Correction time and the 50% MVC error were calculated from the pinch force. Persistence was more increased under motor imagery than in the resting and touching sensor. In addition, no significant differences were observed in correction time and the 50% MVC error in the motor imagery group. But in the control group, correction time was decreased and the 50% MVC error was increased in the 2nd trial of pinch task as compared to the 1st trial. In conclusion, motor imagery after motor learning for 30 sec increased spinal neural excitability function. Moreover, motor imagery might allow accurate control and maintenance of muscle force.
Keywords
F-waves; Motor imagery; Accurate control of muscle force
Introduction
Motor imagery is reproduced from working memory [1]. Motor imagery may become a therapeutic approach for patients with restrictions or contraindications in physical activity. Effect of motor imagery on the nervous system is as follows. It activates primary motor area, supplementary motor area, premotor area, cerebellum and so forth during motor imagery [2-4]. Accordingly, the result is to fix. On the other hand, the spinal neural function was studied by using F-waves and H- reflex. An F-wave is a compound action potential obtained as a result of re-excitation (“backfiring”) of an antidromic impulse following distal electrical stimulation of motor nerve fibers at the anterior horn cells [5]. H-reflex is the result of sub-maximal stimulation of type Ia sensory fibers. The action potential enters the posterior horn of the spinal cord and passes through the synapses with alpha-motor neurons. Finally, a compound muscle action potential is generated and is recorded as H waves [6]. F-waves and H-reflexes are generally used as an index of spinal neural function. Suzuki et al. [7] reported that the persistence and F/M amplitude ratio during motor imagery at 50% MVC pinch action were significantly more increased than those at rest. Taniguchi et al. [8] reported that the persistence and F/M amplitude ratio were significantly decreased after a sustained rest for three hours as compared to the pre-resting condition. But, the persistence and F/M amplitude ratio were maintained between after the sustained rest and pre-resting conditions (when rest and motor imagery were combined). Kasai et al. [9] reported that no significant differences were observed in the H-reflex amplitude between the resting condition and motor imagery involving flexion-extension movements at wrist joint. Also, Oishi et al. [10] reported that the H-reflex amplitude was significantly decreased in the motor imagery condition of skating than in the resting condition at a speed skater. Accordingly, the excitability of spinal neural function may not always increase during motor imagery. Therefore, it is uncertain as to whether motor imagery facilitated the spinal neural function or not. One of roles Physical therapy is improvement for the abnormal movement with normative muscle contraction. And, it is necessary to enhance the excitability of spinal neural function as well as to activate the central nervous system in order to muscle contraction. Consequently, we must make a check on the effect of motor imagery for the excitability of spinal neural function so as to adapt for the rehabilitation.
The next, effect of motor imagery on actual motion is as follows. Yue et al. [11] reported a comparison of muscular strength after motor imagery of the little finger at MVC abduction movement for 4 weeks among motor imagery, physical training, and control groups. Also, the motor imagery group was doing motor imagery, the physical training group was doing actual motion, and the control group was doing nothing. Accordingly, muscular strength was reinforced at 30% in the strength-training group and at 22% in the motor imagery group. Page et al. [12] reported that upper limb motor function was improved using a combination of physical therapy and motor imagery in poststroke hemiparesis patients. In addition, Guillot et al. [13] reported flexibility of hamstrings and the muscle controlling the ankle joint to be significantly improved in the post-motor imagery condition of stretching as compared to the premotor imagery condition in swimmer. Moreover, Dickstein et al. [14] reported gait speed to be improved using motor imagery in hemiparesis patients with Cardio Vascular Disease. Thus, motor imagery may improve muscle strength, motor function, muscle ductility, gait speed, and so forth. But, it is unclear how the effect of motor imagery accurately controls muscle force. Our daily activities of using a tool or object involve the upper limb. Therefore, the acquisition of accurate control of muscle force is important. In our previous study [15], we examined the effect of motor imagery after motor learning for 10 sec on excitability of spinal neural function using F-waves and accurate control of muscle force. Consequently, the excitability of spinal neural function was increased during motor imagery than those at rest. But, motor imagery did not improve accurate control of muscle force. The cause for motor learning time was imperfection of learning that corresponded to the motor imagery task. We thought of extending motor learning time. In this study, we studied the effect of motor imagery after motor learning for 30 sec on the excitability of spinal neural function using F-waves and accurate control of muscle force.
Materials and Methods
Participants
We included 30 healthy subjects (males 15; females 15; mean age 21.1 ± 1.2 years) in this study. In addition, all subjects provided informed consent prior to study commencement. The experiments were conducted in accordance with the Declaration of Helsinki. This study was approved by the Research Ethics Committee at Kansai University of Health Sciences (Approval number: 16-25).
Method
This study is cohort study. And, we got doing motor imagery (motor imagery group) and not doing motor imagery (control group) by the same subjects. These tasks were performed randomly in the motor imagery and control groups.
The outline of the study process is as follows. In resting condition, touching sensor condition, and MI condition, we recorded F-waves from muscles of their thenar eminence. We also measured the pinch force before and after MI. For more details, refer to the following.
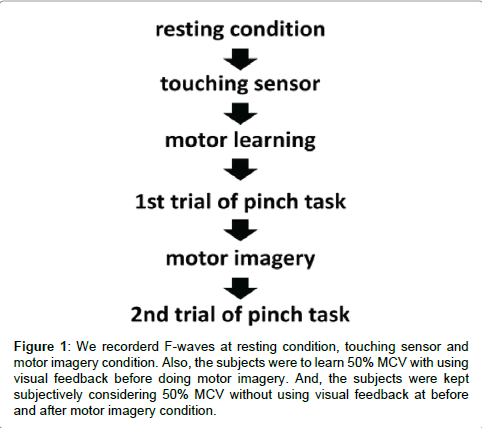
The subjects were comfortably placed in the supine position. We recorded F-waves of the left thenar muscle and used the spinal neural function under the resting condition. Additionally, we recorded F-waves while the subjects were simply touching the pinch meter sensor [Digital indicator F340A (Unipulse Inc.)] between the thumb and index finger (touching sensor condition). In advance, we determined the magnitude of MVC in the subjects exerting maximum effort for 10 sec. The subjects were then required to learn 50% MVC beforehand with isometric contraction for the pinch action with 30 sec. At this time, the subjects were instructed to maintain the 50% MVC while looking at the pinch meter display. Subsequently, the subjects were maintained to subjectively determine 50% MVC without using visual feedback before motor imagery, and, we measured the pinch force for 10 sec (1st trial of pinch task). Next, we recorded F-waves while the subjects doing motor imagery combination of touching the pinch meter sensor for 1 min (motor imagery condition). And, we confirmed that the subjects were exactly doing motor imagery for 1 min by word of mouth. Finally, the subjects were maintained to subjectively determine 50% MVC without using visual feedback after motor imagery (2nd trial of pinch task). In the control group, F-waves were recorded while not using motor imagery in similar processes as at the motor imagery condition phase (without motor imagery condition) on a different day (Figure 1).
Figure 1: We recorderd F-waves at resting condition, touching sensor and motor imagery condition. Also, the subjects were to learn 50% MCV with using visual feedback before doing motor imagery. And, the subjects were kept subjectively considering 50% MCV without using visual feedback at before and after motor imagery condition.
The testing conditions for measurement of F-waves were as follows: A Viking Quest Electromyography machine (Natus Medical Inc.) was used to record F-waves. We recorded the F-waves by stimulating the left median nerve at the wrist. Supramaximal shocks (adjusted up to the value 20% higher than the maximal stimulus) were delivered at 0.5 Hz and 0.2 ms for F-waves acquisition. We recorded F-waves of the left thenar muscles using a pair of disks attached with collodion to the skin over the belly of the thumb and the bones of the metacarpophalangeal joint of the thumb. The stimulating electrodes were comprised of a cathode placed over the left median nerve 3 cm proximal to the palmar crease of the wrist joint, and an anode placed 2 cm more proximally.
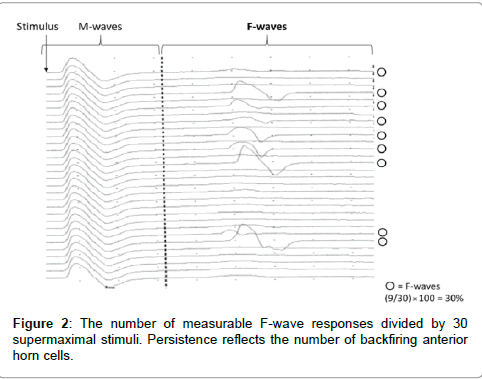
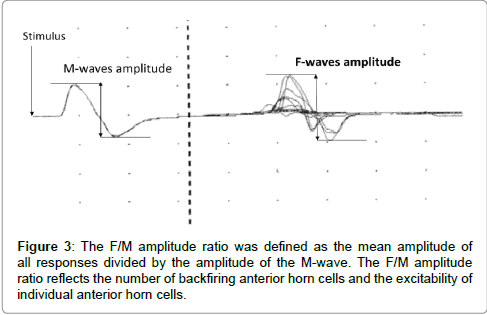
F-waves were analyzed with respect to persistence and the F/M amplitude ratio using 30 stimuli. Persistence was defined as the number of measurable F-wave responses divided by 30 supermaximal stimuli. Persistence reflects the number of backfiring anterior horn cells (Figure 2). The F/M amplitude ratio was defined as the mean amplitude of all responses divided by the amplitude of the M-wave. The F/M amplitude ratio reflects the number of backfiring anterior horn cells, and the excitability of individual anterior horn cells (Figure 3). Therefore, persistence and the F/M amplitude ratio are regarded as indices of the excitability of spinal motor neurons. Also, Suzuki et al. [7] reported that motor imagery is not simply doing something, but a combination with keeping positional motion. Accordingly, we recorded F-waves while the subjects were not only simply touching the pinch meter sensor between the thumb and index finger but also doing a combination of touching the pinch meter sensor and performing motor imagery for 1 min. In this study, provided that the excitability of spinal neural function in the motor imagery condition is more than that in the touching sensor condition, it may be improved by subjects performing motor imagery. Furthermore, we confirmed that no significant differences were observed in relative electromyogram integral value between the resting and touching sensor condition versus motor imagery condition when using surface electromyography.
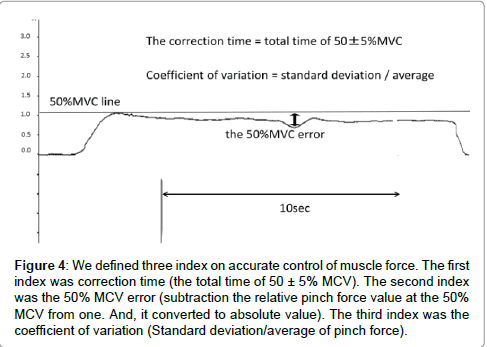
The index on accurate control of muscle force was as follows: In this study, we defined three indexes representing the accurate control of muscle force (Figure 4). Because, the index representing the accurate control of muscle force was not defined in past literature, the first index was correction time, which was the total time of 50 ± 5% MVC. Correction time reflects the ability to control accurate muscle force in the pinch action. Blefari et al. [16] adopted an error range of ± 5% as the index on accurate control of muscle force. Based on the aforementioned considerations, we adopted an error range of ± 5%. We did this because our study and Blefari’s study were similar in terms of adopting pinch action. The second index was the 50% MVC error, obtained by subtraction of the relative pinch force value at the 50% MVC from one. In addition, this index was converted to an absolute value, and expressed as a percentage. The 50% MVC error reflects whether or not there is convergence on 50% MVC. The third index was the coefficient of variation, which was division a standard deviation of pinch force from an average of pinch force value. The coefficient of variation reflects the shaped width on the pinch force. The correction time, the 50% MVC error and coefficient of variation were calculated for the 1st and 2nd trials of pinch task for motor imagery and control groups. We measured the pinch force value using electromyogram recording software, Vital Recorder2 (KISSEI COMTEC). We calculated three indexes reflecting accurate control of muscle force using a versatile biological analysis system, BIMUTAS-Video (KISSEI COMTEC). Provided that the index reflecting the accurate control of muscle force in the 2nd trial of pinch task is significantly improved more than in the 1st trial of pinch task, the effect of motor imagery should be confirmed.
Figure 4: We defined three index on accurate control of muscle force. The first index was correction time (the total time of 50 ± 5% MCV). The second index was the 50% MCV error (subtraction the relative pinch force value at the 50% MCV from one. And, it converted to absolute value). The third index was the coefficient of variation (Standard deviation/average of pinch force).
Data Analysis
Statistical analysis for normal distribution was performed using the Kolmogorov-Smirnov and Shapiro-Wilk tests. Because the data were not recognized as showing normal distribution, the Friedman test was used to compare F-wave results among resting condition, touching sensor condition, motor imagery condition or without motor imagery conditions. Thereafter, the Scheffe test was used to compare F-wave results across all conditions. Also, the Wilcoxon signed-rank test was used to compare correction time, the 50% MVC error and coefficient of variation between 1st trial of pinch task and task 2nd trial. The significance level was set at p<0.05. We used SPSS ver. 19 for statistical analyses.
Result
F-wave results
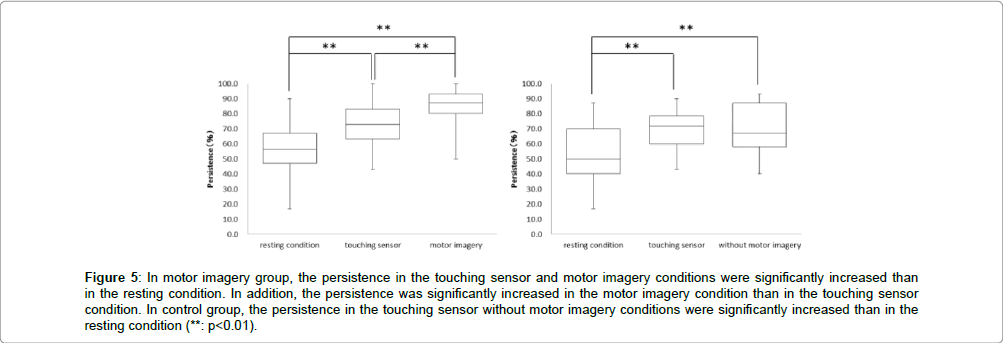
In the motor imagery group at persistence, the resting condition was 55.6 ± 17.2%, touching sensor condition was 72.8 ± 14.3% and motor imagery condition was 84.5 ± 12.8%. The persistence in the touching sensor and motor imagery conditions were significantly more increased than in the resting condition. In addition, the persistence was significantly more increased in the motor imagery condition than in the holding sensor condition (** : p<0.01, Figure 5). Accordingly, in the control group at persistence, the resting condition was 53.3 ± 18.7%, touching sensor condition was 69.7 ± 13.2% and without motor imagery condition was 70.6 ± 15.5%. The persistence in the touching sensor and without motor imagery conditions were significantly more increased than in the resting condition. But, no significant differences in the persistence was observed between the touching sensor and without motor imagery conditions (** : p<0.01, Figure 5).
Figure 5: In motor imagery group, the persistence in the touching sensor and motor imagery conditions were significantly increased than in the resting condition. In addition, the persistence was significantly increased in the motor imagery condition than in the touching sensor condition. In control group, the persistence in the touching sensor without motor imagery conditions were significantly increased than in the resting condition (**: p<0.01).
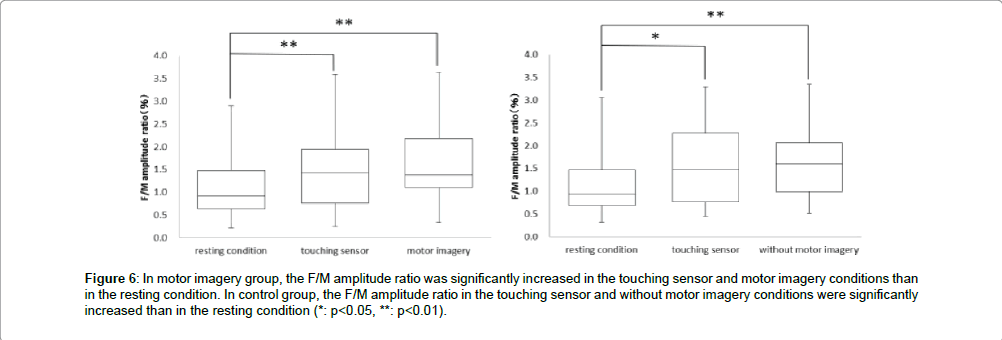
Next, in the motor imagery group at the F/M amplitude ratio, the resting condition was 1.1 ± 0.7%, touching sensor condition was 1.5 ± 0.8% and motor imagery condition was 1.7 ± 0.8%. The F/M amplitude ratio was significantly more increased in the touching sensor and motor imagery conditions than in the resting condition. But, no significant differences in the F/M amplitude ratio was observed between the touching sensor and motor imagery conditions (** : p<0.01, Figure 6). Accordingly, in the control group at the F/M amplitude ratio, the resting condition was 1.2 ± 0.7%, touching sensor condition was 1.5 ± 0.9%, and without motor imagery condition was 1.6 ± 0.8%. The F/M amplitude ratio in the touching sensor and without motor imagery conditions were significantly more increased than in the resting condition. But, no significant differences in the F/M amplitude ratio were observed between the touching sensor and without motor imagery conditions (* : p<0.05,** : p<0.01, Figure 6).
Figure 6: In motor imagery group, the F/M amplitude ratio was significantly increased in the touching sensor and motor imagery conditions than in the resting condition. In control group, the F/M amplitude ratio in the touching sensor and without motor imagery conditions were significantly increased than in the resting condition (*: p<0.05, **: p<0.01).
The index on accurate control of muscle force results
In the motor imagery group at the correction time, 1st trial of pinch task was 1.7 ± 2.0 sec, and 2nd trial of pinch task was 1.7 ± 1.8 sec. No significant differences were observed in the correction time between 1st trial and 2nd trial of pinch task (Figure 7). Accordingly, in the control group at the correction time, 1st trial of pinch task was 1.6 ± 1.7 sec and 2nd trial of pinch task was 1.0 ± 1.3 sec. The correction time was significantly more decreased in the 2nd trial of pinch task than the 1st trial (* : p<0.05, Figure 7).
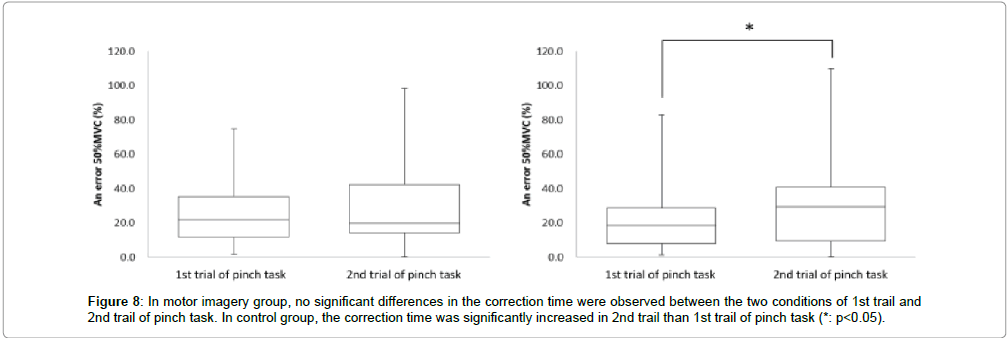
Next, in the motor imagery group at the 50% MVC error, the 1st trial of pinch task was 25.2 ± 18.9% and 2nd trial of pinch task was 30.7 ± 25.2%. No significant differences were observed in the 50% MVC error between 1st trial and 2nd trial of pinch task (Figure 8). Accordingly, in the control group at the 50% MVC error, 1st trial of pinch task was 21.3 ± 18.0%, and 2nd trial of pinch task was 30.0 ± 26.6%. The 50% MVC error was significantly more increased in the 2nd trial of pinch task than 1st trial (* : p<0.05, Figure 8).
Next, in the motor imagery group at coefficient of variation, the 1st trial of pinch task was 0.1 ± 0.0, and 2nd trial of pinch task was 0.1 ± 0.0. No significant differences were observed in the coefficient of variation between the 1st trial and 2nd trial of pinch task (Figure 9). Accordingly, in the control group at coefficient of variation, 1st trial of pinch task was 0.1 ± 0.0, and 2nd trial of pinch task was 0.1 ± 0.0. No significant differences were observed in the coefficient of variation between the 1st trial and 2nd trial of pinch task (Figure 9).
Discussion
The persistence in the motor imagery conditions was significantly more increased than in the resting and touching sensor conditions. But, the persistence in the without motor imagery conditions was not significant different than in the resting and touching sensor conditions.
Next, no significant differences were observed in all indexes on accurate control of muscle force between 1st and 2nd trial of pinch task in the motor imagery group. But in the control group, correction time was significantly more decreased in the 2nd than the 1st trial of pinch tasks, and the 50% MVC error was significantly more increased in the 2nd than the 1st trial of pinch tasks. Also, no significant differences were observed in the coefficient of variation between the 1st and 2nd trial of pinch tasks.
The factor of an increase in the excitability of spinal neural function during motor imagery
The excitability of spinal neural functions under motor imagery conditions was more increased than that of spinal neural function at rest and in the touching sensor conditions. Suzuki et al. [7] reported that the excitability of spinal neural function in the motor imagery condition was influenced by the descending pathways from the cerebral cortex, and that this it was due to activation of primary motor area, supplementary motor area, premotor area, cerebellum and other structure during motor imagery [2-4]. From the above, we thought that the activation of the cerebral cortex in the motor imagery condition presumably might increase the excitability of spinal neural function via the corticospinal pathway and extrapyramidal tract. Also, Mizuguchi et al. [17,18] reported that the responsiveness of afferent pathways to the primary somatosensory area during motor imagery while utilizing an object was modulated by a combination of tactile and proprioceptive inputs, while touching the object. Tactile and proprioceptive inputs from the periphery are integrated after they are hierarchically processed and then projected to the primary motor area. Besides, Suzuki et al. [7] reported that the excitability of spinal neural function at motor imagery under the “with sensor” condition was higher than that of the spinal neural function at motor imagery under the “without sensor” condition. Consequently, it is considered that tactile and proprioceptive inputs while touching the pinch meter sensor may increase the excitability of spinal motor neurons as part of the synergistic effect. From the above, we considered that the excitability of spinal neural function in the motor imagery conditions was significantly more increased than in the other conditions on account of performing some sort of motor imagery.
The effect of motor imagery on accurate control of muscle force
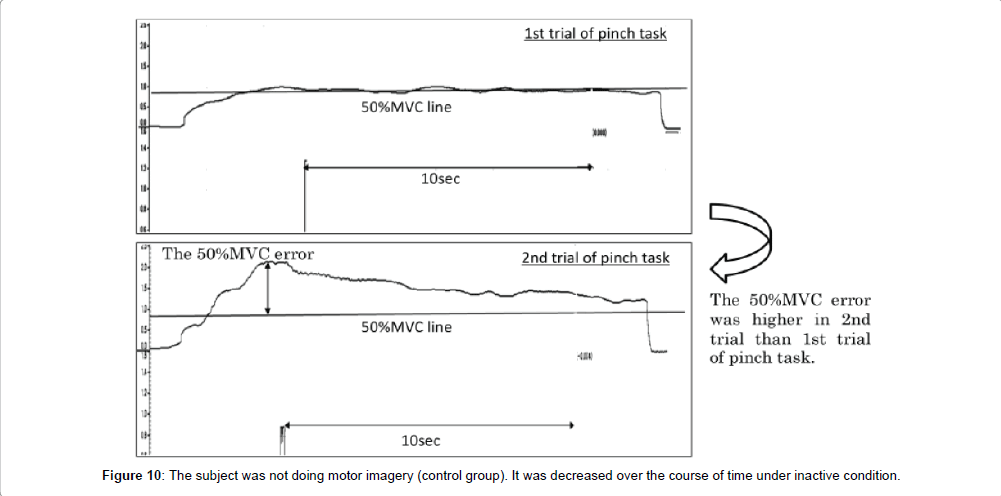
The correction time reflects the ability to control accurate muscle force in pinch action. If the correction time is increased after motor imagery, the index on accurate control of muscle force would be improved in the 2nd trial of pinch task as compared to the 1st trial of pinch task. Conversely, the correction time should be decreased if there is no improvement in the accurate control of muscle force. In the motor imagery group, no significant differences were observed in the correction time between 1st and 2nd trial of pinch task. But, in the control group, the correction time was significantly more decreased in 2nd trial of pinch tasks than the 1st. These results were suggestion that the accurate control of muscle force was decreased in the control group. Ronsse et al. [19] reported that the effectiveness of motor learning with the use of visual feedback was decreased over the course of time with periodic flexion and extension at both wrist joint. Ohashi et al. [20] reported that the information pertaining to the intensity of force in an isometric contraction task was decreased over the course of time. In this study, the subjects carried out motor learning with isometric contraction and using visual feedback. Accordingly, if the accurate control of muscle force was acquired with motor learning for 30 sec, it was decreased over the course of time under inactive condition. On the other hand, accurate control of muscle force was not decreased between the 1st and 2nd trials of pinch tasks when performing motor imagery. In our previous study [15], motor imagery after motor learning for 10 sec could not maintain accurate control of muscle force. In addition, Mulder et al. [21] reported that motor imagery improved the ability to achieve actual motion only in people with learning that corresponded to the motor imagery task. Therefore, the accurate control of muscle force might be maintained by motor imagery after motor learning with relevant time. In detail, it was suggested that motor learning time was not enough at 10 sec, but was enough 30 sec. Next, in the motor imagery group, no significant differences were observed in the 50% MVC error between the 1st and 2nd trials of pinch task. But, in the control group, the 50% MVC error was significantly more increased in the 2nd trial of pinch task than the 1st trial (Figure 10). Provided the pinch value is convergence on 50% MVC, the 50% MVC error would be more decreased in the 2nd trial of pinch task than the 1st trial. Conversely, provided the exhibition pinch value is not convergence on 50% MVC, the 50% MVC error would be more increased in the 2nd trial of pinch task than 1st trial. Consequently, the accurate control of muscle force was maintained only in the motor imagery group, and these results are consistent with those for the correction time. We thought that motor imagery adjusted the variety and total number of mobilized motor unit (recruitment), firing rate of motor unit (rate coding), congruence of activity-timing of each motor unit (synchronization) and the revision of motor program. It has been suggested that the accurate control of muscle force is maintained by performing motor imagery after motor learning for 30 sec. Next, no significant differences were observed in coefficient of variation between 1st trial and 2nd trial of pinch task from motor the imagery and without motor imagery groups. In this study, the coefficient of variation reflects the shaped width on the pinch force. Provided the motor imagery was a change in the ability to make an adjustment of pinch force, coefficient of variation was different between several pinch tasks. But, all subjects did pinch actions aimed at achieving a constant value both before and after motor imagery. Therefore, it was suggested that the motor imagery did not change the ability to make an adjustment of pinch force. From the above, this study’s results suggest that the good motor imagery after motor learning for 30 sec or more involved accurate control of muscle force.
In future studies, it is necessary the extension to motor learning time occur before motor imagery. Then, we should be able to study the effectiveness of motor imagery on accurate control of muscle force. Also, it is important that the motor leaning method, a motor learning time should be 30 sec or more. Salmoni . [22] reports that motor learning may be impeded by excessive feedback information. In this study, the subjects did motor learning with continuous visual feedback. Winstein . [23] proposed that the learner should be gradually be given decreased feedback. Also, Lavery . [24] proposed that the learner should be combined with some feedback. Additionally, Sherwood et al. [25] proposed that the learner should know when deviations from the constant bandwidth occur. Schmidt et al. [26] reported that the learner were attentive to internal information by these investigator’s method in motor learning. Then, we should study the effectiveness of motor imagery on accurate control of muscle force.
The application of this study to physical therapy is as follows: Accurate control of muscle forces are important in daily activities such as doing and undo buttons, using chopsticks, grasping a coin and so forth. Therefore, accurate control of muscle force is improved by doing motion practices. But, motion practice is difficult in a patient without voluntary movements. However, a patient with impossible voluntary movements can do motor imagery to depend on recognition of their self. This study’s results therefore suggest that motor imagery is good for accurate control of muscle force. Accordingly, we thought that the combination of motion practices and motor imagery could be one of the therapeutic approaches for patients.
Conclusion
Motor imagery after motor learning for 30 sec increased spinal neural excitability function. Moreover, motor imagery might allow accurate control and maintenance of muscle force for the pinch action. The limitations of this study, it is indistinct that the disparate motor task or strength contraction has an effect on motor imagery in the same this study. In future studies, it is necessary the extension to motor learning time and change the motor leaning method occur before motor imagery.
Acknowledgments
None declared.
References
- Luft AR, Skalej M, Stefanou A, Klose U, Voigt K (1998) Comparing motion- and imagery-related activation in the human cerebellum: a functional MRI study. Hum Brain Mapp 6: 105-113.
- Lotze M, Montoya P, Erb M, Hülsmann E, Flor H, et al. (1999) Activation of cortical and cerebellar motor areas during executed and imagined hand movements: an fMRI study. J CognNeurosci 11: 491-501.
- Stephan KM, Fink GR, Passingham RE, Silbersweig D, Ceballos-Baumann AO, et al. (1995) Functional anatomy of the mental representation of upper extremity movements in healthy subjects. J Neurophysiol 73: 373-386.
- Mesrati F, Vecchierini MF (2004) F-waves: neurophysiology and clinical value. NeurophysiolClin 34: 217-243.
- Palmieri RM, Ingersoll CD, Hoffman MA (2004) The Hoffmann reflex: methodologic considerations and applications for use in sports medicine and athletic training research. J Athl Train 39: 268-277.
- Suzuki T, Bunno Y, Onigata C, Tani M, Uragami S (2014) Excitability of spinal neural function by motor imagery with isometric opponenspollicis activity: Influence of vision during motor imagery. Neuro Rehabilitation 34: 725-729.
- Taniguchi S, Kimura J, Yamada T, Ichikawa H, Hara M, et al. (2008) Effect of motion imagery to counter rest-induced suppression of F-wave as a measure of anterior horn cell excitability. ClinNeurophysiol 119: 1346-1352.
- Kasai T, Kawai S, Kawanishi M, Yahagi S (1997) Evidence for facilitation of motor evoked potentials (MEPs) induced by motor imagery. Brain Res 744: 147-150.
- Oishi K, Kimura M, Yasukawa M, Yoneda T, Maeshima T (1994) Amplitude reduction of H-reflex during mental movement simulation in elite athletes. Behavioural Brain Research 62: 55-61.
- Yue G, Cole KJ (1992) Strength increases from the motor program: comparison of training with maximal voluntary and imagined muscle contractions. J Neurophysiol 67: 1114-1123.
- Page SJ, Levine P, Sisto SA, Johnston MV (2001) Mental practice combined with physical practice for upper-limb motor deficit in subacute stroke. J PhysTher 81: 1455-1462.
- Guillot A, Tolleron C, Collet C (2010) Does motor imagery enhance stretching and flexibility? J Sports Sci 28: 291-298.
- Dickstein R, Dunsky A, Marcovitz E (2004) Motor imagery for gait rehabilitation in post-stroke hemiparesis. PhysTher 84: 1167-1177.
- Fukumoto Y, Bunno Y, Suzuki T (2016) Effect of motor imagery on excitability of spinal neural function and its impact on the accuracy of movement-considering the point at which subjects subjectively determine the 50%MVC point. J PhysTherSci 28: 3416-3420.
- Blefari ML, Sulzer J, Hepp-Reymond MC, Kollias S, Gassert R (2015) Improvement in precision grip force control with self-modulation of primary motor cortex during motor imagery. Front BehavNeurosci 18.
- Mizuguchi N, Sakamoto M, Muraoka T, Kanosue K (2009) Influence of touching an object on corticospinal excitability during motor imagery. Exp Brain Res 196: 529-535.
- Mizuguchi N, Sakamoto M, Muraoka T, Nakagawa K, Kanazawa S, et al. (2011) The modulation of corticospinal excitability during motor imagery of actions with objects. PLoS One 6: e26006.
- Ronsse R, Puttemans V, Coxon JP, Goble DJ, Wagemans J, et al. (2010) Motor learning with augmented feedback: modality-dependent behavioral and neural consequences. Cereb Cortex 21: 1283-1294.
- Ohashi Y (2004) A study for retention characteristics of isometric force information. J JpnPhysTherAssoc 20: 355-359.
- Mulder T, Zijlstra S, Zijlstra W, Hochstenbach J (2004) The role of motor imagery in learning a totally novel movement. Exp Brain Res 154: 211-217.
- Salmoni AW, Schmidt RA, Walter CB (1984) Knowledge of results and motor learning: a review and critical reappraisal. Psychol Bull 95: 355-386.
- Winstein C, Schmidt RA (1990) Reduced frequency of knowledge of results enhances motor skill learning. J ExpPsychol-Learn MemCogn 16: 677-691.
- Lavery JJ (1962) Retention of simple motor skills as a function of type of knowledge of results. J Psychol 16: 300-311.
- Sherwood DE (1988) Effect of bandwidth knowledge of results on movement consistency. Percept Mot Skills 66: 535-542.
- Schmidt RA (1975) A Schema theory of discrete motor skill learning. Psychol Rev 82(4): 225-260.
Relevant Topics
- Electrical stimulation
- High Intensity Exercise
- Muscle Movements
- Musculoskeletal Physical Therapy
- Musculoskeletal Physiotherapy
- Neurophysiotherapy
- Neuroplasticity
- Neuropsychiatric drugs
- Physical Activity
- Physical Fitness
- Physical Medicine
- Physical Therapy
- Precision Rehabilitation
- Scapular Mobilization
- Sleep Disorders
- Sports and Physical Activity
- Sports Physical Therapy
Recommended Journals
Article Tools
Article Usage
- Total views: 3756
- [From(publication date):
April-2017 - Apr 02, 2025] - Breakdown by view type
- HTML page views : 2921
- PDF downloads : 835
