Effect of Maize Silage on Feedlot Performance, Carcass Traits and Meat Quality of Ethiopian Cattle
Received: 29-May-2023 / Manuscript No. JFLP-23-100611 / Editor assigned: 01-Jun-2023 / PreQC No. JFLP-23-100611(PQ) / Reviewed: 17-Jun-2023 / QC No. JFLP-23-100611 / Revised: 24-Jun-2023 / Manuscript No. JFLP-23-100611(R) / Accepted Date: 26-Jun-2023 / Published Date: 03-Jul-2023 DOI: 10.4172/2332-2608.1000440
Abstract
The experiment was conducted at Haramaya University Beef fattening station, to evaluate the effect of maize silage inclusion at different levels on feed intake, growth performance, carcass characteristics, and meat quality. Sixteen castrated Harar oxen of average age 6 years with the initial body weight of 229±1.18 kg (mean + SE) were used for the experiment. The animals were randomly distributed to four treatments each with four replications in a completely randomized design and the trial lasted for 90 days. The dietary treatments contained the native hay as basal diet and maize silage inclusion at a proportion of 0, 33, 67, and 100% for T1, T2, T3, and T4, respectively. The animals were watered and supplemented with a concentrate ration at 1.25% of their body weight twice a day. Daily dry matter intake of the ox was significantly higher (P<0.01) for T4 (8.05kg/day). Higher (P<0.001) total nutrients intake other than acid detergent fiber (ADF) and ash were recorded in the T4. The daily body gain was higher (P<0.01) for T1 (1.09 kg) than all. The dressing percentage on a slaughter basis was higher (P<0.001) for T1 (55.40%) than other treatments. The quality of beef based on Warner-Bratzler Shear Force test results, T1 and T4, T2, and T3 were categorized as tough, tender, and intermediate, respectively. Water holding capacity was significantly good (P<0.05) for T2 and T3 as compared to T1 and T4, however, no change in the pHu. Therefore, it could be concluded that the inclusion of maize silage up to 33% could be confirmed for better performance, feed conversion efficiency, carcass and meat quality parameters in the feeding of fattening oxen.
Keywords
Body weight gain; Carcass traits; Harar cattle; Maize silage; Meat quality
Introduction
Silage and haymaking are means of conserving forage for times of the year when forage growth is less than requirements and also an excellent method of preserving forage when it is produced in excess [1]. Although ensiling has had advantages over haymaking even in good drying situations as the preferred mode of conservation of green forages, haymaking is still a more common process. Ensiling is the name given to the well-established means of the conservation process of fodder in anaerobic conditions, and the container used is called silo. Silage is the fodder material preserved by lactic acid that is produced by the fermentation of sugars in the forage of high moisture content. It is less weather dependent and is better suited to a large-scale, mechanized production system. Almost any crop fodder can be preserved as silage, but the commonest are grasses, legumes, and whole cereals, especially maize, wheat, sorghum, oats, millet, and rice [2].
Among silage sources, maize silage (Zea mays L.) has been a growing interest because of its consistent source of palatable and high-energy forage for all classes of ruminants, including dairy cattle, beef cattle, sheep, and goats. It is considered a good roughage source for the finishing phase of fattening bulls [3] The use of maize silage (MS) in beef fin¬ishing diets has been economical in times of highpriced maize grain, it is easy to handle, and highly palatable to cattle. Moreover, the nutritional quality of MS is more stable than pasture, the quality of which varies consistently with the change of seasons.
The progressive substitution of grass silage with MS has the potential to reduce the days on feed to finish beef cattle. Furthermore, the inclusion of increasing amounts of MS in the diet of beef cattle may result in altered beef properties. Even though MS has been used for many years in cattle finishing diets, the uses of MS at different levels for fattening purposes of indigenous Ethiopian cattle have been not researched. Moreover, many studies have shown that the meat quality can be altered by a lot of production methods on the farm and a wide range of factors beyond the farm gate: from those feeds, breed, age, and sex are major factors [4]. Hence, there was limited information on assessing the use of MS for fattening purposes and its effects on carcass characteristics and meat quality.
The objective of this study was, therefore, to determine the effect of feeding different levels of maize silage on Harar cattle fattening performances, carcass traits, and meat quality.
Materials and Methods
Description of the study area
The study was conducted at Haramaya University beef fattening station. It is located at 510 km east of Addis Ababa at 9o26’ north of latitude and 42o3’ east of longitude, and at an altitude of 1980 meter above sea level and receives 780 mm mean annual rainfall. The mean annual minimum and maximum temperatures are 8.5and 24.4oC, respectively [5].
Experimental animals and their management
The experiment was conducted on oxen supplied by Union’s to Haramaya University for meat purposes. Among purchased cattle, a total of 16 oxen from the Harar cattle breed were purposefully selected based on their similar age of 6 years and live body weight of 229±1.18 kg (Mean+SE)for the feedlot trial. The ages of the oxen were determined based on the dentition methods according to the Verification Guidelines of Mississippi State University [6]. The animals were examined by experienced farmworkers for the oxen which had replaced and fully developed four pairs of incisors (permanent teeth) and started wearing pinchers (first or central pair) were used for the study. Following the quarantine period of 14 days, the animals were treated against external parasites using H-Ivermectin 1% injection and internal parasites with broad-spectrum anti-helminthicbolus. Before the commencement of the experiment, the animals were acclimated for 14 days to the test feed. There were ear-tagged with plastic identification (ID) numbers and randomly by drawing lots grouped into four and fed individually. Feeding and watering were done using concrete troughs and metal containers, respectively. Animals were provided water and the respective roughages (hay and/or maize silage) separately ad libitum for the entire period by allowing 15% of refusal from the previous day’s intake. The feedlot study was conducted for 90 days.
Experimental feed, design, and treatments
The maize silage that was prepared at Haramaya University dairy farm for dairy cattle was used for the feeding trial. Grass hay harvested from the University campus primarily consisted of native grass and available at the farm was used. Concentrate ration was prepared from maize, soybean meal, wheat bran, nougseed cake meal, salt, and ruminant premix. The concentrate ration was provided to animals in all treatments at 1.25% of their initial live body weight. It was balanced to a 16% CP level of DM to meet the nutrient requirements following a recommendation made by the National Research Council [7] for beef cattle (using Feed win software). Daily allocated dietary feed was divided into two equal amounts and offered to respective animals twice a day at 8:00 AM and 5:00 PM.
A completely randomized design (CRD) involving four dietary treatments, each with three replications were used. The treatment was randomly assigned to one of the experimental groups by drawing lots. Besides, the animals were randomly allocated to four groups. After randomization, there was no difference in mean initial body weight among oxen assigned to the different treatments. The MS was used at 0, 33, 67, and 100% of roughages in treatments 1, 2, 3, and 4, respectively.
Data collection and measurements
Feed intake: A weighed amount of feed was offered twice a day and the refusal was collected, weighed, and recorded every day to determine the amount of feed consumed as a difference between the feed offered and refused. The leftover was collected daily in the early morning at 7:00 AM Representative samples of diets refused per treatment feeds were collected daily over the experimental days and stored in coded plastic bags pending chemical analysis. The dry matter intake (DMI) was computed by multiplying the actual feed intake by the percent of DM content of the feed and the daily DMI was employed by the following formula [1]:
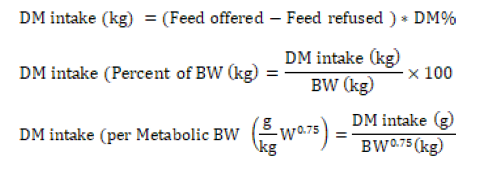
Body weight gain: Body-weight was taken monthly at 7:00 AM after overnight fasting using the fixed ground scale (FGS) (weighing scale 1500 TassinnariBilance 44042 Cento Italy). Before and after each measurement the scale was cleaned and calibrated. Average daily gain (ADG) was determined by dividing the weight between two consecutive measurements to experimental days as follows:

Feed conversion ratio: Feed conversion ratio (FCR) was calculated using the following formula:

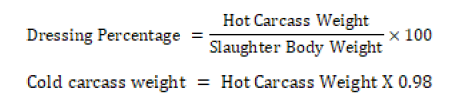
Carcass characteristics: At the end of the experiment, the oxen were fasted feed and water overnight to assure complete bleeding and ease of evisceration then pre-slaughter body weight (FBW) was taken in the morning and all slaughtered at Haramaya University abattoir. After and before slaughter data were taken to evaluate carcass characteristics and meat quality. The animals’ pre-slaughter body weight (FBW) was taken immediately before slaughter using FGS. The carcass parameters such as subcutaneous fat thickness (SFT), hot carcass weight (HCW), dressing percentage (DP), empty body weight (EBW), and cold carcass weight (CCW) were assessed for each animal by using a weighing scale (YiwuWeiyong Electronic TCS-300 kg Price Scale, minimum weight 2 kg, number 24274). Before and after the guts fill was removed from the alimentary tract, the guts were weighed. The abdominal fat was removed from the entire tract and kept separate from the gut. The total non-carcass edible offal (TEO) components were taken as the total weight of heart, liver, kidney, tongue, tail root, empty gut, and fat (kidney, bladder, and abdominal) were weighed separately and added together. The other total non-carcass non-edible offal (TNEO) was taken as the sum of the weight of lung with trachea, spleen, urinary and gall bladder, penis, testicles, intestine, hide, feet, a head without tongue, and gut fill weight were recorded together. The dressed HCW was calculated by subtracting TEO and TNEO from SBW. The EBW was calculated as the difference between slaughter weight and gut fill weight. Subcutaneous fat thickness/depth (SFT) was measured from the incision of the Longissimus Dorsi (LD) muscle in the 12th rib with the help of a B.M cs-005 ruler graduated in millimetres [7]. The DP was calculated as a proportion of HCW to SBW and multiplied by 100. The CCW was estimated at 0.98 of the HCW.
Meat quality parameters: A total of 16 meat samples, three from each treatment were collected from LD of left side carcass between 12th and 13th ribs following the procedure reported by Jama and Dagne. The collected samples were dissected into two and the first part was used to evaluate SFT, water holding capacity (WHC) both drip and cooking loss, and pH parameters, whereas the other part was left for instrumental tenderness. Water holding capacity and pH measurements were performed at two points i.e. on fresh samples within an hour and after twenty-four hours post mortem. The remaining second part of the collected meat samples was vacuum packaged into a polyethylene bag, sealed, stored in the icebox, and transported to the Dairy and Meat Technology laboratory of Oda Bultum University. Samples were aged in the deep freezer for 14 days before steaks were prepared for instrumental tenderness analysis.
pH: The initial pH (pHi) and ultimate pH (pHu) were measured within 45 minutes to one hour and after chilling 24-hours at 0-4oC post-mortem, respectively using a portable instrument of battery drive and glass electrodes digital pH meter (Ph-013 portable microprocessorbased pH/mV/temperature meter, temp range 0-100oC). The pH meter electrode tip was rinsed with distilled water and immersed into a buffer solution of pH 6.86, then the electrode was immersed into a buffer solution of pH 4.01 (25oC) and also pH 9.18 (25oC) stir gently and after waiting a few minutes for the calibration after each sample, after that electrode was submerged into the meat and the value of pH was read after 30 seconds [8].
Water holding capacity (WHC): Drip loss (DL) of meat was measured by the bag method of gravimetric (hanging) proposed by Honikel.
A fat trimmed thick slice (5 × 2 × 3 cm) weighing 40-50 g of loin LD meat sample was weighed and placed in an airtight plastic bottle for 24 hours at 4oC freezer suspended to drip by tying to the bottle cover (plastic bag); the only force on the meat applied is gravity. The sample was removed from the freezer and allowed for half of the time at room temperature to cool, then reweighed [9] and DL was expressed in the percentage of the initial sample as follows:

Cooking loss (CL) for all samples were measured at the same time and temperature by immersing the beef cut (4 × 2 × 3 cm) (L×H×W) in a re-sealable pack bag (polyethylene bags) in a water bath set at 80oC until its internal temperature reached 70oC. The temperature endpoint was determined by using the portable instrument of battery drive and temperature probe digital meter (Ph-013 portable microprocessorbased pH/mV/temperature meter, temp range 0-100oC). After cooling for 1 hour the surface water was removed and the weight difference before and after cooking was calculated as cooking loss following the formula used by Jama [10].

Instrumental tenderness: The Warner-Bratzler Shear Force (WBSF) apparatus was used to measure instrumental tenderness. Steaks for shear force determination were removed from the -22oC freezer and thawed at 4oC for 24 hours before cooking. The steaks were cooked on a cooking pan using a free stand oven (broiling) at a temperature range of 195-220oC and the steaks were removed from the heat source when the internal temperature reaches 71oCand was cooled at room temperature for one hour before analysis by WBSF apparatus.
Heavy connective tissues were removed by using a knife by cutting across the long axis of the steak to know fiber direction. The steak cut 2.5 cm in thickness perpendicular to the long axis of the LD and removed 6 cores parallel with the muscle fibres by using the WBSF device to shear each core. The force applied on each meat core across the middle (center) was determined using the WBSF (G-P Shear machine model- No GR - 151; serial No; 1612021 produced by Gp-electric [11].
Chemical analysis of feeds
The feed used in the experiment was subjected to chemical analysis at Haramaya University Animal Nutrition laboratory. The basal diets, as well as concentrate ration, were sampled from a different place, thoroughly mixed and sub-samples were taken. A representative sample of maize silage was collected directly from the underground concrete silo at three points (at the top, center, and bottom). A 150 g of samples from each location were taken, mixed and sub-sampled for analysis and immediately packed and vacuum-sealed. The sample was placed in a forced-air circulation oven at 60oC for 72 hours to constant weight for the DM analysis as recommended by the Association of Official Analytical Chemists [12]. As per the guidelines of AOAC, the partially dried sample was ground in a mill to pass through with a 1 mm mesh sieve screen for later determination of chemical compositions. Feed samples were analyzed for dry matter (DM), crude protein (CP), ether extract (EE), and ash using the standard procedure of Weende or proximate analysis system. The ash content was determined by combustion and igniting dried feed samples in a muffle furnace at 550oC for 12 hours. The nitrogen (N) content of feeds was determined according to the Kjeldahl method and the crude protein (CP) was calculated as N*6.25. The neutral detergent fiber (NDF), acid detergent fiber (ADF), and acid detergent lignin (ADL) were analyzed by using the procedure of the detergent analysis system outlined by Van Soest [13].
The maize silage pH was measured with a glass electrode on squeezed juice taken from the fresh sample. The silage extract was obtained after homogenization in a bottle bag (plastic bag) for 2 minutes, using 30 g of fresh silage sample and 150 ml of distilled water, the filtrate was filtered through a sieve to obtain the extracts. Immediately after extraction, the measurement of pH was performed using a specific portable electrode digital pH meter coupled to a multi-parameter (Ph-013 portable microprocessor based pH/mV/temperature meter, temp range 0-100oc).
Data analysis
Data on feedlot performance and carcass traits were subjected to one-way analysis of variance (ANOVA) using the General Linear Model (GLM) procedure of Statistical Analysis System computer software version 9.1 and a comparison of means was made using Tukeys’ studentized range test when the p-value was <0.05 to locate the treatment means that were significantly different [14].
The model used for data analysis was:
Yij=μ+Ti + ℇij
Where,
Yij = represents the response of the jthparameter taken under treatment i;
μ = overall mean;
Ti = treatment effect (levels of maize silage) and
ℇij = random error.
Results and Discussions
Chemical composition of experimental feeds
The chemical analysis result of maize silage (MS), hay, and concentrate mixture are presented. The CP, ADL, EE, and OM content of maize silage was higher than hay, while hay was higher in ash, ADF, DM, and NDF than silage. The ideal level of DM in silage described by McDonald [1] is approximately 250-320%. In the present study, the DM content of MS was slightly higher than 27.6% and 23.3% of the report of Keady and Khaing [15], respectively. However, the current value was lower than DM content of 33.2, 32, and 35.1% [7]. This could be due to a difference in maize maturity during ensiling and the presence of undesirable micro-organisms. The CP content of MS is consistent with Keady and Khaing who noted 8% and 8.1%, respectively. However, the CP content of MS was lower than the content of 13.2% [7]; and higher than 7.6% and 7.7%. Silage with a high level of CP is beneficial because it allows for the proper function of rumen microbes.
The NDF content of MS was higher than the content of 52.14% and 58.6%. On the other hand, the value was lower than 75% reported by Ewonetu and Feyisa. The variation in the nutritive value of forage could be due to soil fertility, breed, harvesting seasons, growth environment and stage of plants. According to McDonald [1] when forage matured the cell wall constituent increases, therefore the structural carbohydrates like cellulose and lignin increase. The DM content of hay in the present study was comparable to the values of 93.3% and 93.12%, but it was slightly lower than 94.2%. The OM content of the hay was relatively similar to the OM value of 90.7% but higher than the OM value of 81.9% reported by Mulu.
The crude protein content of native grass hay was lower than the value of 11 % [1] and 8.9% [11] for good quality hay. However, it was higher than 4.2% and 5.6%. It has been stated that the CP value ranging from 7 to7.5% is required to satisfy the maintenance requirement of ruminant animals. Thus, this study proved that the result reported by Van Soest who indicated grass hay could serve as a good source of roughage feed that can provide adequate CP content for the proper function of rumen microbes. Higher CP content of hay is attributed to a good environmental condition in which the grasses were grown and an early stage of maturity at harvest. The NDF content of hay used in this study was lower than NDF content of 79% that reported by Ewonetu and Feyisa [16], however, comparable to the reported values of 77.9% and higher than 72.45%, and 58.29%. The NDF value of hay was high and it might result in low intake of basal diet since NDF is a major factor regulating forage intake by limiting rumen fill. The ADF content of hay was higher than 43% and 42.41%. However, it is similar with 46.68% and 48.32%, and lower than 52.04%.
Regarding feed refusals of MS and hay, however, there was no concentrate ration refusal, CP and OM content was lower, however, that of NDF, ADF, and ash were greater as compared to the content offered. The lower CP and OM contents in the refusals compared to the offered, indicating that the oxen consumed selectively materials with better nutritious parts of the feed.
The drop of MS pH, by side of nutritional composition, is the basic need in the silage quality; since the basic principle of silage making is to convert the sugars in the ensiled fodder into lactic acid; this reduces the pH < 4. Rapid lactic acid production in anaerobic conditions is the desired type of fermentation [16]. In the current study, the pH value of MS (pH=4.3) was nearly consistent with the findings of Berger and Bolsen. However, exceed (pH=3.86) reports ofDe Oliveira. The in appropriate handling of MS, there is undesirable micro-organisms development; hence, less lactic acid is produced thus raising the pH exhibited. As the result, competition for the water-soluble carbohydrates (plant sugars and starches) with the lactic acid bacteria would occur. As a result of the alteration of nutrient content, negative effect would occur. The key to preventing undesirable micro-organisms development is to drop the pH (< 4) of the silage sufficiently to inhibit their growth.
Dry matter and nutrient intake
The DM and nutrient intake of feeds used in the experiment are presented. In the current study, the inclusion of MS level from 0 to 100% significantly influenced the intake of total dry matter (TDMI), crude protein (CP), acid detergent lignin (ADL), organic matter (OM), and neutral detergent fiber (NDF). However, there was no effect on ash and acid detergent fiber (ADF) intake. Animals in T4 consumed higher feed (TDM) by 14.5, 13.29, and 8.05% than oxen in T1, T2, and T3 diets, respectively. This could be attributed to the higher CP content of MS that provided adequate energy to protein ratio, which rapidly degraded and increased the essential nutrients to maintain optimal rumen activity. Besides, it could be due to the higher palatability and good fermentation characteristics of silage which attracted the animals to consume more. Moreover, the presence of lactic acid produced (pH of 4.3) in the MS to regulate intestinal micro-flora and improving rumen fermentation to enhance raised feed intake. Furthermore, it was due to the lower ADF and NDF content and high amount of fermentable carbohydrate and energy of silage, which had increased the intake as compared to grass hay.
In the present study, the TDMI of animals in all treatments ranged from 6.86 to 8.02 kg/day. This was nearly comparable to the TDMI of feedlot Calves (7.5 to 8.6 kg/day) and Hararghe highland bulls (7.54 to 7.82 kg/day) fed on sorghum and maize silage, and hay and ration with Prosopis juliflora pod flours, respectively [17]. However, slightly higher TDMI values were reported by Juniper (9.32 to 9.77 kg/day) and Tsegay (9.49 to 10.11 kg/day). The higher TDMI at higher MS inclusion was highly consistent with Dirk who reported higher daily DMI in oxen fed with whole maize silage.
Daily feed intake as a proportion of percent of body weight (%BW) basis and per unit metabolic body weight (g/KgW0.75) basis was revealed a significant difference (P<0.001) among dietary treatments. The TDMI on %BW basis ranged from 2.48 to 3.02% which is within the recommended range (2.4 to 3.5%) reported by NRC . Moreover, this finding was almost similar to DMI (2.57 to 2.88% of body weight) reported by Fazaeli for crossbreed feedlot calves within 234 to 310 kg of live weight. On contrary, the DM intake as a proportion of percent of BW was slightly lower than the finding 4.62% reported by Tsegay. The DM intake per unit metabolic BW ranged between 101.24 to 122.41 g/kgW0.75 which was comparable with the finding of Fazaeli who reported 106.2 to 119.6 g/KgW0.75for yearling Holstein male calves. However, the 100% replacement of hay by maize silage increased DMI on a %BW basis and g/kgW0.75 by 18.15% and 17.3%, respectively. This could be due to the higher moisture and lower DM content of MS, thereby consume more to compensate.
The DMI g/kgW0.75 was slightly higher than the finding of Yohannes who reported 100g/kgW0.75 for the Hararghe highland bulls fed hay as a basal diet and concentrate mixture containing P.juliflora pod flours as a substitute for wheat bran at a different level.
The nutrient intake was significantly different (P<0.001) among the treatments except for ADF and ash. The higher nutrient intake of ADL, CP, NDF, and OM was recorded for T4. This could be related to the highest DMI of animals in T4 and it also related to the higher content of nutrients in silage than hay: this is why as animals consume more feed they got more nutrients followed the same trend for DM intake [18]. There was a no statistical difference between T2 and T3 in ADL, CP, NDF, and OM intake. The CP intake for all treatments ranged from 0.74 to 0.88 kg/day. The higher values were reported by Tsegay (0.77 to 1.92), Juniper (1.2 to 1.28 kg/day), and Fazaeli (1.01 to 1.15 kg/ day) for feedlot beef cattle. The nutrient intake in the current study was similar (P>0.05) between T1 and T2, and T2 and T3 with an increasing inclusion level of maize silage.
This might be due to the existed higher amount of fiber and mineral fraction in hay substituted by greater MS intake. However, as the whole in the TDM and nutrients intake, there was no statistical difference observed between T1 and T2.
Growth performance and feed conversion ratio
The replacement of hay by MS at different levels influenced final body weight, daily body weight gain, and feed conversion ratio. Although there was no significant difference (P>0.05) in IBW among the treatments, numerically the heaviest FBW, ADG and body weight change (BWC) was noted for T1, however, there was no statistical difference among T1, T2, and T4 in FBW. This could be attributed to higher ADG in T1 and it appears to be consistent with the higher nutrient composition of hay like DM, ash, NDF, and ADF that might have resulted in a difference in nutrient intake available for absorption and metabolism. The other reason is that could be associated with MS fermentation and pH [4]. According to the report of the AFIA (ud) and McDonald during fermentation in a silage pit, there is a lot of losses of nutrients resulting from the sum of prolonged fermentation, moulding, and development of undesirable micro-organisms andbacteria use 4 to 5% of the energy present in the ensiled mass and can compete more strongly for the water-soluble carbohydrates (plant sugars and starches). The consequence is that less lactic acid is produced and the desired rapid decline in pH does not occur. This results in losses of digestible DM, production of mycotoxins, and growth of pathogenic species, it makes silage less palatable and produces metabolic disorders in cattle, and vulnerabilities to the animal can be caused by undesirable micro- organisms [15]. There was no significant difference among T2, T3, and T4 in BWC and ADG; consistent with this finding, lower body weight gain was reported for Simmental breed fed on 50% grass silage and 50% maize silage, and 100% maize silage as compared to the group fattened by only hay. Besides, Keady reported a relative decrease of final live weight as the inclusion of maize silage in the diet of feedlot increased. Moreover, this observation is corresponding to Erickson who noted that the inclusion of MS at more than 30 to 40% in the diet of feedlot depressed average daily gain. The values (297 to 326.67 Kg) of FBW in all treatments was almost comparable to the values of (301.3 to 324.6 kg) and (313 to 339.5 kg) reported by Yohannes and Tsegay, respectively, for Hararghe highland fattened bulls. In the current study, the value of ADG for groups of animals fed on hay as a basal diet was significantly higher than the group of animals fed on maize silage at different proportions.
Consistent with this finding, Keady reported a relative lower of daily live weight gain as replacement of hay by maize silage in the diet of feedlot increased. This could be due to the accumulation of a high and low level of fermentation acid which might have depressed the activity of cellulolytic bacteria in the rumen and development of undesirable micro-organism, and thereby negatively influenced the nutrient, thus body weight gain of animals. This is in agreement with Juniper who reported negatively affected growth performance by the substitution of the high amount of maize silage to the basal diet. The overall ADG values (0.75-1.09 kg/day) of all treatments were comparable to the values of (0.60 to 0.79 kg/day) and (0.68 to 0.94 kg), respectively, reported in Ethiopia by Kassahun and Yohannes [19]. Besides, Tsigereda reported almost comparable ADG (0.83 kg/day) for Hararghe highland bulls fed maize stover and supplemented with concentrate mixture. Conversely, higher ADG (1.03 to 1.33 kg/day) was reported by Tsegay for Hararghe highland bulls fed on hay and concentrate feeds. However, lower ADG (0.5 kg/day) was reported by Mekasha for Ogaden bulls grazing native pasture and supplemented with different proportions of agro-industrial by-products. Variations in ADG could be associated with the breed of animals in fattening and the variation in environmental factors.
In the present study, there was a significant difference (P<0.01) in FCR between animals fed on hay (T1) and silage (T2 to T4). The highest FCR was noted for T3 and T4 but there was no significant difference among the treatments T1 and T2. The FCR (T4>T3>T2>T1) was exhibited numerically an increasing trend with an increase of MS level in the diet and this could be due to an increasing trend of DMI that observed for T4>T3>T2>T1. The overall recorded FCR (6.32-10.11) is higher than the recommended value (6) for beef cattle. However, this value was lower than the results reported by Kassahun (13.4 to 17.5) and Keady (15.1 to 18.4).This study revealed that animals fed on hay (T1) were the most feed efficient. This is consistent with Brown who reported that animals that have a low FCR are considered efficient users of feed. The non-significant difference between T1 and T2 indicates that the replacement of hay by MS up to 33% is recommended in terms of FCR. Moreover, this observation is agreeing with Tufan and Erickson who noted that the inclusion of MS at more than 30 to 40% in the diet of feedlot hurt FCR.
Carcass characteristics
The effects of replacing hay by MS on carcass characteristics of feedlot Harar oxen are presented. The highest EBW, HCW, and CCW were noted for T1 which was significantly (P<0.05) different from a group of animals fed on T2, T3 and T4. This was associated with the highest recorded FBW, BWC, and ADG in T1. However, there was no significant difference among T2, T3, and T4 which were offered silage at different proportions. Correspondingly, Erickson noted that substitution of MS for maize grain significantly resulted in lower HCW in bulls as compared to 15, 30, and 45% replacement. The overall value of HCW (152.22 to 180.60 kg) was almost comparable with the result (157.3 to 185.7kg) reported by Yohannes [20]. Conversely, it was lower than the result (192.8 to 216.8kg) that reported by Kassahun (2018) but higher than the results reported by Mummed and Webb (135.9±0.69 kg), Kebede and Getachew (72.5 to 119 kg), and Tsegay (132 to 165.4 kg) for indigenous cattle at local abattoirs of Ethiopia.
The dressing percentage (DP) based on SBW, EBW, and CCW ranged from 50.49 to 55.4%, 59.91 to 64.14%, and 49.48 to 54.29%, respectively. The highest DP (SBW, EBW, and CCW) were noted by T1 and this could be associated with the highest FBW, SBW, EBW, and CCW value recorded by T1. Furthermore, oxen in T1 exhibited lower DMI, which means lower gut fill that direct to higher EBW: thus, higher DP was recorded at the end. The DP noted in this study was greater than the results recorded for Boran (47.49%), for Arado, Raya, and Barka cattle (44.24±0.11; 43.99±0.05; 43.68±0.07%), for Ethiopian Zebu breeds (28.93 to 48.75%), and for Harar breed (47.80), respectively, reported by Mohammed , Mummed and Webb Kebede and Getachew, and Dagne. However, almost comparable results were reported by Mengistu for Ethiopian highland Zebu cattle (51.4+0.8%), non-working cattle (51.1±0.9%), worked Ethiopian cattle breeds (51.6±0.6%), and a report by Mummed and Webb for Boran cattle (54.78±0.15%). On the other hand, the higher result of the dressing percentage (56%) was reported for Ogaden bulls. This disparity in DP could be due to differences in environment, breed type, age of slaughter, the level of fattening, agricultural workload (draught power), and management given .
In the present finding, total edible non-carcass offal (TEO), namely, kidney, heart, liver, empty gut, abdominal fat, tongue, and bladder fat were different (P<0.05) among the treatment groups. The TEO values among T1, T2, and T3 were not significant while T4 was recorded the highest result in TEO. This was due to the weights of some visceral organs in the T4 which was influenced by the level of nutrition; like an empty gut enlarged to hold a large amount of feed. However, T3 was not different from T4 [21]. On contrary to the current study, Mekasha found a non-significant (P>0.05) difference for TEO among treatments supplemented with different rations. The TNEO (hide, feet, a head without tongue, gut fill, spleen, urinary and gall bladder, blood, penis testicles) was not different (P>0.05) among the treatments. The overall result noted for TNEO was ranged from (107.49 to 110.9 kg) which was comparable to the result (103.98 kg) reported by Yohannes but it was lower than the result (114.4+2.1 kg) reported by Kassahun. There was a significant difference (P<0.05) in subcutaneous fat thickness (SFT) among the treatments and the highest result was noted at T4. This might be due to higher under skin fat coverage in T4 and it is directly linked to the higher energy content of the MS. This increment of energy could be related to the higher ether extract and crude protein content of MS as compared to the hay chemical composition.
The increment in metabolizable energy of the diet is the increment in muscle glycogen content and fat deposition. In line with this report, Juniper noted the increased SFT as MS level increase in the diet of feedlot cattle. The overall SFT value of this finding was comparable to the result (3.3+0.03 to 4.3+0.03 mm) reported by Aregawi for Afar bulls fed on improved feed for the export market. The finding was lower than the findings of Keady and Dagne who reported higher SFT (4.63 to 5.83 mm) and (5.08 mm: age 4-6 years of Harar cattle), respectively. However, higher than the results of 3.6, 2.9+0.03, and 3.6+0.07 mm reported for Holstein Friesian, Brown-Swiss and Simmental bulls maintained under ad libitum feeding management.
Meat quality
The replacement of hay by maize silage effect in the diet of beef cattle is presented. The analysis of variance indicated that there was slight variation (P<0.05) in instrumental tenderness among the treatments. According to Shackelford, and Calkins and Sullivan, the instrumental tenderness measurement values were categorized as T1 and T4 were tough (WBS > 45.1 N), T2 was tender (31.4 N< WBS < 38.3 N) whereas, T3 was intermediate (38.3 N< WBS < 45.1 N). The tenderness value of T2 was nearly similar to the values of 37.71 N, and 36.10+1.94 N reported for Brazilian cattle and Harar bulls, respectively [22]. The overall tenderness value (37.35 to 55.72 N) in this study was relatively tenderer than the shear force values of 65.24+2.69 N and 58.38+4.39 N, respectively reported for Arsi and Bale cattle (>9 years) at wet season. In contrast, the value was tougher than the WBSF of Boran and Harar bulls of 20.56 ± 1.33 and 19.07 ± 1.33 N as reported by Birhanu. However, it was comparable with the results of 45.37+1.92 and 47.60+4.41 N that respectively reported for Arsi and Bale bulls at the age of 5-7 years. The highest instrumental tenderness (the more tough meat yield) noted, in this study, was probably associated with differences in feed type, breed, age of slaughter, and effect of agricultural work-load (draught power) experienced in the past. The instrumental tenderness evaluated by Birhanu on Harar, Boran and Arsi breeds was based on intact bulls while the result of the current study based on oxen. Most oxen in Ethiopian condition passed through the activities of plowing land. Moreover, the possible impact of draft power utilization of oxen on the quality of the beef was suggested by Gadisa. Consistently, the earlier scholars reasoned out the higher value of instrumental tenderness noted in older cattle.
The most tenderness in T2 indicates that the replacement of hay by MS at more than 33% was increased meat toughness hence replacement at more than this level is not recommended in terms of meat tenderness.
The ANOVA results indicated that drip losses (DL) were not affected by treatments (P > 0.05). The overall DL ranged from 4.04 to 4.79% which is within the acceptable standard according to Warner and Kauffman who reported that meat with an acceptable quality has a DL of less than or equal to 5%.
A slice of meat with high visual marbling scored a significantly lower DL than meat with low visual marbling. In contrast, meat with high-fat content had higher CL than meat with low-fat content (no difference in DL). An increase in both DL and CL has a large quality impact in the beef industry due to its effects on low WHC, decreases meat tenderness and juiciness and unattractive appearance [23]. Reduced DL (< 5%) results in good WHC of meat and reduced loss of weight from carcasses and cuts and may not affect the yield and quality of processed meats.
There was a significant difference (P<0.05) in the CL% among the treatments. The study showed that T1 and T4 noted the highest whereas T2 had the least CL%. The result revealed that there was an increment of CL% as MS inclusion increased from T2 to T4 due to the energy density in the diet increased fat accumulation. This is because meat from a fatty animal was easily fragmented during cooking. Moreover, as a percent of fat increase WHC decrease for the reason that fat is non-polar and as the percent of fat increase percent of structural protein decrease. The lower the CL%, the better is the tenderness, juiciness and thereby the better WHC of the beef. This implied that the replacement of hay by MS at more than 33% increased CL% hence replacement at more than this level is not recommended [24]. Although the acceptable CL amount varies depending on a few factors including the type of meat, cooking temperature, pH and protein content: however, generally speaking, beef, poultry, and fish losses about 25% when cooked (https://leaf.nutrisystem.com/howmuch- does-raw-meat-shrink-when-cooked/). The overall CL levels (19.42 to 23.22%) in the current study were almost below the desired level and comparable to the result (22.5%) reported by Jeremiah and Gibson. The CL value in this study was lower than 30% reported for pasture-fed bulls and 25% for Angus breed. Based on the result, DL and CL were lower, the higher is WHC about a water loss percentage. The differences in DL and CL in the current study and those reported by earlier scholars could be attributed to several factors such as differences in ageing, the cooking method applied, cooking temperatures, and duration of cooking temperatures, pH, and Marbling. There were no significant differences (P>0.05) for the fresh carcass initial pH (pHi) among the treatments which is consistent with the finding of Gadisa. The average pHi, when the temperature of the carcass is still high or warm (T>34oC) in the current study, falls under the normal meat pHi range (6.3 to 6.5) [25]. When the pHi decline is rapid and reaches <5.8 while the muscle temperature is still high (T>34oC), the meat decided as PSE. The experimental diet, in the current study, was influenced the ultimate pHu (pHu) (P<0.05). The overall meat pHu (5.49 to 5.62) obtained was within the desired range of quality meat pHu (5.4 to 5.7) and the value above 5.8 is an indication of dark-cutting, reduced shelf life, and weak beef flavor. The lower pHu in T2 to T4 (P>0.05) is related to the muscle glycogen and fat deposition that converted to lactic acid after animal death thereby the more lactic acid and declined pHu. This could be associated with differences in dietary energy content (starch in maize silage) that causes fat deposition and glycogen synthesis in muscles. The replacement of hay by MS, in this study, at more than 33% was not changed the pHu, hence the replacement at more than this level has no meaning in this regard. The pHu value noted in this study was consistent with the values (5.4 to 5.8) reported by earlier scholars.
Conclusion
The TDM and nutrient intake was higher in the T4, however, no difference in T3, T2 and T1. Significantly different (P<0.01) daily weight gain was recorded among the treatments and the highest values were noted for T1 (1.09kg). The small feed conversion ratio (FCR; feed: gain) was recorded in the T1 while larger in T3 and T4 were noted. A significant difference (P<0.05) were noted in final body weight (FBW) between treatments with the highest was observed for T1 which was statistically similar (P>0.05) with T2 and T4. Slaughter body weight (SBW), empty body weight (EBW), hot carcass weight (HCW), cold carcass weight (CCW), and dressing percentage (DP) which took a similar trend to that of final body weight (FBW) which was related with daily body gain. Generally, oxen fed diets with a higher proportion (>33%) of MS had the lower ADBG, FBW, HCW, and higher FCR of the animals as compared to those fed on hay (T1). This study, in terms of FCR and BWG, did not recommend the replacement of hay by MS at more than 33%. The subcutaneous fat thickness (SFT) was significantly (P<0.05) influenced by the experimental diet and a higher value was recorded for the oxen assigned to MS at a higher proportion.
Based on the instrumental tenderness measurement value categorization, T1 and T4 (WBS > 45.1), T2 (31.4 N< WBS < 38.3 N) and T3 (38.3 N< WBS < 45.1 N) were categorized as tough, tender and intermediate, respectively. The drip loss (4.04 to 4.79%) felt within the acceptable standard (less than or equal to 5%) that was reported for meat with acceptable quality. Though the overall meat pHu (5.49 to 5.62) obtained was within the desired range of quality meat pHu (5.4 to 5.7), the experimental diet was influenced by the pHu (P<0.05). The replacement of hay by MS at more than 33% was not changed the pHu, raised CL% and meat toughness, hence, the experiments confirmed that the replacement at more than this level is not recommended in this regard.
Therefore, based on the results, it could be concluded that the inclusion of MS at higher levels (> 33%) of the diet were potentially less feasible. Hence, based on the conclusion, further study is recommended to verify the optimum level of MS inclusion in the diet of beef fattening to evaluate its effect on beef sensory attributes and fatty acid profiles.
Availability of data
The data of this study are available from the corresponding author upon request.
Acknowledgements
The authors would like to thank Enterprise Development Director Office of Haramaya University for their provision of experimental animals and feeds. The authors wish to thank the Misha District Livestock and Fisheries Resource Office, which allows me to upgrade.
Funding
Financial funding for this study, United States Agency for International Development (USAID) Bureau for Food Security, is gratefully acknowledged.
Conflict of Interest
The authors declare that they have no competing interests.
Code availability
Not applicable Authors’ contributions: Designed the study, data collection, analyzed the data writing and preparation of the original draft, and writing involving reviewing and editing. All authors read, reviewed and approved the final manuscript.
Consent for publication
All authors consented to the publication of the manuscript.
Ethical standards
The manuscript does not contain clinical studies or patient data.
References
- Tripathi HP, Singh AP, Upadhyay VS, Kessels HPP, Harika AS, et al. (2000) Forage Conservation, Storage and Feeding. In: Kiran Singh and J.B. Schiere (eds.), Handbook for Straw Feeding Systems. ICAR, New Delhi, India.
- McDonald P, Edwards RA, Greenhalgh JFD, Morgan CA, Sinclair LA, et al. (2010) Animal Nutrition, 7th edition. Pearson Prentice Hall, London, England.
- Gerlach K, Ross F, Weib K, Büscher W, Südekum KH (2018) Changes in maize silage fermentation products during aerobic deterioration and effects on dry matter intake by goats. Agricultural and Food Science 22: 168–181.
- Roth GW, Heinrich AJ (2001) Corn silage production and management. Penn State Extension, Agronomy Facts 18.
- Browne EM, Bryant MJ, Beever DE, Thorp CL (1998) Effect of forage maize harvested at different stages of maturity on feed intake and performance by growing beef cattle. British Society of Animal Science. In Proceeding 114th Annual Meeting pp 148. Southport, UK.
- Atwood SB, Provenza FD, Wiedmeier RD, Banner RE (2001) Influence of free-choice vs mixed-ration diets on food intake and performance of fattening calves. J Anim Sci 79: 3034- 3040.
- Juniper DT, Browne EM, Fisher AV, Bryant MJ, Nute GR, et al. (2005) Intake, growth and meat quality of oxen given diets based on varying proportions of maize silage and grass silage. Animal Science 81: 159-170.
- Wood JD, Richardson RI (2004) Factors affecting flavour in beef. A literature review, with recommendations for the British beef industry on how flavour can be controlled Division of Farm Animal Science University of Bristol.
- Erickson GE (2013) Feeding Elevated Levels of Corn Silage in Finishing Diets Containing MDGS 68-75. In: Dirk B. Burken, Brandon L. Nuttelman, Terry J. Klopfenstein, and Galen E. Erickson (eds), Nebraska Beef Cattle Report. Lincoln, USA.
- Tatum JD (2006) Pre-harvest cattle management practices for enhancing beef tenderness. National Cattlemen's Beef Association, Centennial, Colorado.
- HU (Haramaya University) (2019) About University.
- MSU (Mississippi State University) (2013) Estimating Cattle Age Using Dentition. Mississippi State University Extension Service, U.S. Department of Agriculture, Washington, D.C.
- NRC (National Research Council) (2000) Nutrient Requirements of Beef Cattle, 7th Edition. E-974. National Academy Press, Washington, D.C.USA.
- Müller L (1987) Normasparaavaliação de carcaças e concurso de carcaças de novilhos. Santa Maria. Universidade Federal de Santa Maria, Italy.
- Warriss PD (2000) Meat Science-An Introductory Text. CABI Publishing, U.K.
- Yohannes Dagnew (2011) Feeding value of Prosopis juliflora pod’s as a substitute for Wheat bran in fattening ration of cattle. MSc Thesis, Haramaya University, Haramaya, Ethiopia.
- Pesonen M, Honkavaara M, Huuskonen A (2012) Effect of breed on production, carcass traits and meat quality of Aberdeen Angus, Limousin and Aberdeen Angus x Limousin bulls offered a grass silage grain-based diet. Agricultural and Food Science 21: 361-369.
- Senbeta EK, Megersa AG (2019) Carcass characteristics of draught cattle released for beef in Eastern Ethiopia. Ethiopian Veterinary Journal 23: 1-11.
- Jama N, Muchenje V, Chimonyo M, Strydom PE, Dzama K, et al. (2008) Cooking loss components of beef from Nguni,Bonsmara and Angus oxen. African Journal of Agricultural Research 3: 416-420.
- Dagne T, Yusuf Y, Yusuf M, Urge M, Quine TO, et al. (2019) Effect of Age and Breeds of Cattle on Carcass and Meat Characteristics of Arsi, Boran, and Harar Cattle in Ethiopia. Open Journal of Animal Sciences 9: 367-383.
- Birhanu AF, Mummed YY, Mohammed YK, O’Quinn T, Jiru YT (2019) Level of Pre-slaughter stress and quality of beef from Arsi, Boran and Harar cattle breeds in Ethiopia. Cogent Food and Agriculture 5: 1, 1694233.
- Honikel OK (1987) Water binding capacity of meat. Fleischwirtschaft 67: 418–428.
- Wilborn BS, Kerth CR, Owsley WF, Jones WR, Frobish LT (2004) Improving pork quality by feeding super nutritional concentrations of vitamin D3.J Anim Sci 82: 218-224.
- Huff-Lonergan E, Lonergan SM (2005) Mechanisms of waterholding capacity of meat: the role of postmortem biochemical and structural changes. Meat Science 71: 194–204.
- Shackelford SD, Wheeler TL, Koohmaraie M (1999) Tenderness Classification of Beef: II. Design and Analysis of a System to Measure Beef Longissimus Shear Force Under Commercial Processing Conditions. J Anim Sci 77: 1474-1481.
Indexed at, Google Scholar, Crossref
Indexed at, Google Scholar, Crossref
Indexed at, Google Scholar, Crossref
Indexed at, Google Scholar, Crossref
Indexed at, Google Scholar, Crossref
Indexed at, Google Scholar, Crossref
Indexed at, Google Scholar, Crossref
Indexed at, Google Scholar, Crossref
Citation: Gage A, Mummed YY, Kebede E, Girma M (2023) Effect of Maize Silageon Feedlot Performance, Carcass Traits and Meat Quality of Ethiopian Cattle. JFisheries Livest Prod 11: 440. DOI: 10.4172/2332-2608.1000440
Copyright: © 2023 Gage A, et al. This is an open-access article distributed underthe terms of the Creative Commons Attribution License, which permits unrestricteduse, distribution, and reproduction in any medium, provided the original author andsource are credited.
Share This Article
Recommended Journals
Open Access Journals
Article Tools
Article Usage
- Total views: 998
- [From(publication date): 0-2023 - Apr 19, 2025]
- Breakdown by view type
- HTML page views: 724
- PDF downloads: 274