Effect of Gasoline Fumes on Blood and Urine Parameters of Attendants (non-smokers) among Different Age-Groups and Brands (PSO, SHELL and CALTEX) of Gasoline Filling Station in Multan, Pakistan
Received: 06-May-2023 / Manuscript No. TYOA-23-97963 / Editor assigned: 09-May-2023 / PreQC No. TYOA-23-97963 (PQ) / Reviewed: 24-May-2023 / QC No. TYOA-23-97963 / Revised: 01-Mar-2024 / Manuscript No. TYOA-23-97963 (R) / Published Date: 08-Mar-2024
Abstract
Background and objectives: Gasoline workers are constantly exposed to toxic gasoline vapors during their working hours. These vapors are cytotoxic that effect the hematological parameters and urine composition. The aim of this study was to evaluate the effects of the gasoline vapors on CBC and urine of gasoline workers with reference to the ages and different brands.
Materials and methods: We therefore divided our subjects into different age groups and collected data for comparative analysis of different brands. Complete blood counts were analyzed on automatic Celltac G MEK-9100 analyzer and urine was analyzed by using the color patch strip analysis (Roche).
Results: In our results WBC, EO, BA, PLT, PCT and MPV were highly significant increased in all age group. RBC counts, hemoglobin level and their indices, HCT, MCV and MCH were also significantly decreased. The significant variations were found among the RBC, HGB, MCV, MCH, PCT, MPV and NE across the age groups. Significant variations were also found in MCV and PCT in gasoline brands workers. In the urine, abnormalities were seen in specific gravity, pH values, nitrate, protein and bilirubin all age groups.
Conclusion: It is concluded that most blood and urinary parameters were affected by exposure to gasoline. Abnormalities in blood and urine parameters were more prominently assessed in higher age group (41-50 years).The environmental pollution due to gasoline vapors cause the serious health problems in blood which needs to be investigated further. Periodical medical examinations are recommended.
Keywords
Complete blood count; Urine composition; Gasoline vapors; Filling stations; Health impacts; Toxicity
Abbreviation
WBC: White Blood Cell, NE: Neutrophils, LY: Lymphocyte, MO: Monocytes, EO: Eosinophils, BA: Basophils, RBC: Red Blood Cell, HGB: Hemoglobin, HCT: Hematocrit, MCV: Mean Corpuscular Volume, MCH: Mean Corpuscular, MCHC: Mean Corpuscular Hemoglobin Concentration, RDW-CV: Red Blood Cell Distribution Width-Coefficient of Variation, RDW-SD: Red Blood Cell Width-Standard Deviation, PLT: Platelet, PCT: Plateletcrit, MPV: Mean Platelet Volume, PDW: Platelet count Distribution Width, P-LCR: Platelet Large Cell Ratio
Introduction
The term gasoline is used widely in the USA and the petrol is used in Britain and Pakistan. Gasoline contains substantial quantities of perilous and cancer causing chemicals like benzene, toluene, methylbenzene, xylene and numerous others [1]. Gasoline contains complex mixtures of toxic chemicals (i.e. more than 150 hydrocarbons). These hydrocarbons are comprised of about 50% to 70% of C4 to C12 straight chain alkanes (paraffin). Aromatic compounds (seriously carcinogenic) are also present in gasoline at 30% to 40% levels like benzene, toluene, ethyl benzene and xylene [2]. The standard specifications of different gasoline (European, Indian, and Pakistani) are shown in Table 1 [3].
| Property | aEuropean Parliament 2012/2017 | b(Indian) 2010 | cPakistani standard specification/(dand eanalytical quality) |
|---|---|---|---|
| Appearance | Clear and bright | Red (ULP) | Pinkish/Pinkish |
| Density at 15°C, Kg/m3 | 720-775 | 745 | 0.76 |
| Olefins max. | ≤ 18 (% v/v) | ≤ 10 (% v/v) | ND |
| Aromatics max. | ≤ 35 (% v/v) | ≤ 35 (% v/v) | ND/(42.77 wt%) |
| Benzene max. | 1.0 (% v/v) | 1.0 (% v/v) | ND/(5.07 wt%) |
| Oxygen max. | 2-3 (w/w%) | 2.-5 (w/w%) | ND |
| Sulphur max. | 0.005 (wt/wt% ) | 0.003 (wt/wt% ) | ND |
| Lead content (mg/L) max. | 5.0 (w/w%) | 5.0 (w/w%) | ND |
| ahttps://www.mabalive.co.uk/products/unleaded-petrol. bhttps://www.transportpolicy.net/standard/india-fuels-diesel-and-gasoline. cStandard test limits are produced from Pakistan standard 1430:1999(UDC:665.733.5) and ministry of petroleum and natural resources of Pakistan has directed “to report “ the specific gravity at 60/60 °F. dAnalytical Studies on the quality and environmental impact of commercial moto gasoline available Multan region of Pakistan. Pak J Anal Envirn Chem. Vol.9, No.2 (2008). eA Review of Transport and Urban Air Pollution in Pakistan. J Appl Sci Environ Manage. 2007;11(2):113-121. ND: No. Data available |
|||
Table 1: Standard specification of European, Indian and Pakistani gasoline/petrol.
Pakistani gasoline consists of above mentioned chemicals (especially aromatic ones) at very high concentration and is unsuitable environmentally. PSO, SHELL and CALTEX brands of gasoline are used in Pakistan. CALTEX gasoline has 32.98 wt% concentration of aromatics, PSO has 43.19 wt% and SHELL has 42.35 wt%. European standards have 1% v/v limit for benzene in gasoline [4]. In Pakistan, the benzene concentration in PSO gasoline is 4.54 wt%, 5.44 wt% in SHELL and 5.25 wt% in CALTEX [5]. These concentrations of benzene in motor gasoline are very high which is alarming for the health of workers. The use of gasoline is increasing day by day. It can be a serious threat to workers as well as the general population of Pakistan in the future.
Gasoline vapors deteriorate Ambient Air Quality (AAQ) through the fugitive and exhaust emission. Oxygenates are mixed as octane improvers in petrol to decrease CO emission. In Pakistan no such preventive measures are taken by the ministry of petroleum, whereas in Europe 2-3 wt/wt% oxygenates are mixed in gasoline to protect the environment [6].
During the refueling at the service station, the saturated air with gasoline vapors is expelled out through the nozzle around the filling pipe and moved into the respiratory zone of working. These volatile hydrocarbons are readily inhaled by the workers and may cause a wide range of adverse health effects. Several factors such as exposure intensity and duration, chemical and molecular properties of the gasoline as well as inter individual differences (pharmacodynamics and pharmacokinetics variations) affect the health of workers.
Workers at filling station are at the highest risk of being exposed to toxic hydrocarbons and other gasoline constituents. Dealing with petrol fumes/vapors can have a variety of side effects on hematological investigations, renal function demolition, hepatic, central nervous systems and lung functions [7]. Platelets are blood cells in plasma that prevent bleeding by sticking together to form a clot. Clinically high platelets levels can lead to the certain condition including stroke, heart attack or clot in the blood vessel [8]. Plateletcrit (PCT) is a bioactive peptide and secreted by thyroid C cells. It is released into the blood that is an indicator of infection and inflammation in the clinic [9]. Elevation in Mean Platelet Volume (MPV) levels has been recognized as an independent factor for myocardial infarction in patients with coronary heart disease [10]. MPV has been found to be clinically useful in characteristic Immune Thrombocytopenia (ITP) from thrombocytopenia caused by underproduction of the platelets. Ntaios G and others observed that an increase in MPV was observed in Immune Thrombocytopenic Purpura (ITP) [11]. The high MPV also predicting poor prognosis in acute ischemia [12].
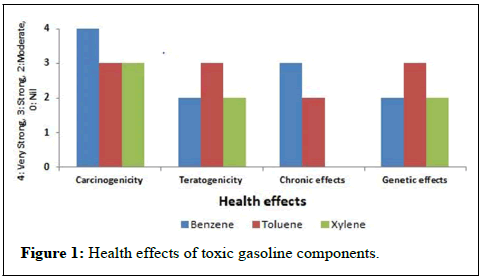
World Health Organization (WHO) and Environmental Protection Agency (EPA) declared that gasoline fumes contain toxic carcinogenic compounds which cause oxidative stress, dermatological problems, respiratory confusion, cytogenetic effects, structural changes in DNA, immune system deformity and also threats of leukemia, lymphoma and other types of cancer. The toxicity of gasoline constitutes is shown in Figure 1.
In Pakistan, the majority of gasoline filling stations workers are not using any type of protective equipment’s to avoid exposure to the toxic gasoline vapors. Multan is a very densely populated city in Pakistan where the environmental influence is very worrying and alarming. There is a need of regular medical check-up of workers. The complete blood count and urinalysis is an essential diagnostic tool to investigate the deleterious effects of gasoline fumes on hematological and urinary damage in them.
Materials and Methods
Study subject: Total seventy five healthy male individual (nonsmoker) were included in the study from fifteen dynamic gasoline retail outlets (PSO, SHELL and CALTEX) in Multan whose working experience was (range 3 to 10 years) on the same brand of gasoline. Out of total, five samples were collected from each filling station. On the basis of their age, the subjects were divided into three groups: Group-I consisted of the age of 21-30 years, group-II 31-40 years and group-III 41-50 years. Each age group contains twenty five sampled [13].
Control subject: Healthy (non-smokers) individuals were selected as control subject that never worked at gasoline filling stations. Every individual was clinically examined (viral markers are screened by immune chromatographic test and biochemical parameters was examined by chemistry analyzer P500 Diatron). Age of control and grouping were same as the study subject.
Inclusion/exclusion criteria: The study was limited to only the gasoline retail outlet workers that were exposed to gasoline vapors at working hours. They also never used cigarettes, alcoholism, cocaine, and other abuse addictions. The attendants that worked in multiple brands were excluded.
Sample collection: The blood samples were taken (from July to August 2018) into k-2 EDTA vacutainers (5.4 mg, 3.0 ml, Becton Drive, Franklin Lakes, USA) and kept immediately at 8°C ± 2°C. Midstream urine samples (approximately 40 ml) were taken from every subject in sterilized sample cups [14]. The samples were transferred into the clinical laboratory of MINAR within one hour after collection. All blood and urine samples were collected in relaxed condition from the subjects in the all days.
Hematological analysis: Complete blood counts were analyzed on automatic Celltac G MEK-9100 (Nihon Kohden, Japan)after the quality control with standard reference material of different concentration (low, medium and high). White blood counts with differential neutrophils, lymphocytes, monocytes, eosinophils and basophils, red blood cell counts and hemoglobin level with their indices HCT, MCV, MCHC, RDW-CV, RDW-SD, and platelet counts with its indices PCT, MPV, PDW and P-LCR parameter were included in the study.
Urine composition analysis: Assessment of urine composition was performed by visual reading using the color patch strip analysis (Combur-10 Test, Roche Diagnostics, Germany) at room temperature for all the days of sampling collection. The test strip was dipped (about 3 second) into the urine sample and taken reading within 45 second. The developed reaction color was compared with the specific color labeled on the urinalysis box and taken reading (Analysis).
Statistical analysis: Data analysis was performed in IBM SPSSStatistics, version-24. P-value was calculated between the study group and the control by paired T-test after the verification of normal distribution by D’Agostino Pearson test. The Wilcoxon rank sum test was used to calculate the difference for those parameters that had a non-normal distribution. Fisher exact test was applied for nominal data of urine compositions. Mean percent change difference was calculated by the formula (mean % difference=(test value-reference value)/ reference value x 100) [15]. One way ANOVA was applied among the age-groups and brands. P<0.05 was considered significant results.
Results
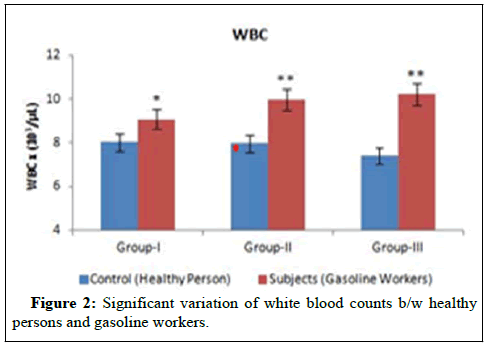
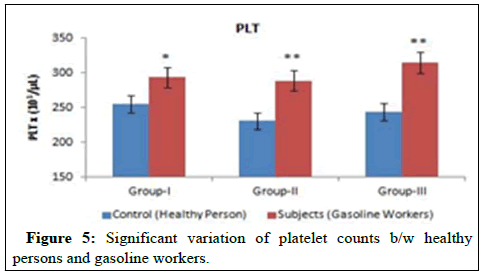
The main results investigated from this study are presented in Table 2 and Figures 2-5. In hematological profiles; White Blood Cell counts (WBC) with differentials Eosinophil’s (EO) and Basophils (BA), the Platelet Counts (PLT) with its indices Plateletcrit (PCT) and Mean Platelet Volume (MPV) were significantly increased in three age groups (I, II and III).
| Parameters (unit) | Group-I (21-30 years) | Group-II (31-40 years) | Group-III (41-50 years) | ||||||
|---|---|---|---|---|---|---|---|---|---|
| Control | Worker | Mean % difference (p-value) | Control | Worker | Mean % difference (p-value) | Control | Worker | Mean % difference (p-value) | |
| aWBC x (103/µL) | 8.02 ± 1.30 | 9.06 ± 0.95 | 12.9 (0.02)* | 7.96 ± 1.07 | 9.97 ± 2.15 | 25.2 (<0.01)** | 7.39 ± 1.06 | 10.23 ± 2.09 | 38.4 (<0.01)** |
| aNE x (103/µL) | 4.03 ± 1.18 | 4.46 ± 0.78 | 10.6 (0.25) | 4.20 ± 0.66 | 5.48 ± 1.01 | 30.4 (<0.01)** | 3.95 ± 0.90 | 4.93 ± 0.43 | 24.81 (0.06) |
| aLY x (103/µL) | 3.49 ± 0.86 | 2.93 ± 0.56 | -16.0 (0.02)* | 2.95 ± 0.35 | 3.31 ± 0.90 | 12.2 (0.17) | 2.65 ± 0.50 | 3.37 ± 0.65 | 27.16 (0.01)* |
| bEO x (103/µL) | 0.29 ± 0.29 | 0.49 ± 0.33 | 68.9 (0.03)* | 0.32 ± 0.21 | 0.72 ± 0.29 | 125.0 (<0.01)** | 0.23 ± 0.08 | 0.75 ± 0.33 | 226.0(<0.01)** |
| aMO x (103/µL) | 0.47 ± 0.12 | 0.43 ± 0.11 | -8.5 (0.54) | 0.56 ± 0.17 | 0.66 ± 0.63 | 39.3 (0.40) | 0.50 ± 0.10 | 0.88 ± 0.79 | 76 (0.23) |
| bBA x (103/µL) | 0.07 ± 0.03 | 0.10 ± 0.03 | 42.8 (0.03)* | 0.07 ± 0.02 | 0.13 ± 0.10 | 85.7 (<0.01)** | 0.06 ± 0.03 | 0.19 ± 0.12 | 216.6 (<0.01)** |
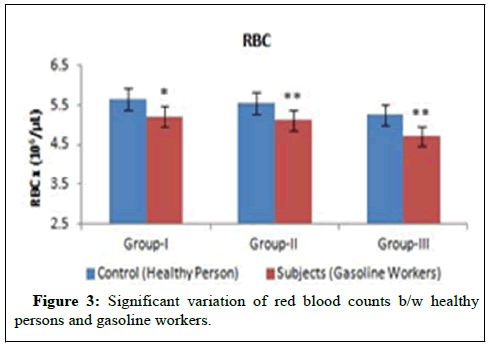
| aRBC x (106/µL) | 5.67 ± 0.43 | 5.22 ± 0.40 | -8.0 (0.01)* | 5.56 ± 0.38 | 5.13 ± 0.49 | -7.7 (<0.01)** | 5.26 ± 0.47 | 4.71 ± 0.28 | -10.4 (<0.01)** |
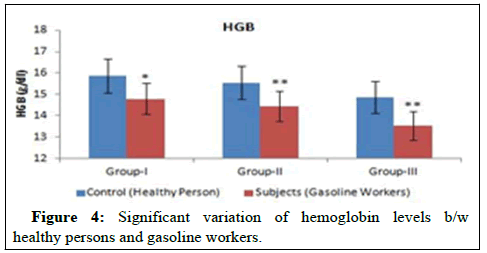
| aHGB (g/dl) | 15.87 ± 1.38 | 14.80± 0.86 | -6.7 (0.02)* | 15.55 ± 0.95 | 14.44 ± 1.56 | -7.1 (<0.01)** | 14.87 ± 0.72 | 13.51 ± 1.10 | -9.1 (<0.01)** |
| aHCT (%) | 48.25 ± 2.63 | 44.33± 2.63 | -8.1(<0.01)** | 47.91 ± 4.02 | 42.68 ± 5.30 | -10.9 (0.02)* | 46.02 ± 0.62 | 40.11 ± 4.10 | -12.9 (<0.01)** |
| bMCV (fL) | 90.72 ± 2.86 | 87.85±3.14 | -3.1 (0.04)* | 88.76 ± 2.94 | 83.64 ± 6.22 | -5.76 (<0.01)** | 86.94 ± 4.41 | 78.14 ± 6.14 | -9.3 (<0.01)** |
| aMCH (pg) | 28.62 ± 1.28 | 27.39± 1.42 | -4.3 (0.04)* | 28.76 ± 0.57 | 26.48 ± 2.61 | -7.4 (<0.01)** | 28.68 ± 1.94 | 25.65 ± 3.32 | -10.6 (<0.01)** |
| aMCHC (g/dl) | 31.82 ± 1.09 | 32.64± 0.58 | 2.5 (0.05) | 30.59 ± 2.25 | 28.00 ± 4.49 | -9.0 (0.04)* | 31.46 ± 0.87 | 30.86 ± 4.38 | -1.9 (0.24) |
| aRDW-CV (%) | 13.29 ± 0.77 | 13.14 ± 1.35 | -1.1 (0.62) | 13.96 ± 0.82 | 13.59 ± 2.24 | 2.65 (0.50) | 13.92 ± 2.22 | 13.30 ± 2.20 | -4.5 (0.28) |
| aRDW-SD (fL) | 46.61 ± 2.94 | 46.20 ± 3.28 | -0.8 (0.60) | 47.92 ± 4.44 | 44.57 ± 3.75 | -7.0 (0.07) | 46.16 ± 4.72 | 44.25 ± 2.90 | -4.1 (0.27) |
| aPLT x (103/µL) | 254.55 ± 43.33 | 293.48 ± 31 | 15.2 (0.03)* | 231.00 ± 25.43 | 288.50 ± 40.54 | 24.8 (<0.01)** | 243.92 ± 25.75 | 314.43 ± 45.04 | 29.2 (<0.01)** |
| aPCT (%) | 0.20 ± 0.04 | 0.25 ± 0.04 | 25.0 (<0.01)** | 0.16± 0.03 | 0.23± 0.07 | 43.7 (<0.01)** | 0.20 ± 0.03 | 0.29 ± 0.07 | 45.0 (<0.01)** |
| aMPV (fL) | 7.47 ± 0.37 | 7.89 ± 0.54 | 5.6 (0.03)* | 7.52± 0.80 | 8.35± 0.84 | 11.0 (<0.01)** | 7.71 ± 0.84 | 8.71 ± 0.84 | 12.9 (<0.01)** |
| bPDW (%) | 17.94 ± 0.96 | 17.63 ± 0.54 | -1.7 (0.15) | 17.76 ± 0.72 | 18.18 ± 0.68 | 2.36 (0.16) | 17.67 ± 1.09 | 18.05 ± 0.61 | -2.1 (0.19) |
| aP-LCR (%) | 38.86 ± 5.11 | 41.04 ± 3.24 | 5.6 (0.14) | 39.63 ± 6.77 | 43.57 ± 11.71 | 9.1 (0.19) | 42.10 ± 9.46 | 43.62 ± 16.42 | 3.61 (0.76) |
| aNeutrophils-Lymphocyte ratio | 1.26 ± 0.52 | 1.58 ± 0.46 | 25.3 (0.06) | 1.44± 0.30 | 1.73± 0.43 | 19.4 (0.07) | 1.53 ± 0.46 | 1.52 ± 0.33 | -0.65 (0.92) |
| aPlatelet-Lymphocyte ratio | 78.24 ± 26.47 | 106.45 ± 33.77 | 36.0 (0.01)* | 75.47 ± 12.38 | 92.75 ± 25.52 | 22.8 (0.01) | 103.46 ± 27.99 | 92.33 ± 13.21 | -10.7 (0.22) |
| Urine | |||||||||
| aSpecific gravity | 1.01 ± 0.00 | 1.03 ± 0.00 | 1.6 (<0.01)** | 1.01 ± 0.00 | 1.03 ± 0.04 | 1.4 (<0.01)** | 1.01 ± 0.00 | 1.03 ± 0.00 | 1.6 (<0.01)** |
| bpH value | 6.00 ± 0.00 | 5.30 ± 0.50 | -11.7 (<0.01)** | 6.00 ± 0.00 | 5.07 ± 0.27 | -14.9 (<0.01)** | 5.94 ± 0.02 | 5.05 3 ± 0.24 | -14.9 (<0.01)** |
Note: The values were mean ± SD, Control (n=25), Workers (n=25), a Normal distribution: P-value represents by paired student t test. b Non-normal distribution: P-value represents by Wilcoxon Rank sum test, Mean % difference b/w control and study group, *Significant at p<0.05, ** highly significant at p<0.01.
Table 2: Results of all worker groups with control for blood counts and urine composition.
Red Blood Cell counts (RBC) and Hemoglobin (HGB) level with their indices Hematocrit (HCT) and Mean Corpuscular Volume (MCV), Mean Corpuscular Hemoglobin (MCH) was significantly decreased in three age groups (I, II and III). The Platelet Lymphocyte Ratio (PLR) was also significantly increased in age group-I [16].
The significant variations were found among the RBC, HGB, MCV, MCH, PCT, MPV and NE across the age groups. Significant variations were also found in MCV and PCT in the three brands workers presented in Table 3.
| Parameters (unit) | Age group | Gasoline brands | ||||||
|---|---|---|---|---|---|---|---|---|
| Group-I (21-30 years) | Group-II (31-40 years) | Group-II (41-50 years) | P-value | PSO (workers) | SHELL (workers) | CALTAX (workers) | P-value (workers) | |
| WBC x (103/µL) | 9.06 ± 0.95 | 9.97 ± 2.15 | 10.23 ± 2.09 | 0.21 | 10.77+2.02 | 10.26+2.25 | 9.84+2.06 | 0.58 |
| NE x (103/µL) | 4.46 ± 0.78 | 5.48 ± 1.01 | 4.93 ± 0.43 | 0.00** | 5.53+1.43 | 5.64+1.07 | 4.7+1.02 | 0.13 |
| LY x (103/µL) | 2.93 ± 0.56 | 3.31 ± 0.90 | 3.37 ± 0.65 | 0.25 | 3.56+1.02 | 3.34+1.01 | 3.48+0.98 | 0.08 |
| EO x (103/µL) | 0.49 ± 0.33 | 0.72 ± 0.29 | 0.75 ± 0.33 | 0.07 | 0.53+0.29 | 0.72+0.30 | 0.75+0.37 | 0.21 |
| MO x (103/µL) | 0.43 ± 0.11 | 0.66 ± 0.63 | 0.88 ± 0.79 | 0.16 | 0.74+0.71 | 0.77+0.70 | 0.77+0.75 | 0.91 |
| BA x (103/µL) | 0.10 ± 0.03 | 0.13 ± 0.10 | 0.19 ± 0.12 | 0.06 | 0.15+0.12 | 0.15+0.11 | 0.15+0.12 | 0.98 |
| RBC x (106/µL) | 5.22 ± 0.40 | 5.13 ± 0.49 | 4.71 ± 0.28 | 0.00** | 5.06+0.69 | 5.10+0.40 | 4.84+0.52 | 0.44 |
| HGB (g/dl) | 14.80 ± 0.86 | 14.44 ± 1.56 | 13.51 ± 1.10 | 0.03* | 14.64+2.05 | 14.56+1.45 | 13.68+1.21 | 0.23 |
| HCT (%) | 44.33 ± 2.63 | 42.68 ± 5.30 | 40.11 ± 4.10 | 0.15 | 44.5+7.7 | 42.6+6.1 | 39.83+5.12 | 0.28 |
| MCV (fL) | 87.85 ± 3.14 | 83.64 ± 6.22 | 78.14 ± 6.14 | 0.00** | 86.85_6.0 | 83.03+7.33 | 79.87+5.87 | 0.04* |
| MCH (pg) | 27.39 ± 1.42 | 26.48 ± 2.61 | 25.65 ± 3.32 | 0.33 | 27.22_2.38 | 26.91+2.95 | 25.78+4.38 | 0.51 |
| MCHC (g/dl) | 32.64 ± 0.58 | 28.00 ± 4.49 | 30.86 ± 4.38 | 0.00** | 30.13+2.20 | 28.56+0.22 | 30.14+4.72 | 0.38 |
| RDW-CV (%) | 13.14 ± 1.35 | 13.59 ± 2.24 | 13.30 ± 2.20 | 0.75 | 13.66+1.4 | 13.90+2.53 | 13.30+0.81 | 0.21 |
| RDW-SD (fL) | 46.20 ± 3.28 | 44.57 ± 3.75 | 44.25 ± 2.90 | 0.29 | 46.82+3.42 | 45.15+3.7 | 43.44+3.39 | 0.08 |
| PLT x (103/µL) | 293.48 ± 31.0 | 288.50 ± 40.54 | 314.43 ± 45.04 | 0.23 | 291.80+35.35 | 279.41+40.97 | 305.54+35.57 | 0.27 |
| PCT (%) | 0.25 ± 0.04 | 0.23 ± 0.07 | 0.29 ± 0.07 | 0.02* | 0.23+0.02 | 0.23+0.03 | 0.27+0.08 | 0.03* |
| MPV (fL) | 7.89 ± 0.54 | 8.35 ± 0.84 | 8.71 ± 0.84 | 0.01* | 8.34+0.51 | 8.51+0.63 | 8.73+0.71 | 0.71 |
| PDW (%) | 17.63 ± 0.54 | 18.18 ± 0.68 | 18.05 ± 0.61 | 0.06 | 17.76+0.51 | 18.14+0.62 | 18.31+0.69 | 0.12 |
| P-LCR (%) | 41.04 ± 3.24 | 43.57 ± 11.71 | 43.62 ± 16.42 | 0.8 | 40.80+11.19 | 43.95+13.37 | 40.21+12.32 | 0.73 |
| Urine | ||||||||
| Specific gravity | 1.03 ± 0.00 | 1.03 ± 0.04 | 1.03 ± 0.00 | 0.06 | 1.02+0.004 | 1.028+0.003 | 1.02+0.002 | 0.32 |
| pH | 5.30 ± 0.50 | 5.07 ± 0.27 | 5.053 ± 0.24 | 0.8 | 5.15 ± 0.37 | 5.00 ± 0.02 | 5.05 ± 0.00 | 0.34 |
Note: The values were mean ± SD, Workers for each group (n=25), *Significant at p<0.05, ** highly significant at p<0.01.
Table 3: Comparison of blood and urine parameters across the age groups and the brands of gasoline
In the result of the urine composition, significant variation was observed in specific gravity, pH values, nitrate, protein, ketone, Urobilinogen (UGB) and bilirubin presented in Table 4.
| Group | Nitrate | Protein | Ketone | UGB | Bilirubin | |||||
|---|---|---|---|---|---|---|---|---|---|---|
| Group I (21-30 years) | ||||||||||
| N | P | N | P | N | P | N | P | N | P | |
| Control | 24 | 1 | 25 | 0 | 25 | 0 | 25 | 0 | 24 | 1 |
| Study | 4 | 21 | 13 | 12 | 14 | 11 | 7 | 18 | 3 | 22 |
| P Value | <0.01** | <0.01** | <0.01** | <0.01** | <0.01** | |||||
| Group II (31-40 years) | ||||||||||
| N | P | N | P | N | P | N | P | N | P | |
| Control | 25 | 0 | 25 | 0 | 25 | 0 | 23 | 2 | 25 | 0 |
| Study | 3 | 22 | 7 | 18 | 12 | 13 | 10 | 15 | 2 | 23 |
| P Value | <0.01** | <0.01** | <0.01** | <0.01** | <0.01** | |||||
| Group III (41-50 years) | ||||||||||
| N | P | N | P | N | P | N | P | N | P | |
| Control | 23 | 2 | 25 | 0 | 25 | 0 | 25 | 0 | 25 | 0 |
| Study | 5 | 20 | 5 | 20 | 16 | 9 | 4 | 21 | 4 | 21 |
| P Value | <0.01** | <0.01** | <0.01** | <0.01** | <0.01** | |||||
Note: Control (n=25), workers (n=25), N: Negative outcome, P: Positive outcome, *Significant, **highly significant
Table 4: Comprehensive results of nominal parameters for urine composition.
Discussion
Every day of human life, the uses of gasoline are increasing commercially, and its vapors are recognized toxic for human health [17]. Experimental studies in animals have proved evidence of cancer exposed to vapors of gasoline in various organs and tissues.
Different gasoline vapors affect the hematopoietic system and result in altered hematological parameters. Significant increase in the white blood cell counts, Eosinophils (EO) and Basophils (BA) were analyzed by Avogbe, et al., Christian, et al., D’Andrea and Reddy, et al., Dede, et al., with exposure of gasoline vapors in different duration. White blood cells take part a most significant function in phagocytosis, immunity and therefore in protection against infection. The high level in white blood cells means the body is sending more and more cells to fight off infections. Elevation of these may also observe in patients with different type of cancer leukemia and lymphomas.
Eosinophils and basophils can become increased in patients with allergic disorders asthma, certain parasitic and dermatology disorders. Eosinophils play a significant role in the inflammation related to allergic, eczema and asthma. The elevation in the blood above the normal range (more than 500 eosinophils per μl) is considered eosinophilia disease. The scores of EO more than three times of normal range may cause hypereosinophila [18].
Our findings of RBC and HGB are similar to Okro, et al., he investigated the exposure of gasoline fumes cause bone marrow hyperplasia. Concluded by some other studies are supported to our investigation in the significant reduction of RBC counts and HGB level with their indices.
The HGB level is low from normal levels is called anemia. In anemia patients, measurements of MCV allows to classify either a microcytic anemia (MCV below normal range), normocytic anemia (MCV within normal range), or macrocytice anemia (MCV above normal range). The hemoglobin levels and Hematocrit (HCT) is more than the normal range in patients with critically dehydrated lower than normal range in patients is fluid overloaded. Low quantity of iron in the blood can cause low MCH level. The lower scores of MCH also affect the skin (pale/bruise). The high value (MCH) may be the result of liver disease and an overactive thyroid gland.
The finding of the present study showed that Platelet (PLT) counts with indices PCT and MPV were observed significantly raising in all study group of gasoline workers compare to control group. This study is consistence with the pervious study which indicated that mean WBC and platelet counts were significantly increased in benzene exposed (non-smoker) attendants worked at gasoline filling stations.
The study was executed by al Jothery et al., concluded that Platelet (PLT) counts were significantly raised whereas Mean Platelet Volume (MPV) was significantly decreased in non-smoking gasoline workers.
In result of urine parameters presented in Table 4, the variation of nitrate, protein, urobilinogen, ketone and bilirubin in urine were significantly observed. However, abnormalities in these variations were highly significant in higher age group. Analysis of nitrate is done routinely to the diagnosis of bacterial cystitis. The positive nitrate shows in Urinary Tract Infection (UTI) due to the occurrence of bacteria [19]. The presence of bilirubin in urine composition can occur to buildup jaundice before clinical indication and is an early sign of liver disease. The possibility of the liver disease may be occurred in gasoline workers due to toxic vapors exposure. Urobilinogen (UGB) normally appears in the low fraction in urine. The positive results of Urobilinogen (UGB) assist to identify liver disease like hepatitis, cirrhosis and such situation related to increasing the Red Blood Cell counts (RBC) demolition in hemolytic anemia. The presence in bilirubin and UGB in urine marks to possible red blood cell fracture due oxidative stress particularly prolonging the duration of exposure to gasoline vapors [20].
In spite of that, the findings of this study revealed that exposure to gasoline fumes is associated with significant health concerns, which causes the abnormalities in hematological parameters, and alter the urine composition and also disturbed other body organ functions. Therefore it is important for workers who are exposed to gasoline fumes need to monitor frequent periodic checkups and laboratory blood functions to detect further long-term toxicities to the bone marrow, kidney and other organs. Further studies are needed to determine its long-term health effects in affected workers.
Conclusion
In conclusion abnormalities were found in blood picture and urine composition of attendants working at gasoline filling stations. The seriously affected blood parameterswere: White Blood Cell counts (WBC), Eosinophils (EO), Basophils (BA), Red Blood Cell counts (RBC), Hemoglobin level (HGB), Hematocrit (HCT), Mean Corpuscular Volume (MCV), Mean Corpuscular Hemoglobin (MCH), Platelet counts (PLT), Plateletcrit (PCT), Mean Platelet Volume (MPV). These parameters show the sensitive indicators in the early hematological changes among the workers exposed to gasoline vapors. Significant variations also found in specific gravity, PH values, nitrate, protein, urobilinogen, ketone and bilirubin. The abnormalities were elevated in higher age group (41-50 years) comparatively to other both groups. Our investigation shows the possibility of anemia and bone marrow depression dropping in the RBC, HBG and HCT. Positive nitrate in the urine composition also indicates immune depressing effects. Further studies are essential to investigate the hematotoxicity of gasoline vapors.
Ethical Clearance
The study was conducted by the approval (ref. No.M-3(13)/2018) of the institutional ethical committee of MINAR, Nishtar hospital Multan. The Institution’s ethical board administrated and monitored the whole work of the study carefully.
Acknowledgment
The authors acknowledge with thanking to enlighten the real research guidance of Dr. Khan Muhammad Sajid, Chief Scientist, MINAR, Pakistan.
Recommendations
• It is suggested that workers must be protected from exposure to
vapors by training with the equipment, wearing protective devices to
avoid the possibility of any abnormalities and clinical check may be
done on a regular basis.
• There is a serious need to check the standard quality and
specification of gasoline at public distribution points. It is also
suggested that Pakistan Standards and Control Authority (PSQCA)
may collect randomly sampling the gasoline and check analytically
specification especially carcinogenic chemical from retail outlets
and Pakistani Environment Protection Agency (EPA) may check the
ambient air quality at the gasoline stations.
Conflict of Interest
The authors declare that they have no conflict of interest.
Funding
No funding was provided directly or indirectly from any supportive organization for the present work.
References
- Aster RH, Bougie DW (2007) Drug-induced immune thrombocytopenia New England. J Med 357: 580-587.
- Avogbe PH, Ayi-Fanou L, Cachon B, Chabi N, Debende A, et al. (2011) Hematological changes among Beninese motor-bike taxi drivers exposed to benzene by urban air pollution. Afr J Environ Sci Technol 5: 464-472.
- Awodele O, Sulayman AA, Akintonwa A (2014) Evaluation of haematological, hepatic and renal functions of petroleum tanker drivers in Lagos, Nigeria African Health Sciences 14: 178-184.
[Crossref] [Google Scholar] [PubMed]
- Begum S, Rathna M (2012) Pulmonary function tests in petrol filling workers in Mysore city Pakistan. Physiol J 8: 12-14.
- Budak YU, Polat M, Huysal K (2016) The use of platelet indices, plateletcrit, mean platelet volume and platelet distribution width in emergency non-traumatic abdominal surgery: A systematic review. Biochem Med 26: 178-193.
[Crossref] [Google Scholar] [PubMed]
- Carletti R, Romano D (2002) Assessing health risk from benzene pollution in an urban area. Environ Monit Assess 80: 135-148.
[Crossref] [Google Scholar] [PubMed]
- Chidri SV, Patil S (2014) Assessment of Pulmonary function tests in petrol pump workers: A cross sectional study. Indian J Med Res 3: 507-510.
- Christian SG, Elekima I, Obisike A, Aleru CP (2016) Effect of petroleum on haematological parameters and lead level in fuel attendants in Port Harcourt, Nigeria. Int J Sci Res 5: 280-283.
- Clark VL, Kruse JA (1990) Clinical methods: The history, physical and laboratory examinations. JAMA 264: 2808-2809.
- d'Azevedo P, Tannhauser M, Tannhauser S, Barros H (1996) Hematological alterations in rats from xylene and benzene. Vet Hum Toxicol 38: 340-344.
[Google Scholar] [PubMed]
- D’Andrea MA, Reddy GK (2014) Hematological and hepatic alterations in nonsmoking residents exposed to benzene following a flaring incident at the British petroleum plant in Texas City. Environ Health 13: 115.
[Crossref] [Google Scholar] [PubMed]
- Dede E, Kagbo H (2002) A study on the acute toxicological effects of commercial diesel fuel in Nigeria in rats (Ratus ratus) using hematological parameters. J Appl SCI Environ Manag 6: 84-86.
- Ebrahemzadih M, Abadi ABF, Giahi O, Tahmasebi N (2016) Exposure assessment to Benzene, Toluene, Ethyl Benzene and Xylene (BTEX) in gas stations in central region of Iran. Asian J Water Environ Pollut 13: 43-48.
- Gallagher EJ, Schwartz E, Weinstein RS (1990) Performance characteristics of urine dipsticks stored in open containers. Am J Emerg Med 8: 121-123.
[Crossref] [Google Scholar] [PubMed]
- Gamberale F, Annwall G, Hultengren M (1978) Exposure to xylene and ethylbenzene: III. Effects on central nervous functions Scandinavian. J Work Environ Health 4: 204-211.
[Google Scholar] [PubMed]
- Hammer S et al. (1998) Procalcitonin: A new marker for diagnosis of acute rejection and bacterial infection in patients after heart and lung transplantation. Transpl Immunol 6: 235-241.
[Google Scholar] [PubMed]
- Hulke SM, Patil PM, Thakare AE, Vaidya YP (2012) Lung function test in petrol pump workers. Natl J Physiol Pharm Pharmacol 2: 71.
- Jia X, Xiao P, Jin X, Shen G, Wang X, Jin T, Nordberg G (2002) Adverse effects of gasoline on the skin of exposed workers. Contact Dermatitis 46: 44-47.
[Google Scholar] [PubMed]
- Johnson-Wimbley TD, Graham DY (2011) Diagnosis and management of iron deficiency anemia in the 21st century. Therap Adv Gastroenterol 4: 177-184.
[Google Scholar] [PubMed]
- Kannan A, Tilak V, Rai M, Gupta V (2016) Evaluation of clinical, biochemical and hematological parameters in macrocytic anemia. Int J Res Med Sci 4: 2670-2678.
Citation: Hussain S, Mehmood R, Iqbal F, Yousaf S (2024) Effect of Gasoline Fumes on Blood and Urine Parameters of Attendants (non-smokers) among Different Age-Groups and Brands (PSO, SHELL and CALTEX) of Gasoline Filling station in Multan, Pakistan. Toxicol Open Access 10: 259.
Copyright: © 2024 Hussain S, et al. This is an open-access article distributed under the terms of the Creative Commons Attribution License, which permits unrestricted use, distribution and reproduction in any medium, provided the original author and source are credited.
Share This Article
Open Access Journals
Article Usage
- Total views: 946
- [From(publication date): 0-2024 - Apr 04, 2025]
- Breakdown by view type
- HTML page views: 738
- PDF downloads: 208
