Research Article Open Access
Effect of Fertilization and Organic Manure on Water Quality Dynamics a Proximate Composition of Cyprinus carpio
Kaur S*, Masud S and Khan A
Division of Livestock Production and Management F.V.Sc. and AH, Sher-e-Kashmir University of Agriculture Sciences and Technology, Jammu and Kashmir, India
- *Corresponding Author:
- Sandeep Kaur
Division of Livestock Production
and Management F.V.Sc. and AH
Sher-e-Kashmir University of
Agriculture Sciences and Technology
Jammu and Kashmir, India
Tel: 09622187437
E-mail: drsandeepkour87@gmail.com
Received Date: December 15, 2014 Accepted Date: April 28, 2015 Published Date: May 08, 2015
Citation: Kaur S, Masud S, Khan A (2015) Effect of Fertilization and Organic Manure on Water Quality Dynamics a Proximate Composition of Cyprinus carpio. J Fisheries Livest Prod 3:133. doi:10.4172/2332-2608.1000133
Copyright: © 2015 Kaur S, et al. This is an open-access article distributed under the terms of the Creative Commons Attribution License, which permits unrestricted use, distribution, and reproduction in any medium, provided the original author and source are credited.
Visit for more related articles at Journal of Fisheries & Livestock Production
Abstract
The present study was conducted to evaluate the effect of chicken manure and inorganic fertilizer (single super phosphate and urea) on water quality (temperature, pH, dissolved oxygen, free CO2, alkalinity, total solids, nitrate and phosphate) and proximate composition (moisture, ash, crude protein, total fat and carbohydrates) of Cyprinus carpio. 210 fingerlings of C. carpio obtained from Government fish hatchery, Jammu were acclimatized for one month with conventional feed and daily water exchange. The experimental tubs were cleaned, fresh soil was spread to 5 cm height and treated with lime @ 250 kg/ha. After three days of liming, tubs were filled with water at 40cm depth. Experimental water in tubs were treated in duplicates with low (PT1) @8000 kg/ ha, medium (PT2) @10,000 kg/ha and high (PT3) @12,000 kg/ha doses of chicken manure and also with low, medium and high dose of inorganic fertilizer(urea + SSP) @104 kg/ha + 155 kg/ha (IT1), @218 kg/ha + 310 kg/ha (IT2) and 322 kg/ha +470 kg/ha (IT3) respectively, along with control. Water quality parameters were within the tolerable range for C. carpio. Level of crude protein and total fat were highest in PT2. Moisture and carbohydrate showed insignificant changes while ash content changed significantly in all the treatments and control. These observations indicate that chicken manure alone was effective to stimulate productivity with conducive range of water quality and growth of fish without affecting proximate composition of fish meat.
Keywords
Chicken manure; Inorganic fertilizer; Fish; Water quality; Proximate composition
Introduction
The rising cost of high protein fish and inorganic fertilizer, as well as the general concerns for energy conservation, has brought about increased interest in the utilization of animal manures in aquaculture and in the traditional systems which integrate animal husbandry with aquaculture. India has vast resource of livestock and poultry, which play a vital role in improving the socio-economic conditions of rural masses. Livestock wastes including animal manure and poultry byproducts which are a menace to the environment are sources of wealth creation in fish farming [1]. The livestock wastes such as cow-dung, poultry and pig excreta, goat and sheep pellets in fish culture are useful in enhancing the production of fish food organisms as well as in cutting down the expenditure on costly feeds and fertilizers. According to Moav et al. [2] judicious organic manuring of fish ponds can eliminate the need for supplementary feeding. It is well known that high fish yield can be achieved by higher abundance of plankton in culture system [3,4]. The adoption of common carp for the present experiment is more promising because it leads to higher fish production, due to its fast growth and hardy nature. Moreover it keeps nutrients in suspension due to its burrowing nature. Farmers can get double benefit in introducing the common carp in the pond as it increases the availability of nutrients for phytoplankton which in turn enhances fish production. Cyprinus carpio has the ability to survive under various climatic conditions and is found to be most suitable for many fish farming systems. In view of above the present study was undertaken to assess the effects of chicken manure and inorganic fertilizer (urea and single super phosphate) on water quality and meat quality of Cyprinus carpio.
Materials and Methods
Fish fingerlings of common carp were procured from Government fish farm, Jammu, India and were acclimatized in 1000 litre capacity tank for one month. The study was conducted in fourteen plastic tubs of 100 litre capacity. The experimental tubs were cleaned, fresh soil was spread to 5 cm height and treated with lime @ 250 kg/ha. After three days of liming, tubs were filled with water at 40 cm depth. The water in the tubs was allowed to stabilize for two days prior to fertilization.
The 60 days experiment consisted of following treatments along with control:
Control
No fertilizer was offered. The ration treatment included the daily application of conventional feed i.e. rice bran and oil cake (1:1) @ 5% body weight.
Treatment 1
Organic manure (chicken manure) was applied at three doses of low (PT1) @8000 kg/ha/yr, medium (PT2) @10000 kg/ha/yr and higher (PT3) @12000 kg/ha/yr. Half of the total quantity was applied as basal dose 15 days prior to stocking of fingerlings. The remaining amount was applied in equal splits at bimonthly intervals.
Treatment 2
Inorganic fertilizers in the form of urea (U) and single superphosphate (SSP) were also added at the three different doses low (IT1) (104 kg/ha+155 kg/ha), medium (IT2) (218 kg/ha+310 kg/ha) and high (IT3) (322 kg/ha + 470 kg/ha) in 1:1 ratio, respectively in fortnightly doses as source of nitrogen and phosphorus.
Water from each tub was tested daily for temperature and pH, bi-weekly for dissolved oxygen (DO) and free CO2 while weekly for alkalinity and total solids. All determinations were carried out according to the Standard Methods of American Public Health Association [4]. For meat quality analysis, the samples of muscle tissue were collected initially before exposure and after 60 days at the end of the experiment. The muscle tissue samples were collected on ice bed and were immediately stored at -20°C till the analysis. Data were tested by using two-way ANOVA (analysis of variance). Significance was tested at 5% level. All the statistical analysis was performed via employing Turkey descriptive statistical methods.
Results and Discussion
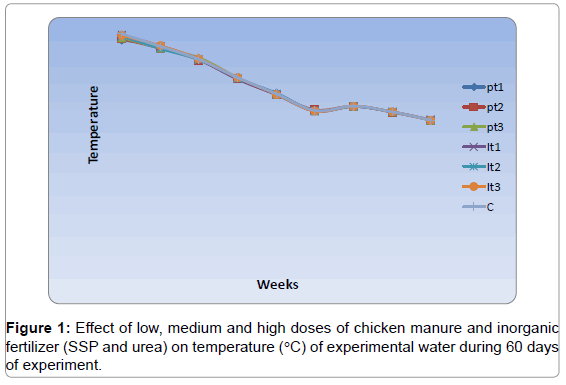
Treatment with chicken manure and inorganic fertilizers caused greater changes in water quality parameters. Water temperature inflicts prominent effects on fish life by directly or indirectly influencing the aquatic environment. Each organism has specific survival range of environmental temperature for its efficient existence and beyond these limits, conditions become lethal. Fish being a cold blooded animal is affected by the temperature of surrounding water in terms of the body temperature, growth rate, feed consumption, feed conversion and other body functions. Jhingran, [5] observed that carps thrive well in the temperature range of 18.3-37.8°C. As shown in Table 1 and Figure 1, the mean values of water temperature in all the treatments was optimal for carp rearing throughout the period of this experiment. The temperature of water decreased significantly with the progress of experiment due to decrease in the environmental temperature.
| Treatments | Duration (weeks) | ||||||||
|---|---|---|---|---|---|---|---|---|---|
| 1st | 2nd | 3rd | 4th | 5th | 6th | 7th | 8th | 9th | |
| PT1 | 18.21a | 17.60a | 16.31a | 14.46a | 13.03a | 11.31aA | 11.78a | 11.21a | 10.41a |
| PT2 | 18.31a | 17.38a | 16.24a | 14.38a | 12.88a | 11.42a | 11.78a | 11.17a | 10.41a |
| PT3 | 18.42 a | 17.42a | 16.46a | 14.53a | 12.88a | 11.31a | 11.74a | 11.21a | 10.41a |
| IT1 | 18.74a | 17.60a | 16.28a | 14.38a | 12.88a | 11.28a | 11.74a | 11.21a | 10.45a |
| IT2 | 18.57a | 17.35a | 16.28a | 14.50a | 12.99a | 11.31a | 11.74a | 11.21a | 10.41a |
| IT3 | 18.67a | 17.64a | 16.35a | 14.53a | 12.92a | 11.28a | 11.78a | 11.21a | 10.41a |
| C | 18.81a | 17.57a | 16.31a | 14.53a | 12.96a | 11.35a | 11.78a | 11.21a | 10.41a |
aMean bearing similar superscript with small alphabet in the column and capital in the row do not differ significantly with each other (Tukey HSD, P < 0.05).
Table 1: Effect of low, medium and high doses of chicken manure and inorganic fertilizer (SSP and urea) on temperature (°C) of experimental water during 60 days of experiment (Mean ± S.E).
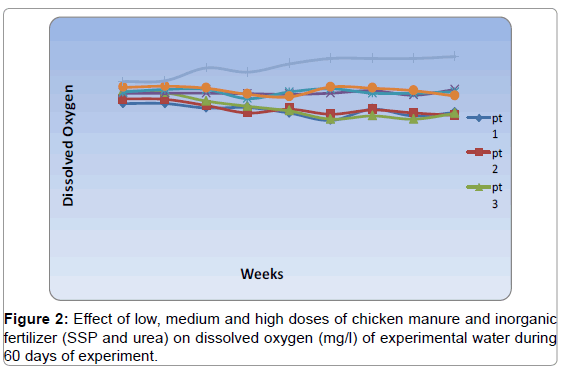
DO levels was significantly lower in chicken manure treatments and higher value was found in control. The values of DO in the present study were in desirable limit as warm water fish requires DO ≥ 5 mg/L for good growth and reproduction [6]. According to Boyd [7], oxygen concentration of less than 3.5 ppm is fatal to carps within duration of 24 hours. The results of the present study were also in agreement with findings of Garg and Bhatnagar, [8] and Bhatka et al. [9] as they observed that fertilizer dose influences the level of dissolved oxygen and increases with increasing the fertilization level up to a certain limit and then declines with higher doses. Shevgoor et al. [10] also reported that increasing level of fertilization raise all the water quality parameters in suitable range except dissolved oxygen which showed the variation at dawn by the application of high manuring rate. However, DO value in this study was in many cases less than the standard value i.e., DO ≥ 5 mg/L in poultry manure treatment (Table 2 and Figure 2). The findings of the present study clearly revealed that lower concentration of DO in organic manure treatment attributes to the deposition of organic manure and use of DO by bacteria.
| Treatments | Duration(weeks) | ||||||||
|---|---|---|---|---|---|---|---|---|---|
| 1st | 2nd | 3rd | 4th | 5th | 6th | 7th | 8th | 9th | |
| PT1 | 4.88a | 4.88a | 4.70a | 4.72a | 4.50a | 4.20a | 4.65a | 4.38a | 4.52a |
| PT2 | 5.07 | 5.05a | 4.80a | 4.50a | 4.65a | 4.45a | 4.62a | 4.50a | 4.40a |
| PT3 | 5.39a | 5.32a | 4.98a | 4.77a | 4.58a | 4.25a | 4.38a | 4.25a | 4.48a |
| IT1 | 5.30a | 5.30a | 5.30a | 5.28a | 5.25a | 5.30a | 5.40a | 5.22a | 5.45a |
| IT2 | 5.35a | 5.45a | 5.45a | 5.08a | 5.35a | 5.48a | 5.30a | 5.30a | 5.35a |
| IT3 | 5.53a | 5.58a | 5.50a | 5.25a | 5.15a | 5.55a | 5.50a | 5.40a | 5.18a |
| C | 5.77a | 5.80a | 6.32a | 6.15a | 6.48a | 6.70a | 6.70a | 6.70a | 6.78a |
a Mean bearing similar superscript with small alphabet in the column and capital in the row do not differ significantly with each other (Tukey HSD, P<0.05).
Table 2: Effect of low, medium and high doses of chicken manure and inorganic fertilizer (SSP and urea) on dissolved oxygen (mg/l) of experimental water during 60 days of experiment (Mean ± S.E).
The pH during the experiment ranged between 8.61 ± 0.00 to 9.09 ± 0.01 in different treatments including control and it was also observed that pH was in higher limit in inorganic fertilizer (Table 3 and Figure 3). According to Boyd et al. [7], optimum pH for growth and health of most fresh water fish is in range of 6.5 to 9. The suboptimal pH can cause stress, increased susceptibility to disease and poor growth in fish. The findings were also in agreement with Sahu et al. [11] who reported that pH was found to be higher under the influence of fertilization but the dissolved oxygen remained low by the application of organic and inorganic fertilization alone or in combination of both. Qin et al. [12] also observed that inorganic fertilizer enhance the primary productivity, dissolved oxygen, pH than organic fertilization.
| Treatments | Duration (weeks) | ||||||||
|---|---|---|---|---|---|---|---|---|---|
| 1st | 2nd | 3rd | 4th | 5th | 6th | 7th | 8th | 9th | |
| PT1 | 9.00a | 8.9a | 8.74a | 8.71a | 8.79a | 8.75a | 8.8a | 8.8a | 8.68a |
| PT2 | 9.02a | 8.92a | 8.77a | 8.71a | 8.72a | 8.74a | 8.78a | 8.8a | 8.77a |
| PT3 | 8.95a | 8.91a | 8.70a | 8.65a | 8.77a | 8.79a | 8.81a | 8.81a | 8.77a |
| IT1 | 9.03a | 8.95a | 8.75a | 8.76a | 8.77a | 8.69a | 8.81a | 8.77a | 8.77a |
| IT2 | 9.09a | 9.00a | 8.78a | 8.78a | 8.83a | 8.73a | 8.79a | 8.78a | 8.75a |
| IT3 | 9.03a | 8.93a | 8.78a | 8.72a | 8.76a | 8.71a | 8.80a | 8.79a | 8.79a |
| C | 9.06a | 8.87a | 8.61a | 8.61a | 8.84a | 8.58a | 8.77a | 8.74a | 8.79a |
aMean bearing similar superscript with small alphabet in the column and capital in the row do not differ significantly with each other (Tukey HSD, P < 0.05).
Table 3: Effect of low, medium and high doses of chicken manure and inorganic fertilizer (SSP and urea) on temperature (°C) of experimental water during 60 days of experiment (Mean ± S.E).
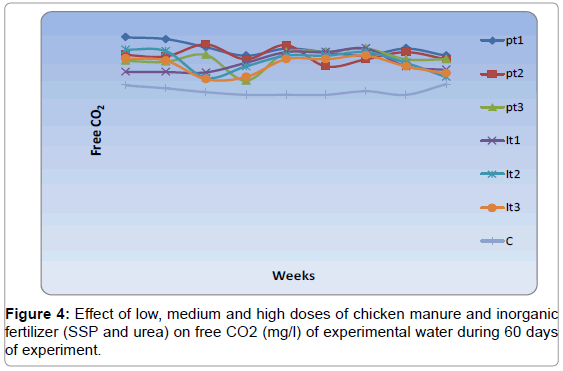
As depicted in Table 4 and Figure 4, the results of the present study revealed that the level of free CO2 was within the desirable limit and it is also depicted that different magnitude of manure significantly influencing the free CO2level during experimental period of 60 days which in long term with the extent of exposure to higher level of manure may have cumulative effect on water qualities. Ekubu and Abowei [13] reported that tropical fishes can tolerate CO2 levels over 100 mg/L but the ideal level of CO2 in fishponds is less than 10 mg/L. The finding of present study were in agreement with Das et al. [14] who investigated the change in water parameter after application of different doses of cowdung, poultry manure, feed mixture and inorganic fertilizer and reported that organic and inorganic fertilization caused significant reduction in dissolved oxygen and increase in free CO2. Low level of CO2 in control may be due to absence or low level of organic load.
| Treatments | Duration(weeks) | ||||||||
|---|---|---|---|---|---|---|---|---|---|
| 1st | 2nd | 3rd | 4th | 5th | 6th | 7th | 8th | 9th | |
| PT1 | 14.04a | 13.92a | 13.35a | 12.75a | 13.25a | 13.00a | 12.75a | 13.25a | 12.75a |
| PT2 | 12.80a | 12.70a | 13.55a | 12.50a | 13.50a | 12.00a | 12.50a | 13.00a | 12.50a |
| PT3 | 12.39a | 12.32a | 12.80a | 11.00a | 13.00a | 13.00a | 13.25a | 12.50a | 12.50a |
| IT1 | 11.60a | 11.60a | 11.58a | 12.25a | 12.75a | 13.00a | 13.25a | 12.00a | 11.75a |
| IT2 | 13.18a | 13.07a | 11.20a | 12.00a | 12.25a | 12.75a | 13.00a | 12.25a | 11.25a |
| IT3 | 12.55a | 12.40a | 11.10a | 11.25a | 13.00a | 12.50a | 12.75a | 12.00a | 11.50a |
| C | 10.66a | 10.45a | 10.18a | 10.00a | 10.75a | 10.00a | 10.25a | 10.00a | 10.75a |
aMean bearing similar superscript with small alphabet in the column and capital in the row do not differ significantly with each other (Tukey HSD, P<0.05).
Table 4: Effect of low, medium and high doses of chicken manure and inorganic fertilizer (SSP and urea) on free CO2 (mg/l) of experimental water during 60 days of experiment (Mean ± S.E).
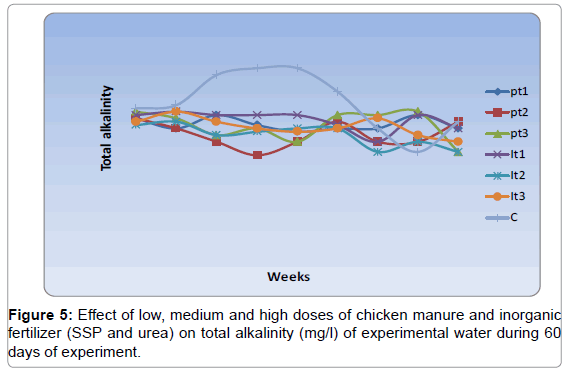
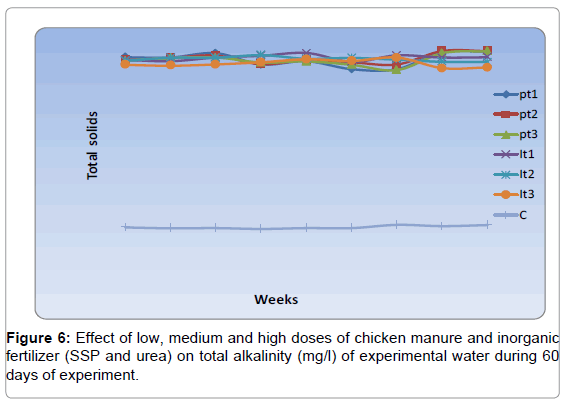
The present study revealed that the total alkalinity ranged between 171.00 ± 1.00 to 184.00 ± 2.00 in all the treatments during 60 days of experiment (Table 5 and Figure 5). It was within the suitable range for fish production. Alkalinity was relatively stable throughout the experimental period with narrow fluctuations in control. During the investigation, total solids showed higher value in the poultry treatments (PT1, PT2 and PT3) and minimum in control (C) (Table 6 and Figure 6). Similarly, the results showed that the value of total solids were much higher in treatment tubs than control tubs. Boyd et al. [7] stated that total alkalinity is an important environmental variable in aquatic ecosystem because it interacts with other variables that affected the health of aquatic animals or the fertility of ecosystem. Boyd and Lichtkoppler [15] suggested that water with total alkalinities of 20 to 150 mg/l contains suitable quantities of carbon dioxide to permit plankton production for fish culture. According to Wurts and Durborow [16], alkalinity between 75 to 200 mg/L, but not less than 20 mg/L is ideal in an aquaculture pond. According to Santhosh and Singh [17] the ideal value for fish culture is 50-300 mg/L.
| Treatments | Duration(weeks) | ||||||||
|---|---|---|---|---|---|---|---|---|---|
| 1st | 2nd | 3rd | 4th | 5th | 6th | 7th | 8th | 9th | |
| PT1 | 176.50a | 175.00a | 177.00a | 175.50aA | 174.50a | 175.00a | 175.00a | 177.00a | 178.50a |
| PT2 | 176.50a | 175.00a | 173.00a | 171.00a | 173.00a | 176.00a | 173.00a | 173.00a | 178.00a |
| PT3 | 177.500a | 176.50a | 174.00a | 175.00a | 173.00a | 177.0a | 177.00a | 177.50a | 184.50a |
| IT1 | 177.00a | 177.50a | 177.00a | 177.00a | 177.00a | 175.50a | 173.00a | 177.00a | 175.00a |
| IT2 | 175.50a | 176.00a | 174.00a | 174.50a | 175.00a | 175.00a | 171.50a | 173.00a | 171.50a |
| IT3 | 176.00a | 177.50a | 176.00a | 175.00a | 174.50a | 175.00a | 176.50a | 174.00a | 173.00a |
| C | 178.00a | 178.50a | 183.00a | 184.00a | 184.0a | 180.50a | 175.00a | 171.50a | 176.00a |
aMean bearing similar superscript with small alphabet in the column and capital alphabet in the row do not differ significantly with each other (Tukey HSD,P<0.05).
Table 5: Effect of low, medium and high doses of chicken manure and inorganic fertilizer (SSP and urea) on total alkalinity (mg/l) of experimental water during 60 days of experiment (Mean ± S.E).
| Treatments | Duration(weeks) | ||||||||
|---|---|---|---|---|---|---|---|---|---|
| 1st | 2nd | 3rd | 4th | 5th | 6th | 7th | 8th | 9th | |
| PT1 | 453.50a | 453.00a | 463.00a | 437.00a | 444.50a | 426.00a | 426.00a | 466.00a | 466.00a |
| PT2 | 447.00a | 452.00a | 457.50a | 437.50a | 447.00a | 442.00a | 437.00a | 468.00a | 468.00a |
| PT3 | 445.50a | 451.50a | 453.00a | 441.50a | 444.00a | 436.00a | 424.00a | 463.00a | 467.50a |
| IT1 | 447.50a | 444.50a | 453.00a | 457.00a | 463.50a | 443.00a | 458.00a | 453.00a | 453.50a |
| IT2 | 444.50a | 452.50a | 452.50a | 458.50a | 450.00a | 452.00a | 448.00a | 443.00a | 442.50a |
| IT3 | 436.00a | 434.00a | 437.00a | 442.00a | 449.00a | 445.00a | 453.00a | 428.50a | 430.00a |
| C | 60.00a | 58.00a | 58.50a | 56.50a | 58.50a | 58.50a | 66.00a | 63.00a | 65.5a |
aMean bearing similar superscript with small alphabet in the column and capital alphabet in the column do not differ significantly with each other (Tukey HSD, P<0.05).
Table 6: Effect of low, medium and high doses of chicken manure and inorganic fertilizer (SSP and urea) on total solids (mg/l) of experimental water during 60 days of experiment (Mean ± S.E).
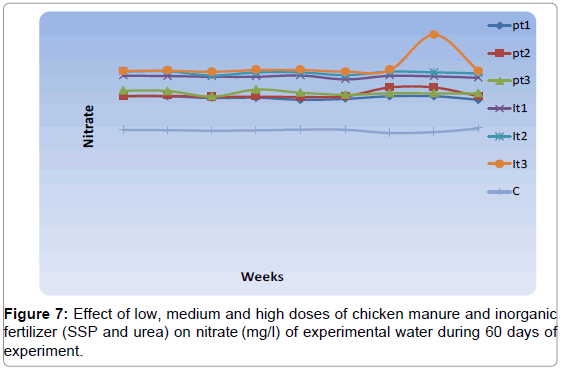
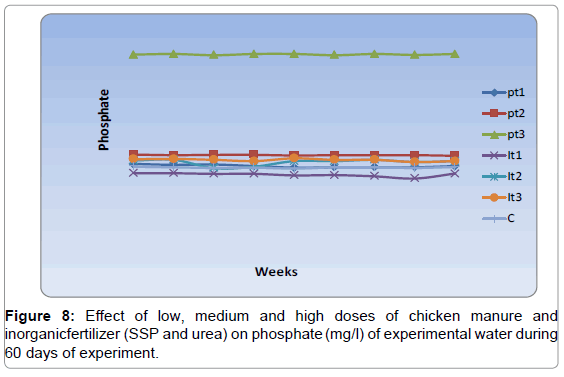
As shown in Figure 7, the value of nitrate was within the safe limit and favourable for productivity with higher value in all the inorganic treatments while control without any nutrient input in the form of organic as well as inorganic showed lowest value. Boyd [15] reported that fertilizers prove to be an efficient source of nitrate, which are recognized as soil oxidants. Tape and Boyd [18] also reported that the nitrate from the chemical fertilizer are the main source of nitrogen for the pond due to the stability of oxygen demand and act as a oxidising agent in pond sediments. Meck [19] recommended that its concentrations from 0 to 200 ppm are acceptable in a fish pond and is generally less toxic for some species whereas especially the marine species are sensitive to its presence. According to Stone and Thomforde [20], nitrate is relatively non toxic to fish and do not cause any health hazard except at exceedingly high levels (above 90 mg/l). Santhosh and Singh [17] described the favourable range of 0.1 mg/L to 4.0 mg/L in fish culture water. As shown in Figure 8, phosphate concentration was highest in PT3 (0.098 ± 0.001) at the end of the experiment while was having lowest concentration in the control. Burns and Stickney [21] also found increase in the levels of nitrate and phosphate with increasing the number of hens raised on fish ponds. It is an essential plant nutrient as it is often in limited supply and stimulates plant (algae) growth and its role for increasing the aquatic productivity is well recognized. According to Stone and Thomforde [20] the phosphate level of 0.06 mg/l is desirable for fish culture. Bhatnagar et al. [22] suggested 0.05- 0.07 ppm is optimum and productive; 1.0 ppm is good for plankton.
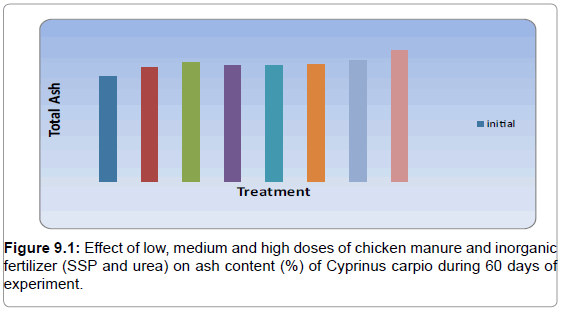
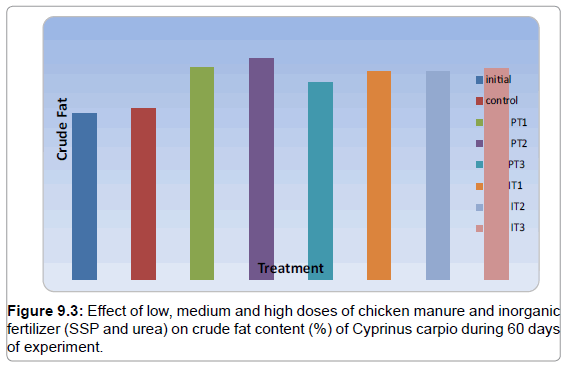
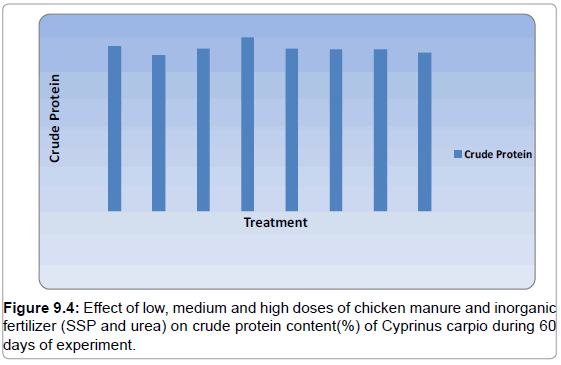
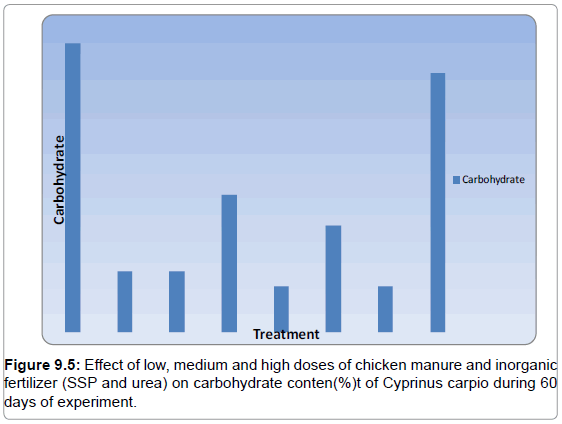
At the end of the experiment, meat samples of exposed as well as control fish were collected for proximate composition to study the influence of organic manure and inorganic fertilizer on the meat quality. Figures 9.1-9.5 respectively shows the proximate composition of C. carpio at initial and at the end of the experiment i.e. 60 days. Proximate analysis of fish meat revealed that chicken manure and inorganic fertilizer changed the level of crude protein and fat in treated fish under different treatments, crude protein and fat both being lowest in control and highest in PT2 treatment. However, there was no significant difference in moisture level among the treatments and control. This is indicative of protein accretion and true growth involving an increase in the structural tissue such as muscle [23]. The type of feed ingested and their nutritional quality is known to be one of the main factors affecting fish meat composition [24]. Under the six treatments, PT1 came up with the best treatment containing maximum protein and total fat. However, both the protein and fat content of control fish were lower than all the treatments because of slow growth under this treatment and a long period of restricted food supply because of its omnivorous feeding habit as C. carpio not completely depends on supplementary feed. Zeitler et al. [25] considered not only the protein content but also the fat in fish meat as a parameter to evaluate the fish meat quality and also reported that total fat and protein content of C carpio showed direct dependence on quantity and quality of food supplied. Moav et al. [2] reported good flesh color and intramuscular fat levels for fish grown in intensively manured ponds. Ash content was significantly changed in both control as well as different treatment in comparison to initial values attributed to higher level of fiber in poultry manure and planktons. A non- significant decline was observed in carbohydrate content in control and treatment in comparison to initial value.
Acknowledgements
The authors are deeply thankful to the Dean, Sher-e-Kashmir University of Agricultural Sciences and Technology, Jammu and Head, Department of Livestock Production and Management for providing facilities for carrying out the present investigation.
References
- Adewumi AA, Adewumi IK, Olaleye VF (2011) Livestock waste menance: fish wealth solutions. African Journal of Environmental Science and Technology 5: 149-154.
- Moav R, Wohlfarth G, Schroeder GL, Hulata G, Barash H (1977) Intensive polyculture of fish in freshwater ponds. Substitution of expensive feeds by liquid cow manure. Aquaculture. 10: 25–43.
- Jha P, Sarkar K, Barat S (2004) Effect of different application rates of cowdung and poultry excreta on water quality and growth of ornamental carp, Cyprinuscarpiovr. koi, in concrete tanks. Turkish Journal of Fisheries and Aquatic Science. 4 : 17- 22.
- American Public Health Association (1998) Standard methods for the examination of water and waste water, Washington, D.C.
- Jhingaran VG (1982) Fish and fisheries of India. Hindustan Publishing Cooperation, Delhi, India.
- Swingle HS (1969) Methods of analysis for waters, organic matter and pond bottom soils used in fisheries research. Auburn University, Auburn.
- Boyd CE (1998) Water quality for pond aquaculture. Research and development series 43: 37. International Center for Aquaculture and Aquatic Environments. Alabama Agriculture Experiment Station.
- Garg SK, Bhatnagar A (1999) Effect of different doses of organic fertilizer (cow dung) on pond productivity and fish biomass in stillwater ponds. J. Appl.Ichthyol. 15: 10-18.
- Bhakta JN, Bandyopadhyay PK, Jana BB (2006) Effect of different doses of mixed fertilizer on some biogeochemical cycling bacterial population in carp culture pond. Turkish. Journal of Fish and Aquaculture Science. 6: 165-171.
- Shevgoor L, Knud-Hansen CF, Edwards P (1994) An assessment of the role of buffalo manure for pond culture of tilapia. III. Limiting factors. Aquaculture. 126: 107-108.
- Sahu PK, Jena JK, Das PC, Mondal S, Das R (2007) Production performance of Labeocalbasu(Hamilton) in polyculture with three Indian major carps Catlacatla(Hamilton), Labeorohita(Hamilton) and Cirrhinusmrigala(Hamilton) with provisions of fertilizers, feed and periphytic substrate as varied inputs. Aquaculture. 262: 333-339.
- Qin J, Culver DA, Yu N (1995) Effect of organic fertilizer on heterotrophs and autotrophs, implication for water quality management. Aquaculture Resources. 26:911-920.
- Ekubo AA, Abowei JFN (2011) Review of some water quality management principles in culture fisheries. Research Journal of Applied Sciences, Engineering and Technology.3: 1342-1357.
- Das PC, Ayyappan S, Jena J (2005) Comparative changes in water quality and role of pond soil after application of different levels of organic and inorganic inputs. Aquaculture. Resource. 1-14
- Boyd CE, Lichtkoppler F (1979) Water Quality Management in Fish Ponds. Research and Development Series No. 22: 45-47
- Wurts WA, Durborow RM (1992) Interactions of pH, Carbon Dioxide, Alkalinity and Hardness in Fish Ponds Southern Regional Aquaculture Center, SRAC Publication No. 464.
- Santhosh B, Singh NP (2007) Guidelines for water quality management for fish culture in Tripura, ICAR Research Complex for NEH Region, Tripura Center, Publication no.29
- Tepe Y, Boyd CE (2001) A sodium-nitrate based water soluble, granular fertilizer for sport fish ponds. N. Am. J. Aquacult. 63: 328-332.
- MeckN (1996) Pond water chemistry, San Diego, Koi Club.
- Stone NM, Thomforde HK (2004) Understanding Your Fish Pond Water Analysis Report. Cooperative Extension Program, University of Arkansas at Pine Bluff Aquaculture/ Fisheries.
- Burns RP, Stickney RR (1980) Growth of Tilapia aureain ponds receiving poultry wastes. Aquaculture, 20: 117–121.
- Bhatnagar A, Jana SN, Garg SK, Patra BC, Singh G et al (2004) Water quality management in aquaculture, In: Course Manual of summer school on development of sustainable aquaculture technology in fresh and saline waters, CCS Haryana Agricultural, Hisar India.
- Fafioye OO, Fagade SO, Adebisi AA, Jenyo-Oni, Omoyinmi GAK (2005) Effects of dietary soybeans (Glycine max (L.) Merr.) on growth and body composition of African catfish (Clariasgariepinus, Burchell) fingerlings. Turkish Journal of Fisheries and Aquatic Science. 5: 11-15.
- Reinitz G, Hitzel F (1980) Formulation of practical diets for rainbow trout based on desired performance and body composition. Aquaculture. 19: 243-252.
- Zeitler MH, Kirchgessner M, Schwarz FJ (1984) Effects of different protein and energy supplies on carcass composition of carp (Cyprinuscarpio L) Aquaculture, 36: 37-48.
Relevant Topics
- Acoustic Survey
- Animal Husbandry
- Aquaculture Developement
- Bioacoustics
- Biological Diversity
- Dropline
- Fisheries
- Fisheries Management
- Fishing Vessel
- Gillnet
- Jigging
- Livestock Nutrition
- Livestock Production
- Marine
- Marine Fish
- Maritime Policy
- Pelagic Fish
- Poultry
- Sustainable fishery
- Sustainable Fishing
- Trawling
Recommended Journals
Article Tools
Article Usage
- Total views: 18665
- [From(publication date):
September-2015 - Mar 29, 2025] - Breakdown by view type
- HTML page views : 13603
- PDF downloads : 5062
