Effect of common bunt infection on agronomic traits in wheat (Triticum aestivum L.)
Received: 06-Dec-2017 / Accepted Date: 01-Jan-2018 / Published Date: 15-Jan-2018
Abstract
Common bunt (Caused by Tilletia caries and T. foetida) can greatly reduce wheat grain yield in susceptible cultivars when no fungicidal seed treatments were used. Planting resistance cultivars is beneficial, especially for lowincome farmers who cannot afford seed treatments. In this paper, a set of nine spring genotypes and two winter wheat genotypes were planted in the greenhouse under two common bunt treatments, control and inoculated, to identify the effect of common bunt infection on agronomic traits with the hope of identifying resistance characteristics before plant maturity. Common bunt infection was found to increase the seedling vigour, delay heading, increase head length, increase root length and decrease the biological yield in the susceptible genotypes. The response of the resistant and susceptible genotypes to the common bunt infection was the same for all the studied traits except for the root length. The resistant genotypes were found to have longer roots under common bunt infection than the control. However, the susceptible genotypes did not reveal this response.
Introduction
Common bunt (CB) caused by Tilletia caries (D.C.) Tul . (=T. tritici ) and T. foetida (Wallr.) Liro (=T. laevis ) can cause severe wheat grain yield losses. It decreases grain yield and quality as the bunt balls replace the grain with brown to black unpleasant smelling spores [1]. Kernels infected by this pathogen are usually rejected by millers as very low infection rates can result in noticeable odours in flour milled from CB-infected wheat. Common bunt can be effectively managed with fungicidal seed treatments. However, fungicidal seed treatments are not used widely due to cost in low input agriculture or in the organic fields due to its requirements. In addition, the fungal pathogen can produce new fungicide-resistance races. For economical and production reasons, it is useful to produce resistant cultivars through breeding programs rather than relying on fungicides [2,3].
Estimating the level of CB resistance is time consuming due to the need to wait until the symptoms are expressed. Symptoms happen when the grain filling period is nearly complete (Feekes 11.3 and 11.4). The symptoms sometimes are only expressed on the last spikes formed, and the symptoms often are only expressed in a few of the florets [1]. So, understanding the effect of the CB on earlier agronomic traits would help in identifying the trait associated with the resistance and hence the ability to select resistant genotypes earlier rather than waiting until plant maturity. For example, it was reported that CB has an effect on plant height, number of heads and root length [1,4]. In addition, understanding the differential response of the resistant and susceptible genotypes to the CB infection would help farmers recognize the resistant genotype at an earlier developing stage and possibly allow them to remove the susceptible genotype before it produces new spores. This technique will help low input farmer reduce the spread of the CB spores and decrease the number of infected plants in the following season.
The objectives of this study was to (1) screen nine Egyptian and two Nebraska wheat genotypes to Nebraska CB race (2) study the effect of CB infection on some easily measured agronomic traits in a set of nine Egyptian spring genotypes, and (3) screen resistant and susceptible genotypes to see if there are differences in the response of the agronomic traits to the infection in order to determine if we can use an agronomic trait as an indicator for the level of resistance.
Materials and Methods
Plant materials
A set of nine Egyptian bread spring wheat cultivars from diverse backgrounds were used to study the effect of CB on some important agronomic traits (Table 1). The tested cultivars had never been tested to Nebraska CB race, hence their reaction to this pathotype was unknown, but was expected to be susceptible. Because of this concern, two Nebraska winter wheat lines that were known to be very resistant to CB (with infected heads 0%, preliminary data) were included in order to be able to identify if there are differences between the response of resistant and susceptible genotypes to CB inoculation. A spring susceptible check (“Red Bob”) was included to confirm the effectiveness of the CB inoculation protocol.
| Genotype | Year of release | Origin | Pedigree |
|---|---|---|---|
| Sakha93 | 1999 | Cross made in the country, one CIMMYT parent | SAKHA 92/TR 810328 |
| Gemiza10 | 2004 | No Info | No Info |
| Gemiza11 | No Info | No Info | BOW"S"/ KVS"S"// 7C/ SERI 82/3/ GIZA 168/ SAKHA 61 |
| Misr1 | 2010 | Advanced line from CIMMYT | OASIS/SKAUZ//4*BCN/3/2*PASTOR |
| Misr2 | 2011 | Advanced line from CIMMYT | SKAUZ/BAV 92 |
| Sakha 94 | 2004 | No Info | OPATA/RAYON/3/JUP/BJY//URES |
| Sids12 | 2008 | No Info | |
| Sids13 | No Info | No Info | ALMAZ.19=KAUZ"S"// TSI/ SNB"S" |
| Giza168 | 1999 | Advanced line from CIMMYT | MIL/BUC//SERI |
Table 1: List of the Egyptian cultivars included in the study of the effect of common bunt inoculation.
Planting and experimental design
The tested genotypes were planted in the greenhouse with two treatments, control and CB inoculation, in three replications each. Four plants were planted in each pot. The inoculation was done using the method of Goates (1996) by mixing the kernels with the teliospores, putting them in an envelope and shaking until the kernels were fully covered with the spores. This method was reported as an effective method to inoculate small amount of seeds, from five to twenty grams. The experimental design was randomized complete block design (RCBD, 3 replications × 2 treatments × 11 genotypes). All the three replications were placed in the vernalizer for two months at 4°C to provide optimal conditions for the T. caries and T. foetida spores to infect the seedling plants and high levels of infection to occur. After two months, the plants were transferred to a warmer house (at 16 [night] - 25ºC [day]) to provide good environmental conditions for wheat plant development. The genotypes were fertilized as recommended.
Measuring of the studied traits
For each control and inoculated genotype, the following traits were recorded
Seedling vigour
This trait was visually recorded using a scale extending from 1 (weak seedling) to 9 (strong seedling) at seedling stage.
Days to heading
This trait was scored by recording the date from seeding to when 50% of the tillers in each pot were at 10.1 Feekes scales and had heads fully emerged from the boot.
Chlorophyll content in the flag leaf (Feekes stage 10.5)
Chlorophyll content of each genotype has been recorded using SPAD-502 created by KONICA MINOLTA, New York, USA after heading [5]. For each genotype, the average of the chlorophyll content in five leaves in each replication was recorded.
Plant height
The plant height was measured during ripening stage (Feekes stage 11) as the height of the plant from the ground to the tip of the head, awns excluded.
Head length (cm)
The length of the head was measured from the base of the head to the tip (awns excluded) after the plants completely emerged and no further growth was expected (Feekes stage 10.5).
Days to maturity
This was measured as the number of days from planting until 50% of the plants had completely mature heads (colour changed from green to tan).
Number of tillers/plant
This trait was measured by counting all the tillers with spikes in the pot and dividing by the number of plants in the pot.
Biological yield
This trait was measured on mature plants that had not been watered for seven days as the average weight of the whole plants (including roots) after the soil was carefully washed from the roots and dried.
Root length
This trait was measured as the average length of the main root in all the plants/ pot.
Common bunt resistance
Common bunt resistance was scored on each genotype as follow
CB = Number of infected heads/ total number of heads per genotype × 100
The level of resistance was determined using the following scale:
Percentage of infected heads 0.0% = Very resistant, 0.1–5.0% = Resistant, 5.1–10.0% =moderately resistant, 10.1–30.0% = moderately susceptible, 30.1–50.0% = susceptible,
50.1–100.0% = very susceptible [6]. Data of the different traits were collected using field book Android application [7].
Statistical analyses
Data from both control and inoculated plants for the nine spring genotypes were combined and analysed using PLABSTAT software using the following model.
Yijk = μ + rj + tk + gi + tgik + tgrijk + eijk
Where Yijk is an observation of genotype i in replication j under treatment k, μ is the general mean; gi, rj, tk are the main effects of genotypes, replications, and treatment, respectively; eijk is the error.
Broad-sense heritability was calculated for all studied traits for the nine Egyptian lines using PLABSTAT software [8] using the following formula
where σ2G and σ2R are the variance of the lines and the residuals and r is the number of replicates.
Results and Discussion
Evaluation of the CB resistance
The spring susceptible check, Red Bob, had a high level of susceptibility to CB with 64% infected heads (Figure 1). This high level of infection in the susceptible check confirmed that the CB infection was successful. Goates (1996) reported that CB resistance evaluation should be considered valid when a susceptible check had more than 50% infected heads. For the tested genotypes, the spring wheat genotypes had a high level of infected heads that ranged from 38% (Misr2) to 93% (Misr1) and could be classified as susceptible (two genotypes; Misr2 and Sakha94) and very susceptible (seven genotypes; Gemiza10, Gemiza11, Giza168, Misr1, Sakha93, Sids12 and Sids13) to CB which confirmed our assumption that these genotypes are susceptible to the Nebraska common race of CB. The two resistance winter genotypes, NE14617 and NE15681, had different degrees of resistance that ranged from very resistant with 0% infected heads in NE14617 to resistant with 4.71% infected heads in NE15681. That the two previously resistant lines identified in the field were also resistant in the greenhouse assay indicated that the assay could separate resistant lines from susceptible lines (e.g. Red Bob).
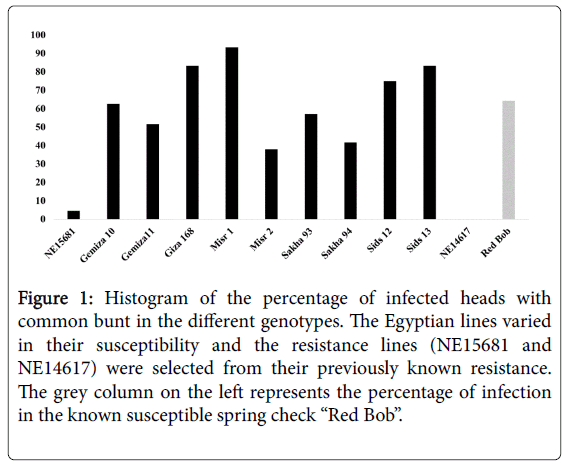
Figure 1: Histogram of the percentage of infected heads with common bunt in the different genotypes. The Egyptian lines varied in their susceptibility and the resistance lines (NE15681 and NE14617) were selected from their previously known resistance. The grey column on the left represents the percentage of infection in the known susceptible spring check “Red Bob”.
Effect of common bunt infection on agronomic traits
Table 2 represents the analysis of variance results for the different studied traits for the Egyptian spring wheat cultivars. Highly significant differences were found between the control and the inoculated plants for the seedling vigour, heading date, head length, days to maturity, root length and biological yield. In addition, significant differences were found between the two treatments for plant height. On the other hand, no significant differences were found between the two treatments for chlorophyll content and the number of tillers/plant which indicated that the CB disease did not affect these two traits in the tested genotypes. The spring genotypes had highly significant or significant differences for all the studied traits except for seedling vigour, days to maturity and root length. No significant interactions between the genotypes and the treatment were found for all the traits except days to maturity and root length.
| Seedling vigor | Chlorophyll content | Heading date | Head length | Plant height | ||||||
|---|---|---|---|---|---|---|---|---|---|---|
| d.f. | M.S. | d.f. | M.S. | d.f. | M.S. | d.f. | M.S. | d.f. | M.S. | |
| Replication (R) | 2 | 12.24** | 2 | 0.69 | 2 | 8.07 | 2 | 0.12 | 2 | 2.17 |
| Treatment (T) | 1 | 384** | 1 | 9.71 | 1 | 71.19** | 1 | 5.28** | 1 | 39.19* |
| Genotype (G) | 8 | 2.38 | 8 | 48.39* | 8 | 30.37* | 8 | 1.98** | 8 | 29.50* |
| GxT | 8 | 1.08 | 8 | 11.12 | 8 | 7.31 | 8 | 0.28 | 8 | 6.23 |
| error | 34 | 1.08 | 34 | 6.16 | 34 | 8.62 | 34 | 0.63 | 34 | 6.64 |
| H2B | 0.54 | 0.77 | 0.76 | 0.86 | 0.79 | |||||
| Days to maturity | Number of tillers/plant | Root length | Biological yield | Common bunt infected heads* | ||||||
| d.f. | M.S. | d.f. | M.S. | d.f. | M.S. | d.f. | M.S. | d.f. | M.S. | |
| Replication (R) | 2 | 0.52 | 2 | 0.74 | 2 | 10.35 | 2 | 1.60 | 2 | 797.32 |
| Treatment (T) | 1 | 271.13** | 1 | 1.82 | 1 | 366.86** | 1 | 619.29** | - | - |
| Genotype (G) | 8 | 194.14 | 8 | 2.37** | 8 | 106.13 | 8 | 197.88* | 10 | 3195** |
| GxT | 8 | 61.25** | 8 | 0.27 | 8 | 36.67** | 8 | 67.02 | - | - |
| error | 34 | 19.52 | 34 | 0.66 | 34 | 12.50 | 34 | 81.79 | - | - |
| GxR* | - | - | - | - | - | - | - | - | 20 | 449.28 |
| H2B | 0.68 | 0.89 | 0.40 | 0.78 | 0.86 | |||||
*Significant differences at p<0.05
**highly significant differences at p<0.01
#This trait was measured only for the inoculated plants
Table 2: Analysis of variance for seedling vigour, chlorophyll content, heading date, head height, plant height, days to maturity, number of tillers/ plant, root length, biological yield and common bunt infected heads for plants grown in the greenhouse after a cold treatment.
Seedling vigour
Comparing seedling vigour for the control and inoculated treatments, all the genotypes had more vigorous seedlings after CB infection (Table 3). The seedling vigour in the control treatment ranged from 1.00 to 2.67 with an average of 2.00, while it ranged from 6.50 to 9.00 with an average of 8.00 for the inoculated genotypes (Figure 2). All the genotypes had the same interaction with the CB infection as all of them had higher vigour under inoculated conditions than the control. The more vigorous seedlings under CB infection may be explained by the effect of the fungus on cell division. Previous research suggested that IAA and cytokinin levels increased during early fungus development on wheat callus tissues [9].
| Experiment | Seedling vigor | Chlorophyll content | Heading date | Head length (cm) | Plant height (cm) | Days to maturity | Number of tillers/plant | Root length (cm) | Biological yield | |
|---|---|---|---|---|---|---|---|---|---|---|
| Gemiza10 | Control | 2.00 | 47.57 | 65.67 | 6.35 | 24.00 | 152.67 | 3.38 | 22.33 | 34.37 |
| Inoculated | 7.50 | 48.33 | 69.33 | 6.86 | 24.67 | 152.33 | 2.89 | 23.33 | 25.03 | |
| Differences | -5.50 | -0.76 | -3.66 | -0.51 | -0.67 | 0.34 | 0.49 | -1.00 | 9.34 | |
| Gemiza11 | Control | 1.33 | 47.17 | 67.33 | 7.41 | 27.50 | 155.33 | 2.33 | 13.33 | 20.23 |
| Inoculated | 7.50 | 47.97 | 68.67 | 8.47 | 28.50 | 162.43 | 2.44 | 23.67 | 18.30 | |
| Differences | -6.17 | -0.80 | -1.34 | -1.06 | -1.00 | -7.10 | -0.11 | -10.34 | 1.93 | |
| Giza 168 | Control | 2.00 | 45.40 | 66.33 | 6.77 | 24.50 | 156.33 | 2.86 | 20.00 | 22.47 |
| Inoculated | 6.50 | 44.47 | 69.00 | 7.83 | 27.33 | 161.67 | 2.08 | 18.00 | 19.95 | |
| Differences | -4.50 | 0.93 | -2.67 | -1.06 | -2.83 | -5.34 | 0.78 | 2.00 | 2.52 | |
| Misr 1 | Control | 1.00 | 48.60 | 67.67 | 6.14 | 21.67 | 153.00 | 2.92 | 19.17 | 26.77 |
| Inoculated | 8.00 | 44.67 | 65.67 | 6.35 | 23.92 | 150.67 | 2.22 | 14.67 | 11.70 | |
| Differences | -7.00 | 3.93 | 2.00 | -0.21 | -2.25 | 2.33 | 0.70 | 4.50 | 15.07 | |
| Misr 2 | Control | 2.00 | 46.83 | 68.00 | 6.35 | 26.67 | 152.67 | 3.33 | 20.67 | 36.80 |
| Inoculated | 8.33 | 42.37 | 70.67 | 6.77 | 27.67 | 156.00 | 2.58 | 20.33 | 29.03 | |
| Differences | -6.33 | 4.46 | -2.67 | -0.42 | -1.00 | -3.33 | 0.75 | 0.34 | 7.77 | |
| Sakha 93 | Control | 2.67 | 44.00 | 67.00 | 6.56 | 21.67 | 151.33 | 3.33 | 13.67 | 18.66 |
| Inoculated | 9.00 | 42.20 | 70.67 | 6.56 | 22.33 | 157.33 | 3.83 | 12.50 | 15.43 | |
| Differences | -6.33 | 1.80 | -3.67 | 0.00 | -0.66 | -6.00 | -0.50 | 1.17 | 3.23 | |
| Sakha 94 | Control | 2.50 | 48.70 | 61.67 | 6.14 | 22.17 | 139.67 | 1.97 | 15.47 | 15.40 |
| Inoculated | 7.00 | 53.30 | 67.00 | 7.20 | 27.17 | 153.33 | 1.64 | 12.33 | 14.65 | |
| Differences | -4.50 | -4.60 | -5.33 | -1.06 | -5.00 | -13.66 | 0.33 | 3.14 | 0.75 | |
| Sids 12 | Control | 2.00 | 51.47 | 60.67 | 5.50 | 22.50 | 133.67 | 1.83 | 10.47 | 10.40 |
| Inoculated | 7.33 | 50.53 | 64.00 | 6.56 | 26.33 | 147.00 | 1.44 | 11.33 | 9.37 | |
| Differences | -5.33 | 0.94 | -3.33 | -1.06 | -3.83 | -13.33 | 0.39 | -0.86 | 1.03 | |
| Sids 13 | Control | 2.33 | 45.37 | 68.00 | 6.35 | 22.50 | 153.33 | 3.25 | 20.33 | 29.83 |
| Inoculated | 8.67 | 43.63 | 68.00 | 6.60 | 20.58 | 149.38 | 2.78 | 12.33 | 10.50 | |
| Differences | -6.34 | 1.74 | 0.00 | -0.25 | 1.92 | 3.95 | 0.47 | 8.00 | 19.33 |
Table 3: Mean of seedling vigour, chlorophyll content, heading date, head length, plant height, days to maturity, number of tillers/plant, root length and biological yield for the different genotypes under control and common bunt inoculated conditions.
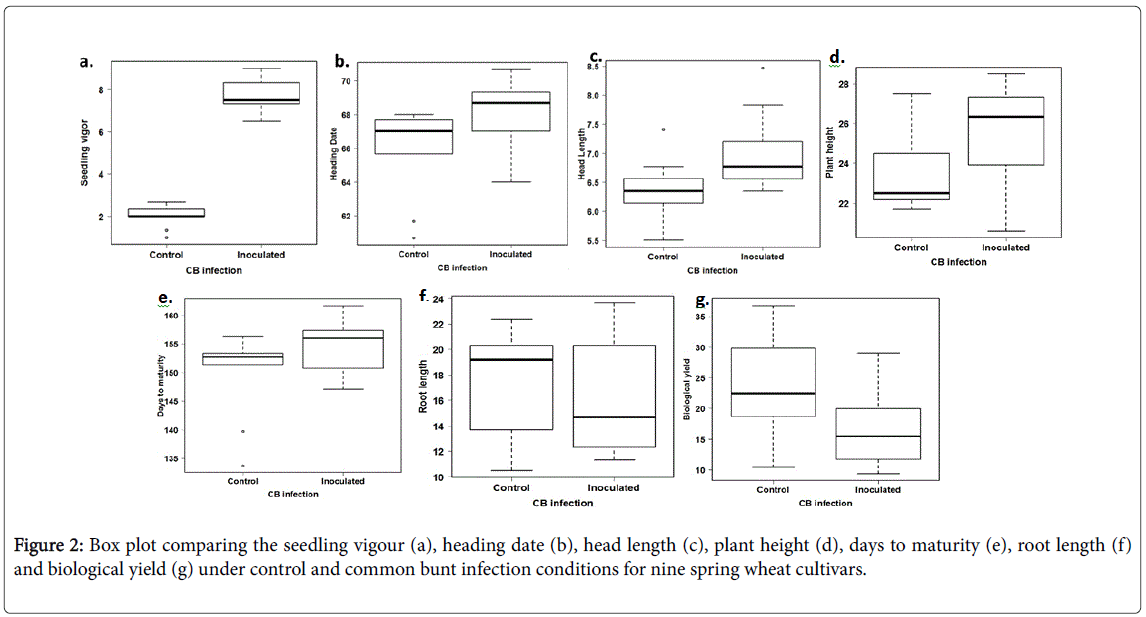
Figure 2: Box plot comparing the seedling vigour (a), heading date (b), head length (c), plant height (d), days to maturity (e), root length (f) and biological yield (g) under control and common bunt infection conditions for nine spring wheat cultivars.
Heading dates
Highly significant differences were found between the control and inoculated genotypes for the heading date. Significantly differences were found between the genotypes for the heading dates. However, no significant interaction was found between the treatment and the genotypes which indicated that all the susceptible genotypes had a similar response to the CB. Heading dates under the control conditions ranged from 61.67 to 68.00 days with an average of 67.25 while it ranged from 64 to 70.50 days with an average of 69.00 under the CB infection (Figure 2). No previous studies included the effect of CB infection on the heading dates in greenhouse grown wheat. However, due to the CB effect on stunting plants, we expected significantly later heading dates after CB inoculation as was found in this study.
Head length
Highly significant differences were found between the head length under the control and inoculated conditions indicating that CB infection influenced this trait. In addition, highly significant differences were found between the genotypes. Due to the absence of the significant interaction between the genotypes and the treatments, we can conclude that all the susceptible genotypes had a similar response to the CB infection. An increase in the head length was found under the CB inoculation conditions compared with the control conditions for all the genotypes except for Sakha93 which had the same head length. Previous research reported a reduction in the head length under CB infection in a set of three susceptible spring wheat genotypes under greenhouse conditions [4]. That our results contradicted the results of Dumalasová and Bartoš, (2007) may reflect the different genotypes used in the studies or greenhouse conditions.
Plant height
Significant differences were found between the genotypes for plant height. The genotypes had significantly taller plants under CB infection compared with the plants under the control conditions except for one genotype, Sids13, which had taller plants under the control conditions than the inoculated conditions (Table 3). In general, plant height under the controlled conditions ranged from 21.7 to 32.2 cm with an average of 24.9 cm. Plant height ranged from 20.6 to 35.3 cm with an average of 26.9 cm under the CB inoculation conditions (Figure 2). The effect of CB infection in increasing the plant height in our experiment contradicted the results of Dumalasová and Bartoš 2007 who mentioned that CB infection reduced the plant height in their tested genotypes. One reason for our results could be that CB delayed heading date which provided longer growth periods and possibly then taller plants. It may also be a greenhouse-induced anomaly as CB in the field has stunted plants as a symptom.
Days to maturity
Common bunt inoculation was found to have a highly significant effect on days to maturity. No significant differences were found between the tested genotypes. However, a significant interaction between the genotypes and the treatment was found in the spring genotypes (GxT) which indicates that the genotypes have a different response to the inoculation. These results can be explained by all the spring genotypes were delayed in the maturity under CB infection compared to the control conditions, except for two genotypes, Misr 1 and Sids 13, which were severely infected and had earlier maturing plants under the infection than the controlled conditions (Table 3). Number of days to maturity ranged from 133.67 to 170.70 days with an average of 153.09 under the control conditions. It ranged from 147.00 to 174 days with an average of 157.59 days under the CB infection conditions. Goates (1996) mentioned that wheat heads under CB infection usually stay green for a longer time compared with the uninoculated heads under the same conditions which indicated the delaying of maturity under the infection conditions. Based on our results which were in general agreement with Goates (1996), the presence of two susceptible genotypes with earlier maturity under CB and a very high percentage of infected heads (93 and 83%, respectively) suggested that under severe infection infected heads do not always stay green for a longer time.
Root length (cm)
The root length under CB inoculation condition was highly significantly longer than the root length of genotypes under the control conditions. No significant differences were found among the genotypes for root length. However, all the spring genotypes generally had longer root length under the control conditions (with an average of 17.3 cm) than the inoculated conditions (with an average of 16.5 cm) (Figure 3b). The exceptions were three genotypes (Gemiza10, Gemiza11 and Sids12) which had longer roots under the CB infection (Table 3). We can conclude that CB infection generally reduces the root length with some exceptions. This conclusion agreed with Dumalasová and Bartoš (2007) who found that CB infection reduced the root length in their tested susceptible genotypes.
Biological yield
Significant differences were found between the genotypes for the biological yield. All the genotypes had lower biological yield under the common bunt infection than the biological yield under the controlled conditions. The biological yield ranged from 10.40 to 36.80 gm/plant in the control treatment with an average of 23.88 gm. The biological yield in the inoculated plants ranged from 9.37 to 29.03 gm/plant with an average of 17.11 gm (Figure 2). No previous studies included the effect of common bunt disease on the biological yield. However, the main effect of common bunt infection is to prevent the formation of kernels and produce a bunt balls containing common bunt dusty spores [1]. Because of this effect, the biological yield of infected heads is expected to be lower than the biological yield of the uninoculated plants that had completely grown kernels as was found in our experiment.
Differences in the response of resistant and susceptible genotypes to common bunt infection
Comparing the response of the nine susceptible spring genotypes and the two winter resistant genotypes to the CB infection, we found that no clear differences in the response for all the studied traits except for the root length (Figure 4). Unlike the susceptible genotypes, the resistant genotypes had longer roots under the inoculation conditions than their root length under the control conditions (Figure 3). No previous studies explained the mechanism of CB resistance in wheat plants. However, some studies concluded the increasing of lipase gene, PR-1a and chitinase A, and a β -1,3-glucanase proteins in the tissue of resistance seedlings which are isogenic for Bt10, CB resistance gene [10]. The higher abundance of chitinase protein in the root tissue was found to play a significant role in increasing the root growth by increasing the protein folding and degradation in the root [11]. This effect of chitinase protein could be a plausible reason for increasing the root length in the resistant genotypes under CB infection than its length in the susceptible genotypes.
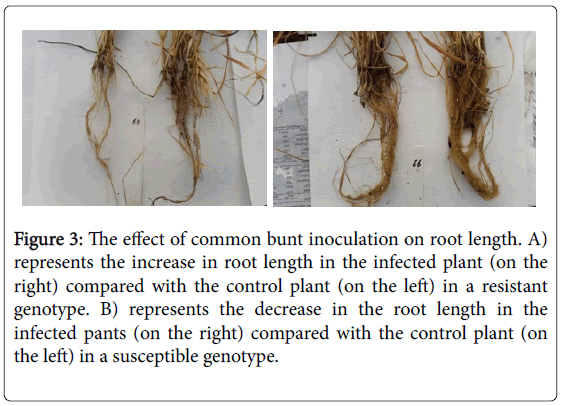
Figure 3: The effect of common bunt inoculation on root length. A) represents the increase in root length in the infected plant (on the right) compared with the control plant (on the left) in a resistant genotype. B) represents the decrease in the root length in the infected pants (on the right) compared with the control plant (on the left) in a susceptible genotype.
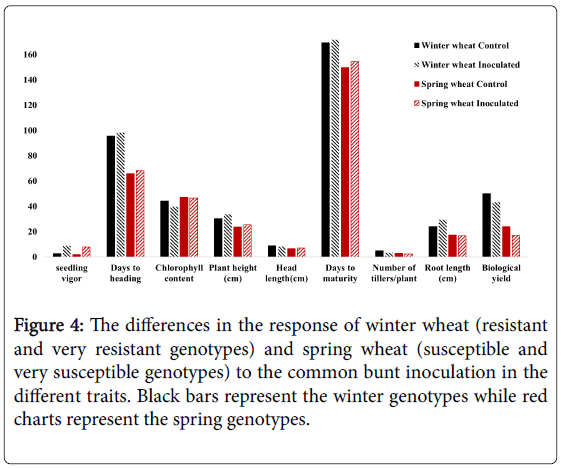
Figure 4: The differences in the response of winter wheat (resistant and very resistant genotypes) and spring wheat (susceptible and very susceptible genotypes) to the common bunt inoculation in the different traits. Black bars represent the winter genotypes while red charts represent the spring genotypes.
Conclusion
In conclusion, the CB infection was found to increase the seedling vigour, delay the heading date, increase the head length, increase the root length and decrease the biological yield in the tested genotypes. The resistant genotypes were found to have longer roots under the CB infection compared with their root length under the control conditions. However, a reduction in the root length was found in some susceptible genotypes due to the CB infection. Due to the difficulty in measuring the root length and the different response of the susceptible genotypes, this trait is not a useful trait for the early prediction of CB resistance. However, root length, after being confirmed with additional resistant genotypes, may still be used as a preliminary indicator to identify the resistant genotypes in breeding programs especially when evaluating the genotypes under greenhouse conditions. The absence of the differences between the response of resistant and susceptible genotypes in other agronomic traits confirmed the difficulty of early prediction and selection of CB resistance genotypes. Hence the most accurate selection of resistant lines still requires waiting until the end of the growing season to identify resistance.
Acknowledgment
The author would like to thank Richard Little, a technologist at Agronomy and Horticulture department, UNL, USA, for his help in common bunt inoculation. This work was financially supported by cultural affairs and mission sector, the Egyptian government.
References
- Ciuca M (2011) A preliminary report on the identification of SSR markers for bunt (Tilletia sp.) resistance in wheatCzech. Journal of Genetics and Plant Breeding 47: 142-145.
- Matanguihan GJB (2011) Identification of pathogenic races and microsatellite markers of Tilletia caries (D.C.) Tul. & C. Tul. and mapping of a common bunt resistance gene in winter wheat. Washington State University.
- Dumalasova V, Bartos P (2007) Reaction of spring wheat cultivars to common bunt caused by Tilletia tritici (Bjerk.) Wint. and Tilletia laevis (Kühn)Czech. Journal of Genetics and Plant Breeding 43: 82-86.
- Netto AT, Campostrini E, De Oliveira JG, Bressan-Smith RE (2005) Photosynthetic pigments, nitrogen, chlorophyll a fluorescence and SPAD-502 readings in coffee leaves. Scientia Horticulturae 104: 199-209.
- Veisz OB, Szunics LU, Szunics L (2000). Effect of common bunt on the frost resistance and winter hardiness of wheat (Triticum aestivum L.) lines containing Bt genes. Euphytica 114: 159-164.
- Rife TW, Poland JA (2014) An open-source application for field data collection on android. Crop Science 54: 1624-1627.
- Utz HF (1997) A computer program for statistical analysis of plant breeding experiments. Version 2N. University of Hohenheim: Stuttgart, Germany.
- Maksimov IV, Troshina NB, Khairullin RM, Surina OB, Ganiev RM (2002) The Effect of the Common Bunt on the Growth of Wheat Seedlings and Calluses 49: 685–689
- Gaudet D, Menzies J (2012) Disease Resistance in Wheat. CABI international pp. 220-235.
- Ghosh D, Xu J (2014) Abiotic stress responses in plant roots : a proteomics perspective 5: 1-13.
Citation: Amira MI Mourad, Mahdy E, Bakheit BR, Abo-Elwafaa A, Baenziger PS (2018) Effect of common bunt infection on agronomic traits in wheat (Triticum aestivum L.). J Plant Genet Breed 2: 102.
Copyright: © 2018 Mourad A, et al. This is an open-access article distributed under the terms of the Creative Commons Attribution License, which permits unrestricted use, distribution, and reproduction in any medium, provided the original author and source are credited.
Share This Article
Open Access Journals
Article Usage
- Total views: 4084
- [From(publication date): 0-2018 - Nov 21, 2024]
- Breakdown by view type
- HTML page views: 3343
- PDF downloads: 741