Research Article Open Access
Effect of Cell Voltage and Temperature during Electrolytic Reduction of TiO2
Jayashree Mohanty* and R.K. Paramguru
C.V. Raman College of Engineering, Bidyanagar, Janla, Bhubaneswar-752054, BIIT, Bhubaneswar, Odisha, India
- *Corresponding Author:
- Jayashree Mohanty
C.V. Raman College of Engineering
Bidyanagar, Janla, Bhubaneswar-752054
BIIT, Bhubaneswar, Odisha, India
E-mail: jayashreemohanty7@gmail.com
Received Date: December 31, 2012; Accepted Date: January 22, 2013; Published Date: January 29, 2013
Citation: Mohanty J, Paramguru RK (2013) Effect of Cell Voltage and Temperature during Electrolytic Reduction of TiO2. J Powder Metall Min 2:105. doi: 10.4172/2168-9806.1000105
Copyright: © 2013 Mohanty J, et al. This is an open-access article distributed under the terms of the Creative Commons Attribution License, which permits unrestricted use, distribution, and reproduction in any medium, provided the original author and source are credited.
Visit for more related articles at Journal of Powder Metallurgy & Mining
Abstract
The properly dried CaCl2 salt is melted to the required temperature of electrolysis. Electrolysis of TiO2 electrode has been carried out at two different bath temperatures of 900 and 950°C keeping a constant cell voltage of 3 V. Also the electrolysis of TiO2 electrode is carried out at three different cell voltages of 2.8, 3.0 and 3.3 V at a bath temperature of 950°C. The current-time plot is drawn for each experiment. The resulting products after electrolysis are characterized by XRD and SEM. The effects of bath temperature and cell voltage of electrolysis on reduction process as well as on the characteristics of reduced products are studied.
Keywords
CaCl2 salt; Molten bath; Cell voltage
Introduction
Presently titanium is produced by Kroll’s process which is a batch type process as well as labour and energy intensive process. Therefore although titanium and its alloys have many desirable and attractive properties, it can not be used to the level it requires. Hence, lots of processes are being developed by various researchers to replace the existing Kroll’s process. In order to achieve the objective, the new process should be continuous, fast reduction process with effective purity control of the product.
It is reported by Fray et al. that TiO2 can be directly reduced to Ti in a molten CaCl2 bath [1-4]. In a similar attempt, Ono and Suzuki [5] have also developed a process for production of Ti metal based on calciothermic reduction of TiO2 in molten CaCl2 bath. In the FFC process, TiO2 is reduced by oxygen ionization, whereas in Ono and Suzuki (OS) process, the reduction occurs by calcium produced electrochemically. Calcium reduction is facilitated because of the extensive solubility of Ca in molten CaCl2 at 900°C. In order to make the Ti metal free from impurity, an electronically mediated molten salt electrolysis (EMR/MSE) has been developed by Park et al. [6]. This process is not only effective in maintaining the purity control but is also suitable for improving energy efficiency. However, when reduction is associated with oxygen ionization according to FFC process, the success of the reduction process requires an understanding of the detailed electrochemistry, thermodynamics, transport phenomena and microstructural and morphological changes during the course of reduction [7] as well as the effect of various parameters such as preparation condition of TiO2 electrode, cell voltage and temperature of molten salt bath during electrolysis. The effects of parameters such as applied load, compaction time and temperature of heating during pellet preparation have already been discussed by Mohanty et al. [8]. This paper reports the effect of cell voltage and molten bath temperature of electrolysis on the reduction process as well as on the characteristics of the reduced product.
Experimental
Electrode preparation: A reagent grade titanium dioxide powder (Merk, India) was selected as the starting material for the preparation of the oxide cathode. The material was specified as rutile of 99% purity with average particle size of 1.174 μm (measured by Malvern particle size analyzer). Specific amount of the TiO2 powder was taken in an agate mortar and required amount (a few ml) of water was added to it. The mixture was properly mixed and then compressed into pellet of circular cross-section applying a load of 3 ton by using a die with 3 cm diameter and HERZOG HTP 40 (40 Tons) Hydraulic press. During pressing cotton was put at the center of the pellet. The pellet was dried at 150°C for 12 h in a high temperature oven and then heated at 1000°C for 3 hours in a horizontal Therlak muffle furnace having silicon carbide heating elements.
At the time of heating, the cotton was burnt out forming a hole at the center of the pellet. Through this central hole the pellet was bolted at the end of a stainless steel rod which was connected to the cathode lead during electrolysis thus making the TiO2 pellet as the cathode.
Electrolysis set-up: Electrolysis was performed in a cylindrical graphite crucible (I.D. 9.5 cm and height 22 cm) placed inside a vertical tubular pot made of inconnel 600 alloy (0.6 cm thickness, 15 cm diameter and 35 cm height) located inside the heating zone of a programmable digitally (temperature) controlled vertical muffle furnace with a water cooled top jacket and silicon carbide heating elements. The temperature was measured using a thermocouple made up of Pt-Pt-Rh13% (‘R’ type) covered with silimanite sheath. The upper end of the inconnel pot was closed by a heat insulating refractory board through which electrode leads, gas inlet/outlet and the thermocouple were inserted into the system.
Electrolysis procedure: The electrolysis experiment comprised of the pre-treatment of the calcium chloride as well as the electrolytic reduction of titanium dioxide. The pre-treatment consisted of heating of the calcium chloride at 200°C for 12 hours and pre-electrolysis of the molten calcium chloride, in order to eliminate redox-active species and moisture. A suitable quantity of anhydrous calcium chloride (Qualigens, India), usually between 700-800 g, was taken in a graphite crucible which served as the anode. The salt was properly dried by heating at 200°C for 12 h. Then the temperature was raised to the electrolysis temperature. The TiO2 electrode was inserted into the molten CaCl2 mass so that the pellet remained totally immersed in it. Another stainless steel rod (0.6 mm diameter, 520 mm length) without pellet was also inserted into CaCl2 for pre-electrolysis purpose. The latter stainless steel rod was connected to the cathode lead wire of the DC source during pre-electrolysis.
Pre-electrolysis: Pre-electrolysis was carried out, applying a direct voltage of 2 V between the graphite crucible (anode) and a stainless steel rod (cathode), until a small and time-independent current was established.
Electrolysis: Electrolysis of the TiO2 pellets was performed at two different bath temperatures i.e. 950°C and 900°C at a constant cell voltage of 3 V. Also the electrolysis of the TiO2 pellets was performed at three different cell voltages of 2.8, 3.0 and 3.3 V keeping a constant bath temperature of 950°C. For each experiment the time of electrolysis was 22 h. After electrolysis, the reaction chamber was allowed to cool. The graphite crucible was taken out of the inconnel pot and the solidified salt was dissolved in water. The reduced titanium dioxide pellet along with the stainless steel rod was taken out of the crucible. The reduced pellet was detached from the rod and kept under cold water for 3-5 h. Then it was washed with acetone, air- dried and gently rubbed with emery paper to remove impurities from its surface and was taken for characterization.
Characterization of the electrode and product
The products after electrolysis were characterized by techniques such as X-ray Diffraction (XRD) using PAN ALYTICAL PW 1830 Generator X-ray Diffractometer and Scanning electron microscopy (SEM) using JEOL, JSM-35 CF Model.
Results and Discussion
Effect of electrolysis temperature
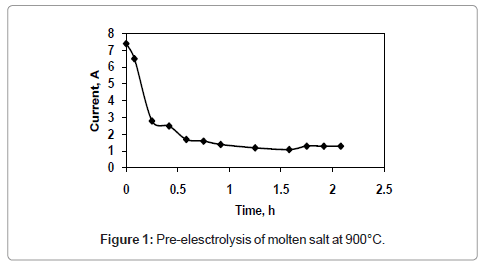
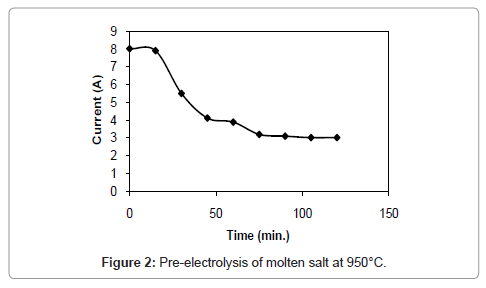
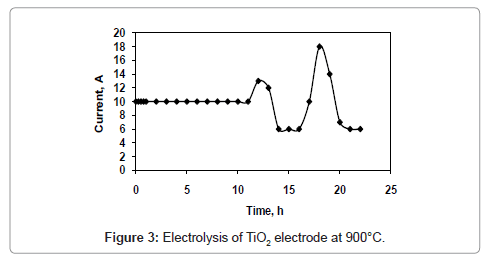
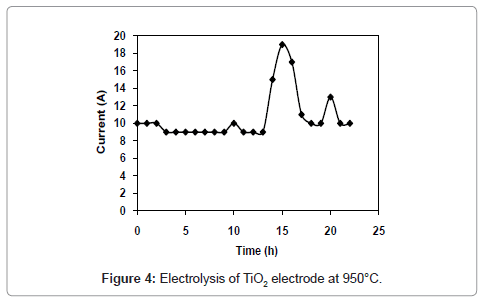
Figure 1 and 2 shows the current-time plots for pre-electrolysis at bath temperatures of 900°C and 950°C respectively. When the bath temperature is 900°C, the initial current is 7.4 A. With increase in time it decreases continuously and ultimately it reaches to a constant value of approximately 2 A. However, when the bath temperature is 950°C, comparatively higher initial current of 8 A is observed and it decreases continuously with increase in time and remains at a constant value of 3 A. The characteristics of current-time plots for 22 h electrolysis at cell voltage of 3V for two different bath temperatures of 900 and 950°C are shown in figures 3 and 4 respectively. These figures show an initial current of 10 A for both the cases. From these figures it is observed that the current value does not change significantly up to 11 h of electrolysis. After 11 h the current value rises significantly. It may be due to the reactions caused by Ca formed due to decomposition of CaO which is formed during the course of reduction. Further increase in the electrolysis time the current value decreases due to decrease in concentration of oxygen in the TiO2 electrode due to reduction.
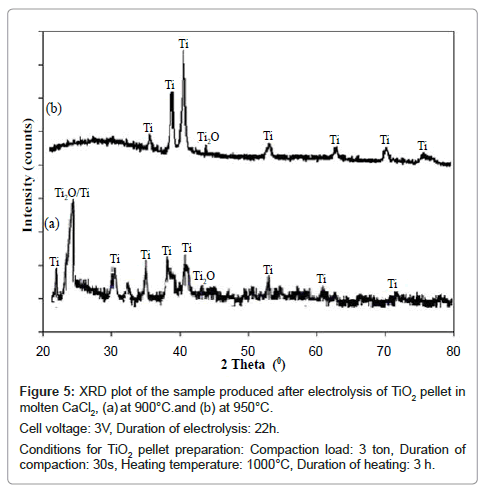
The XRD patterns of the electrolyzed samples produced at these two temperatures are shown in figure 5. When the electrolysis temperature is 900°C, the XRD pattern of the reduced sample (Figure 5a) shows peaks due both Ti and Ti2O. However when the electrolysis temperature is 950°C, the XRD pattern of the product shows all the main peaks of Ti in addition to a small peak of Ti2O. According to Mohanty et al. [8] Ti2O is the last sub-oxide of TiO2 which ultimately reduces to Ti [9]. However, comparing these two figures it is found that the sample is reduced more effectively when the electrolysis temperature is 950°C.
Figure 5: XRD plot of the sample produced after electrolysis of TiO2 pellet in
molten CaCl2, (a) at 900°C.and (b) at 950°C.
Cell voltage: 3V, Duration of electrolysis: 22h.
Conditions for TiO2 pellet preparation: Compaction load: 3 ton, Duration of
compaction: 30s, Heating temperature: 1000°C, Duration of heating: 3 h.
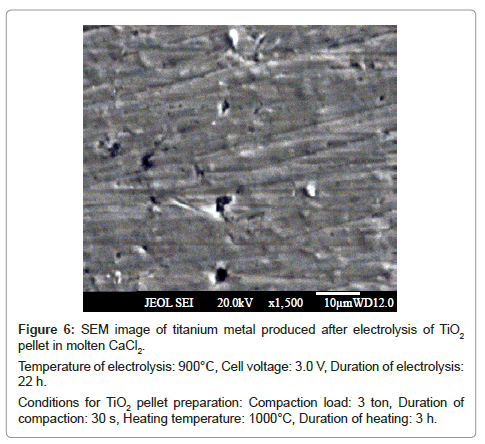
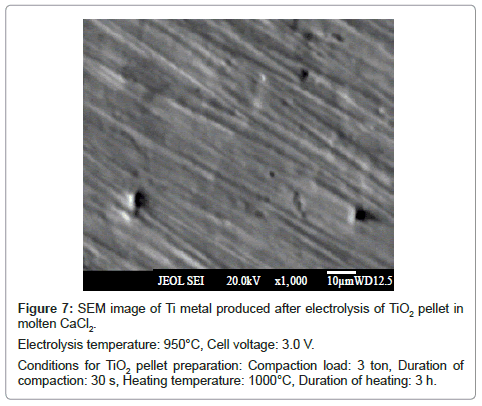
The SEM micrograph of the reduced samples at these temperatures is given in figure 6 and 7 respectively. Both show fibrous morphology. Overall, there is not much difference in the titanium metal produced at temperatures 900 and 950°C.
Figure 6: SEM image of titanium metal produced after electrolysis of TiO2
pellet in molten CaCl2.
Temperature of electrolysis: 900°C, Cell voltage: 3.0 V, Duration of electrolysis:
22 h.
Conditions for TiO2 pellet preparation: Compaction load: 3 ton, Duration of
compaction: 30 s, Heating temperature: 1000°C, Duration of heating: 3 h.
Effect of applied cell voltage
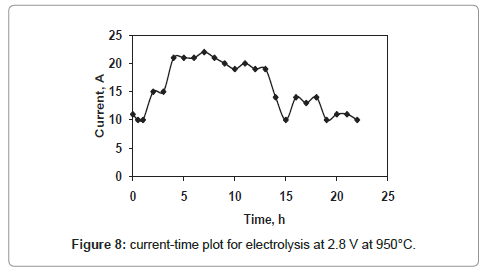
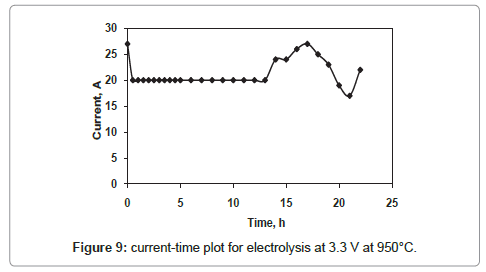
The current-time plots for the cell voltages 2.8 V and 3.3 V shown in figures 8 and 9 respectively whereas the same for the cell voltage of 3 V is already discussed in figure 4. The current-time plot for the electrolysis at 2.8 V shows an initial current of 11 A which is very close to that for electrolysis at 3 V. After few hours of electrolysis the current value reaches to a maximum value and then decreases with increase in electrolysis time. However the current-time plot for the electrolysis at 3.3 V (Figure 9) shows an initial current value of 27 A, which is higher in comparison to that of other two cell voltages. The higher current value is due to the higher rate of removal of oxygen from the TiO2 electrode. However, within one hour of electrolysis, it decreases to value of 20 A and this current value is maintained up to 13 h of electrolysis. Again it increases continuously and attains a maximum value of 27 A which is much higher than that for other two cell voltages. The reason may be due to the increased concentration of Ca in the molten bath, because the cell voltage 3.3 V is higher than the decomposition potential of CaCl2 [10]. The Ca in the molten salt bath is responsible for various parasitic reactions under the experimental conditions, causing a higher reduction current.
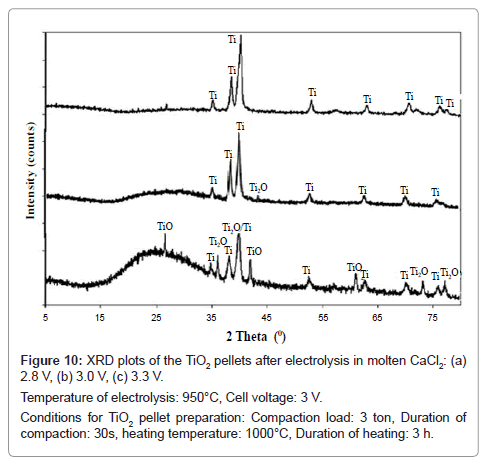
From the XRD patterns of the products as shown in figure 10, major peaks of Ti are observed in addition to other peaks such as TiO and Ti2O against the cell voltage of 2.8 V. However, on increasing the cell voltage to 3.0 V, major peaks of Ti are observed in addition to a small peak of Ti2O. On further increase in cell voltage to 3.3 V, only titanium peaks are observed. Hence, increase in cell voltage facilitates the reduction process, because at higher cell voltage the reduction is a combination of oxygen ionization as well as calcium reduction whereas at lower cell voltage the reduction is predominated by oxygen ionization.
Figure 10: XRD plots of the TiO2 pellets after electrolysis in molten CaCl2: (a)
2.8 V, (b) 3.0 V, (c) 3.3 V.
Temperature of electrolysis: 950°C, Cell voltage: 3 V.
Conditions for TiO2 pellet preparation: Compaction load: 3 ton, Duration of
compaction: 30s, heating temperature: 1000°C, Duration of heating: 3 h.
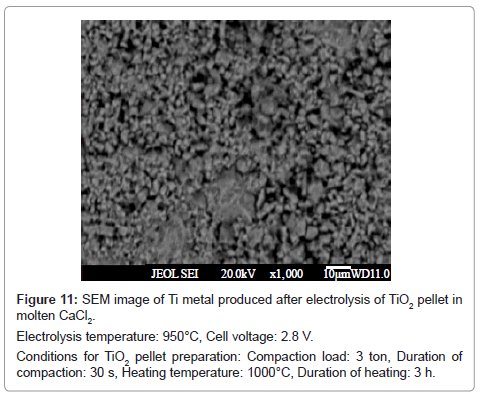
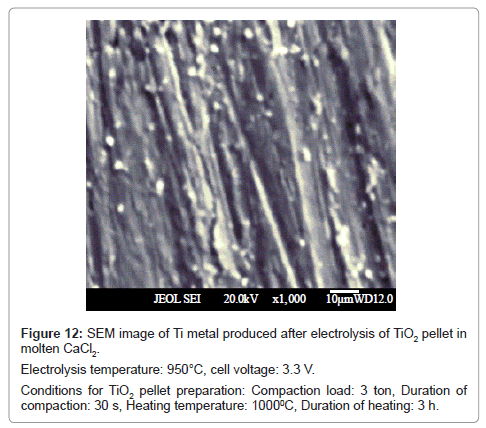
In all the cases, the reduced product retained their shape during washing. The SEM image of the product obtained at cell voltage of 2.8 V shows a spongy morphology (Figure 11), whereas, the products corresponding to 3.0 V (Figure 7) and 3.3 V (Figure 12) show fibrous morphology.
Conclusions
There is not much difference in current- time profile as well as composition and morphology of the products formed at bath temperatures 900 and 950°C. However, the nature of current-time profile changes with change in cell voltage of electrolysis. Although higher cell voltage facilitates the reduction process, the possibilities of parasitic reactions are more resulting in waste of electrical energy. In order to reduce these parasitic reactions a cell voltage lower than the decomposition potential of CaCl2 is preferred. Also, the characteristics of the reduced products change with change with cell voltage.
Acknowledgement
The author is thankful to IMMT Bhubaneswar for its support to carry out the experiments and to conduct XRD and SEM studies.
References
- Chen GZ, Fray DJ, Farthing TW (2000) Mathematical Modeling of Phase Change Electrodes and Application. Nature 407: 361-364.
- Fray DJ, Metals J (2001) Green Solvents II: Properties and Applications of Ionic Liquids 53: 26-31.
- Chen GZ, Fray DJ, Farthing TW (2001) Advanced Processing of Metals and Materials (Sohn International Symposium), Thermo and Physicochemical Principles. Metall. Mater. Trans. B 32B 1041-1052.
- Fray DJ (2002) Titanium powder production by preform reduction process (PRP). Can. Metallurg Quart 41: 433-439.
- Ono K, Suzuki RO (2002) Molten Salts XIV: Proceedings of the International Symposium. J. Metals 54: 59-61.
- Park TL, Abiko T, Okabe TH, Phy J (2005) Inflammation models in neurodegenerative and arthritic disorders. And Chem. of Solids 66: 410-413.
- Alexander DTL, Schwandt C, Cand DJF, Acta M (2006) 54: 2633-2944.
- Mohanty J, Rath PC, Subbaiah T, Mishra KG, Paramguru RK (2009) Trans. Indian Institute of Metals, 62: 249-253.
- Mohanty J, Mishra KG, Paramguru RK, Mishra BK (2012) High Temperature Materials and Processes 31: 289-297.
- Suzuki RO, Fukui S (2004) Molten Salts 15, in Memory of Robert Osteryoung. Materials Transactions 45: 1665-1671.
Relevant Topics
- Additive Manufacturing
- Coal Mining
- Colloid Chemistry
- Composite Materials Fabrication
- Compressive Strength
- Extractive Metallurgy
- Fracture Toughness
- Geological Materials
- Hydrometallurgy
- Industrial Engineering
- Materials Chemistry
- Materials Processing and Manufacturing
- Metal Casting Technology
- Metallic Materials
- Metallurgical Engineering
- Metallurgy
- Mineral Processing
- Nanomaterial
- Resource Extraction
- Rock Mechanics
- Surface Mining
Recommended Journals
Article Tools
Article Usage
- Total views: 15066
- [From(publication date):
March-2013 - Apr 04, 2025] - Breakdown by view type
- HTML page views : 10492
- PDF downloads : 4574
