Dynamical Patterns in Gene Expression Profile After Influenza A Virus Injection
Received: 11-Aug-2023 / Manuscript No. DPO-23-110142 / Editor assigned: 14-Aug-2023 / PreQC No. DPO-23-110142 (PQ) / Reviewed: 28-Aug-2023 / QC No. DPO-23-110142 / Revised: 04-Sep-2023 / Manuscript No. DPO-23-110142 / Accepted Date: 04-Sep-2023 / Published Date: 12-Sep-2023 DOI: 10.4172/2476-2024.8.S13.003 QI No. / DPO-23-110142
Abstract
Background: Finding the underlying gene regulatory mechanisms for complex diseases is essential for systems biology. The dynamic mode decomposition is adopted in this article to unveil the coherent dynamical patterns that correspond to viral recognition receptors in time-course gene expression profiles after injection of the Influenza A virus.
Results: The eigenvalues, dynamic modes, and amplitudes provide sufficient clues for distinguishing the symptomatic influenza infection individuals from the asymptomatic ones. The symptomatic individuals have a total of 20 dominant modes having positive real eigenvalues, implying a monotonic increase of the receptor response due to the replication of the virus. The asymptomatic individuals have only two real positive eigenvalues, corresponding to the receptors that activate the innate immune response promoting viral clearance.
Conclusion: If the time-course gene expression profiles are available, one can straightforwardly extend this approach to other diseases, such as COVID-19.
Keywords: Dynamical patterns; Dynamic mode decomposition; Time-course gene expression; Influenza A virus
Background
In a cell a single gene may take part in expressions of several or even many genes, and a gene’s expression is usually regulated cooperatively by a set of genes [1]. The genes are integrated by the regulations into a gene regulatory network [1-12], through which they realize their roles in various cellular processes and pathways. As a response to the signals from the environments and/or the intrinsic cellular processes, the gene regulatory network will adjust the expressions of the genes [2]. The records for all expressions will form a multivariate time series. Identifying the dynamical patterns in the gene expression time series is subsequently an essential task since the invention of the high-through- out technique [13-15]. It can not only shed light on the underlying molecular-level mechanism for the processes occurring in the cell, but also be helpful in intervention, regulation, and even control of the cell’s life. Herein one meets a typical problem called curse of dimensionality.
In each specific measurement, the micro-array can provide us simultaneous expressions for more than ten thousand genes [16]. However, the number of sampling in the interested time duration can reach only to several tens due to technical limitation. One solution is to reduce the dimension by decreasing the redundancy of the expressions, such as the clustering and the mixed-effect modeling techniques, and describe the dynamical process with ordinary differential equations in the low-dimensional space [17,18]. The procedure for dimension reduction involves a serial of steps for clustering, smoothing, regulation identification, parameter estimates refining, and function enrichment analysis, each of which implies loss of information. For instance, in gene clustering [19], the correlations between genes are calculated, but the causal and effect information is lost. An alternative solution is to simplify the regulations by means of representing them with, for examples, the cross-correlations between gene expressions or several logical states [20-23]. The simplification leads also to serious loss of information or expensive computations. For instance, in the Boolean model the gene expression levels are simply coarse-grained into two states (on and off) [4,5], in which the time-course nature of gene expression profiles are not efficiently taken into account. In the Bayesian network [8,24], different types of data and prior knowledge are combined with the Bayes’ rule to find the optimization solution from many combinatory candidates, implying usually a high computational cost. The vector auto-regressive and state-space models [2,25] are also discrete ones, requiring equally spaced and intensive time series to obtain reliable inference of parameters. Actually, in most practice cases, due to the complications in computations and theoretical justifications, only the first-order and linear auto-regressive model is adopted [26].
Recent years have witnessed a rapid development of the Dynamic Mode Decomposition (DMD) [27-30]. It is a pure data-driven technique designed to identify the low-dimension coherent structures in dynamical processes’ for high-dimensional systems. Let us consider the dynamical process of a complex system. When the interested time duration is so short that the intrinsic condition keeps unchanged, it is reasonable to assume the dynamical process follows an identical law [27]. Though the dynamical process is generally nonlinear and complex, when the time interval between two successive sampling is small enough, it is reasonable to approximate the following state with by a linear transformation of the present state, i.e., the dynamical law can be quantitatively described by the matrix corresponding to the linear transformation, called evolutionary matrix.
The DMD paves a path to find the collective patterns from microscopic to macroscopic time scales stored in high-dimensional data, without the loss of information. It provides us also the dominated coherent structures at each sampling point. It is well-known that a complex biological function is usually realized by the co-operations between several or more genes, and a complex disease is closely related with several or more genes. Hence, the dynamical collective patterns detected by the DMD may deepen our understandings of various biological functions and diseases. Some gene expression profile series have been reported, i.e., all the expressions of interesting genes are measured simultaneously at successive time points.
For instance, the response of a total of 17 volunteers to the injection of H3N2 virus is reported in the famous data-base https://www.ncbi. nlm.nih.gov/geo/query/acc.cgi?acc=GSE30550. Before the injection, the gene expressions for each volunteer are measured as a reference.
After the injection, the gene expressions for all the volunteers are measured per eight hours. The experiment lasts a total of five days, in which nine individuals become patients with significant symptoms and the others keep healthy [31,32]. The records for each specific volunteer form a multivariate time series with 11961 rows and 16 columns. Each row corresponds to a specific gene, and each column a specific sampling time point. Going further to the peak symptom time analysis reported in Zaas, et al. [31] and the report of an hour-by-hour detailed view of host immune response as a continuum, spanning the time from exposure to peak symptom manifested by Huang, et al. [32]. In this work, the DMD is adopted to identify the collective dynamical patterns of symptomatic and asymptomatic individuals in these gene expression series.
Technically, the successive columns for the gene expression time series are linked with an identical evolutionary matrix, respectively. A standard procedure of DMD [33,34] is then used to reduce the dimension of the evolutionary matrix, the eigenvectors for which are called dominant DMD modes, whose characteristic time scales are determined by the corresponding eigenvalues. The amplitude for each specific mode quantifies its influence. It is found that the spectral components distinguish successively the symptomatic from the asymptomatic individuals. The highest dominant mode of the asymptomatic individuals has lower amplitude than that of the symptomatic individuals. The eigenvalues of the collective symptomatic individuals correspond to stable DMD modes except 20 eigenvalues, and that for asymptomatic individuals have two unstable temporal modes. The dominant patterns turn out to correspond to the recognition receptor genes, e.g., the Protein Disulfide Isomerase family A member 3 (PDIA3), Histone cell cycle regulator (HIRA), G protein subunit alpha 13 (GNA13), S100 calcium binding protein P (S100P), Ribosomal Protein L36a pseudogene 37 (RPL36AP37), Keratin 1 (KRT1), Endoplasmic Reticulum Aminopeptidase 2 (ERAP2), X Inactive Specific Transcript (XIST), Retinoic acid-Inducible Gene-I (RIG-I)-Like Receptors (RLRs) [35-37], Toll-Like Receptors (TLRs) [38,39], Nucleotide-binding Oligomerization Domain (NOD)-Like Receptors (NLRs) [35,40-42], which are causal for transcriptional response to other genes sharing the features like innate immunity response.
Materials and Methods
Data and pre-processing
The data GSE30550 for a human influenza challenge study was freely downloaded from the GEO database in NCBI website, also refer [31,32]. A cohort of 17 healthy human volunteers received an intranasal injection of influenza H3N2/Wisconsin (four different doses). The total genes available on whole peripheral blood drawn from each individual at 16 sequences of time-course gene expressions are 11961. Each sequence covers a duration of 132 h including 15 measurements at 0,5,12,21,29,36,45,53,60,77,84,93,101,108 h post-injection (hpi) and one measurement taken 24 h before injection (-24 hpi). The individuals 8,13,17 have missed values at the sampling points 21,(-24,36),36, respectively. The absent value is estimated to be the median of its two neighboring expression values. We describe the original expressions for the k-th individual with a matrixSk, whose specific entity; Sk(i,m),i=1,2,3,.......11961; m=0,1,2,3,.....,15 is the original expression level for the i-th gene in the time point. We conducted dynamic mode decomposition in each individual gene expression matrixSk, and the individuals with at least one positive eigenvalue is symptomatic (unstable) otherwise is asymptomatic (stable). We found a total of 9 individuals numbered 2,3,4,5,6,7,8,13,17 are symptoms and the other 8 numbered 1,9,10,11,12,14,15,16 are asymptomatic. The numbers of symptomatic and asymptomatic after influenza A injection are equivalent to the numbers reported in [31,32].
Subsequently, for conducting the DMD in collectively symptomatic (asymptomatic), we unite the expression profiles of 9 symptomatic (8 asymptomatic) into a single gene expression profile (matrix)SI (SH),whose entity becomes


for the i-th gene in the m-th expression level. Figure 1 is the heat- map of the gene expression profile data samples (left) and the extracted symptomatic and asymptomatic individual’s matrices (right).

Figure 1: Heat map of the gene expression profile, P24 (h) is the gene expression data of 24 h before injection of H3N2 viruses, and the rest is the time point after injection. Each measure replaced by normalized gene’s transcription response to have zero mean and unit standard deviation (in the left), red color represent the positive (up-regulated) and green color is negative (down-regulated). Moreover the intensity of color represent the measure magnitude. The heat-map of the merged symptomatic (I) (asymptomatic (H)) individuals is in the upper (bottom) right.
Dynamic mode decomposition of the time-course expressions
The normalized gene expression profile of the collective
symptomatic (asymptomatic) individuals denoted by matrix I(H),
whose entity corresponding to 
Herein, are the mean and standard deviation
of the gene expression levels with respect to the dummy variable (∙),
i.e., the genes? A reasonable assumption is that all the transitions
between successive expression levels can be mimicked by an identical
linear relation Α. Let us denote the symptomatic (asymptomatic) gene expression levels at the m-th point with I(i,nm)[H(i,m)] (the m-th column in I[H] ), we have,
are the mean and standard deviation
of the gene expression levels with respect to the dummy variable (∙),
i.e., the genes? A reasonable assumption is that all the transitions
between successive expression levels can be mimicked by an identical
linear relation Α. Let us denote the symptomatic (asymptomatic) gene expression levels at the m-th point with I(i,nm)[H(i,m)] (the m-th column in I[H] ), we have,


: represent index of all genes, i.e., 1,2,3,...,1196.
A simple computation for symptomatic leads to  where † denotes the Moore-Penrose pseudoinverse of the dummy variable(.).
It can be estimated by minimizing the Frobenius norm of the difference
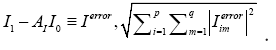
The operator AI is a matrix with a size of 11961 × 11961, implying
that it has a total of 11961 eigenvalues and corresponding eigen-modes.
To preserve (discard) the eigen-modes reflecting the macroscopic
behaviors (microscopic details from noises and occasional events) of I0, the Singular Value Decomposition (SVD) is adopted the detailed of SVD see in [33,34] and depicted in Figure 2, i.e., where *
denotes the complex conjugate transpose, r refers to the number of the
preserved rank of the data matrix and it is less than or equal to min 1 (11961,143)=143. The same procedure were used for AH Discarding,
reduces the number of operations in subsequent steps, but care takes
to avoid discarding relevant parts of the dynamics. More details
about discarding with examples and advanced strategies are available
in [29,43,44]. In this work, we discarded the negative log scale of the singular values
where *
denotes the complex conjugate transpose, r refers to the number of the
preserved rank of the data matrix and it is less than or equal to min 1 (11961,143)=143. The same procedure were used for AH Discarding,
reduces the number of operations in subsequent steps, but care takes
to avoid discarding relevant parts of the dynamics. More details
about discarding with examples and advanced strategies are available
in [29,43,44]. In this work, we discarded the negative log scale of the singular values

Figure 2: SVD of symptomatic (I0)(asymptomatic (H0) matrix. is the coordinates of the i-th gene in the coordinate system of the scaled eigengene, σm,Vm.tm' contain the coordinates of the m-th, time points in the basis of the scaled eigen-time points, σmUm and 143(127) is the dimension of I0(H0).
Using the component of the SVD, the operator AI approximated as but the size of matrix A1 is still 11961 × 11961. A low-
dimensional is efficiently performed by projecting using the first r left singular vectors ( Ur ). The reduced operator defined to be
but the size of matrix A1 is still 11961 × 11961. A low-
dimensional is efficiently performed by projecting using the first r left singular vectors ( Ur ). The reduced operator defined to be whose eigen-decomposition read,
 where the columns of
 and the diagonal entries of
 are the eigen-modes and the eigenvalues of
 , respectively. Then,
 is used to approximate
the DMD mode (dynamic mode) of AI i.e., the approximated dynamic mode corresponding to the lm is,
is used to approximate
the DMD mode (dynamic mode) of AI i.e., the approximated dynamic mode corresponding to the lm is,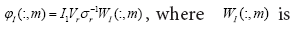 the m-th column of W .
The dynamic modes describe how gene are related (each gene
expression in gene expression profile). Within a single dynamic mode,
the magnitude of each element in a column  provide a measure
of gene’s expression participate in the mode. The DMD eigenvalues
can also be converted to continuous time eigenvalues by,
provide a measure
of gene’s expression participate in the mode. The DMD eigenvalues
can also be converted to continuous time eigenvalues by,  , where ∆t is the difference between two successive points. The
continuous eigenvalues can be interpreted by their corresponding real
and imaginary part i.e.,
, where ∆t is the difference between two successive points. The
continuous eigenvalues can be interpreted by their corresponding real
and imaginary part i.e.,  The real part regulates the growth
 of the dynamic modes. The imaginary part indicates the frequency
 of oscillation in the mode. Then, by using
the approximate eigen-decomposition, we obtain a coupled gene-
temporal model,
of oscillation in the mode. Then, by using
the approximate eigen-decomposition, we obtain a coupled gene-
temporal model,
Following the same simple computation used for united
symptomatic individuals, we obtain the dynamical patterns and
thecoupled gene-temporal model for united asymptomatic individuals:  is a set of
weights satisfying
is a set of
weights satisfying  is not a square
matrix so that
is not a square
matrix so that  Note that entries of
 are coefficients of the linear combination of I(:,0)[(:,0)] H in the eigen-modes
basis, called DMD amplitudes
are coefficients of the linear combination of I(:,0)[(:,0)] H in the eigen-modes
basis, called DMD amplitudes
Results and Discussion
For symptomatic individuals, Figures 3a-3e, illustrate the DMD
decomposition of 11961 genes in united 9 symptomatic individuals
over 144-gene expression levels. The top left panel (a) is the log scale
of the singular values decomposition. Specifically, the singular value
decomposition produces a diagonal matrix whose the leading elements
establish the modes with maximum variance. Four open circles are
the noisy modes which were discarded. The panel (b) illustrate the
distribution of eigenvalues ω , showing the modes which have growth, dominant modes which are used in the solution
decay and/or oscillatory control. The solid circles represent the  to approximate the genes expression levels. The panel (c) considered the
magnitude of real part of eigenvalues, plotted in a histogram, showing
the gene expression growth in each gene. We found 20 positive real part
eigenvalues, where 12 distributed in the interval (0,2) and 8 in the interval
(2,4). The DMD modes patterns which are composed of amplitudes
(mode-values) of the 11961genes, and its high resolution of the first five
dominant gene-modes between
to approximate the genes expression levels. The panel (c) considered the
magnitude of real part of eigenvalues, plotted in a histogram, showing
the gene expression growth in each gene. We found 20 positive real part
eigenvalues, where 12 distributed in the interval (0,2) and 8 in the interval
(2,4). The DMD modes patterns which are composed of amplitudes
(mode-values) of the 11961genes, and its high resolution of the first five
dominant gene-modes between  are highlighted in the panel (d),
 (not shown)
are conjugate to
(not shown)
are conjugate to  respectively. The panel (e)
demonstrate modes of each gene and their high resolution of the first 9
dominant gene-modes between 4000-4010.
respectively. The panel (e)
demonstrate modes of each gene and their high resolution of the first 9
dominant gene-modes between 4000-4010.

Figure 3: DMD decomposition of 144-genes expression levels of 9 symptomatic individuals. A. The top left panel (a) shows on a log scale, the information captured in each mode from the SVD decomposition (log(σk)<0 with open circles discarded as the noisy information. B. The panel (b) is the 143 eigenvalues (ωk) of each mode in which the dominant represented by the solid circles used in the solution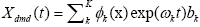 Eigenvalues with
  represent the growth modes. C. The panel (c) is the histogram DMD distribution of real positive eigenvalues
  D. The panel (d) shows the DMD modes
 and the first 5 high resolution mode of the genes between 4000-4010. E. Panel (e) is the DMD mode in each gene and the high resolution of the first 9 DMD modes of the ten genes between(4000-4010).
For asymptomatic individuals, Figures 4a-4e, illustrate the DMD
decomposition of 11961 genes in united 8 asymptomatic individuals
over 127-gene expression levels. The top left panel (a) is the log scale
of the singular values decomposition. Panel (b) is the distribution of eigenvalues wk, used to approximate the genes expression levels.
The panel (c) is the magnitude of real part eigenvalues, plotted in a
histogram, showing the gene expression growth in each gene. We
found two positive real part eigenvalues, one has 0.0037 magnitude
and the other has the magnitude 0.0005. The DMD modes which are
composed of weightings of the 11961 genes, and the high resolution of
the first five dominant modes in genes  are highlighted in the panel (d),
 (not shown) are conju gate to
 respectively. Modes of each gene and
their high resolution of the first 9 dominant modes in genes 4000-4010,
demonstrated in the panel (e). As shown in Figure 4a, all the log scale
singular values are greater than zero, implies that no noisy information
in the health individuals genes expression profile, but Figure 3a which
is the singular values from the infected individuals genes expression
profile had four noisy information represented by an open circles. The
eigenvalues for both Figures 3a and 4b are mostly distributed in the
negative real part and are symmetric distributed in the imaginary part,
showing that most of the DMD mode decayed and have controlled with
oscillation. However, as shown in Figures 3c and 4c, the symptomatic
individual contain more real positive eigenvalues with large magnitude
comparing to asymptomatic individuals genes expression profile.
The higher resolution between 4000-4010 gene-modes shows that in
each gene mostly contains both the negative and positive modes for
symptomatic while for asymptomatic mostly has only one sign (negative/
positive) mode (see the higher resolution in Figures 3a and 4e). The
magnitude of the modes for symptomatic and asymptomatic individuals
are in the interval (-0.4,0.4) and (-0.1,0.1), respectively as shown in Figures 3a and 4e. What is more, for symptomatic we unveiled 6543 components of the dominant modes with positive values, equivalent to
54.7% components mode patterns while for asymptomatic we obtained
6495 modes with positive mode-values, equivalent to 54.3% out of
11961 mode patterns. Interestingly, for symptomatic the modes with
values >0.9 turn out to correspond to the Protein Disulfide Isomerase
family A member 3 (PDIA3), Histone cell cycle regulator (HIRA), G
protein subunit alpha 13 (GNA13), S100 calcium binding protein
P (S100P), Ribosomal Protein L36a Pseudogene 37 (RPL36AP37) and for asymptomatic the unstable modes with values >0.06 turn
out to correspond to the Keratin 1(KRT1), Endoplasmic Reticulum
Aminopeptidase 2(ERAP2), and X Inactive Specific Transcript (XIST).
The instability of the gene-modes to symptomatic individuals, implies
that the correspond genes it recognizes the influenza virus and may
play a role in the etiology of respiratory viral infections. The instability
of the gene-modes to asymptomatic individuals, implies that it detect
the presence of influenza virus and may mediate viral clearance.
respectively. Modes of each gene and
their high resolution of the first 9 dominant modes in genes 4000-4010,
demonstrated in the panel (e). As shown in Figure 4a, all the log scale
singular values are greater than zero, implies that no noisy information
in the health individuals genes expression profile, but Figure 3a which
is the singular values from the infected individuals genes expression
profile had four noisy information represented by an open circles. The
eigenvalues for both Figures 3a and 4b are mostly distributed in the
negative real part and are symmetric distributed in the imaginary part,
showing that most of the DMD mode decayed and have controlled with
oscillation. However, as shown in Figures 3c and 4c, the symptomatic
individual contain more real positive eigenvalues with large magnitude
comparing to asymptomatic individuals genes expression profile.
The higher resolution between 4000-4010 gene-modes shows that in
each gene mostly contains both the negative and positive modes for
symptomatic while for asymptomatic mostly has only one sign (negative/
positive) mode (see the higher resolution in Figures 3a and 4e). The
magnitude of the modes for symptomatic and asymptomatic individuals
are in the interval (-0.4,0.4) and (-0.1,0.1), respectively as shown in Figures 3a and 4e. What is more, for symptomatic we unveiled 6543 components of the dominant modes with positive values, equivalent to
54.7% components mode patterns while for asymptomatic we obtained
6495 modes with positive mode-values, equivalent to 54.3% out of
11961 mode patterns. Interestingly, for symptomatic the modes with
values >0.9 turn out to correspond to the Protein Disulfide Isomerase
family A member 3 (PDIA3), Histone cell cycle regulator (HIRA), G
protein subunit alpha 13 (GNA13), S100 calcium binding protein
P (S100P), Ribosomal Protein L36a Pseudogene 37 (RPL36AP37) and for asymptomatic the unstable modes with values >0.06 turn
out to correspond to the Keratin 1(KRT1), Endoplasmic Reticulum
Aminopeptidase 2(ERAP2), and X Inactive Specific Transcript (XIST).
The instability of the gene-modes to symptomatic individuals, implies
that the correspond genes it recognizes the influenza virus and may
play a role in the etiology of respiratory viral infections. The instability
of the gene-modes to asymptomatic individuals, implies that it detect
the presence of influenza virus and may mediate viral clearance.

Figure 4: DMD decomposition of 128 genes expression levels of 8 asymptomatic individuals in the 11961 genes. A. The top left panel (a) shows, on a log scale, the information captured in each mode from the SVD decomposition (log(σk)) where sk are the diagonal elements of σ. B. Panel (b) is the 127 eigenvalues (ωk>0) used in the solution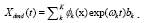 Eigenvalues with
 represent the growth modes. C. The panel (c) is the histogram DMD distribution of eigenvalues (ωk>0) D. The top right panel (d) shows the DMD modes(Φk(x)) from the 11961 genes and the first 5 high resolution mode of the genes between 4000-4010. E. Panel (e) is the DMD mode in each gene and the high resolution of the first 9 DMD modes in each gene of the ten genemodes (4000 -4010).
Conclusion
The DMD discards the microscopic details from noises and occasional events and preserves the macroscopic information of the gene expression profile data. It decouples the measure of the gene’s occurrence positions and transcription responses from the environmental conditions and or disease state. In this work, first, we conducted the DMD in each gene expression profile to distinguish the infected and healthy individuals by considering the existence of at least one real positive eigenvalue as a detector for an infected symptomatic individuals after the H3N2 injection. It found nine infected symptomatic individuals, and the remaining eight are healthy. Then, we unite the infected (healthy) into one gene expression profile for collective symptomatic (asymptomatic) pattern extractions.
The patterns obtained correspond to the recognition receptors. For example, in collective symptomatic individuals, 20 eigenvalues are positive and correspond to growing modes, i.e., it has positive dominant DMD modes, corresponding to an increase of the receptors (PDIA3, HIRA, GNA13, S100P, RPL36AP37) response triggered by the replication of the virus and generating exacerbated local immunity responses resulting in acute infection and increased pathogenesis. In the collective asymptomatic individuals, two eigenvalues are positive with positive dominant modes, corresponding to the receptors (KRT1, ERAP2, XIST) response that activates the innate immune response and subsequently promotes the viral clearance. As mentioned in the introduction, Huang, et al. reported the analysis of genes expression profile after influenza A injection and the active genes reported are concordant with those found in Zaas, et al. report. We have compared the genes found by Huang, et al. with the genes corresponding to the positive components of DMD modes found in this paper. There exists almost non-overlap between those genes. We hope in future work one can get some interesting findings by comparing the biological functions of the genes found in this paper with those listed in Huang, et al. report. A Deep understanding of these patterns distinguishes the symptomatic from the asymptomatic in influenza A virus and sheds new light on emerging acute respiratory distress like a currently novel Coronavirus disease-19. Hence, if the time-course gene expression profile is available. one can straightforwardly extend this approach to other diseases, such as cancer and COVID-19.
Funding
This research received no external funding.
Conflicts of Interests
The authors declare no conflict of interest.
References
- Whitfield ML, Sherlock G, Saldanha AJ, Murray JI, Ball CA, et al. (2002) Identification of genes periodically expressed in the human cell cycle and their expression in tumors. Mol Biol Cell 33:1977-2000.
- Shimamura T, Imoto S, Yamaguchi R, Fujita A, Nagasaki M, et al. (2009) Recursive regularization for inferring gene networks from timecourse gene expression profiles. BMC Syst Biol 3:41.
- Kauffman SA (1969) Metabolic stability and epigenesis in randomly constructed genetic nets. J Theor Biol 22:437-467.
- Thomas R (1973) Boolean formalization of genetic control circuits. J Theor Biol 42:563-585.
- Bornholdt S (2008) Boolean network models of cellular regulation: prospects and limitations. J Roy Soc Inter 5:S85-S94.
- Friedman N, Linial M, Nachman I, Pe’er D (2000) Using Bayesian networks to analyze expression data. J Comp Biol 7:601-620.
- Hartemink AJ, Gifford DK, Jaakkola TS, Young RA (2000) Using graphical models and genomic expression data to statistically validate models of genetic regulatory networks. Biocomp 7:422-433.
- Imoto S, Kim S, Goto T, Aburatani S, Tashiro K, et al. (2003) Bayesian network and nonparametric heteroscedastic regression for nonlinear modeling of genetic network. J Bioinform Comp Biol 1:231-252.
- Zou M, Conzen SD (2005) A new Dynamic Bayesian Network (DBN) approach for identifying gene regulatory networks from time course microarray data. Bioinform 21:71-79.
- Needham CJ, Bradford JR, Bulpitt AJ, Westhead DR (2007) A primer on learning in Bayesian networks for computational. PLoS Comput Biol 3:e129.
- Werhli AV, Husmeier D (2007) Reconstructing gene regulatory networks with Bayesian networks by combining expression data with multiple sources of prior knowledge. Stat Appl Gen Molec Biol 6:86-95.
- Heckerman D (2008) A tutorial on learning with Bayesian networks. Innov Bayes Net 7:33-82.
- Holter NS, Maritan A, Cieplak M, Fedoroff NV, Banavar JR (2001) Dynamic modeling of gene expression data. Proc Natl Acad Sci. 98:1693-1698.
- Linel P, Wu S, Deng N, Wu H (2014) Dynamic transcriptional signatures and network responses for clinical symptoms in influenza infected human subjects using systems biology approaches. J Pharmacokinetic Pharmacody 41:509-521.
- Holter NS, Mitra M, Maritan A, Cieplak M, Banavar JR, et al. (2000) Fundamental patterns underlying gene expression profiles: simplicity from complexity. Proc Natl Acad Sci 97:8409-8414.
- Tarca AL, Romero R, Draghici S (2006) Analysis of microarray experiments of gene expression profiling. American J Obstetr Gynec 195:373-388.
- Wu S, Liu ZP, Qiu X, Wu H (2014) Modeling genome-wide dynamic regulatory network in mouse lungs with influenza infection using high-dimensional ordinary differential equations. PloS one 9:e95276.
- Lu T, Liang H, Li H, Wu H (2011) High-dimensional ODEs coupled with mixed-effects modeling techniques for dynamic gene regulatory network identification. J American Stat Assoc 106:1242-1258.
- McDowell IC, Manandhar D, Vockley CM, Schmid AK, Reddy TE, et al. (2018) Clustering gene expression time series data using an infinite Gaussian process mixture model. PLoS Comput Biol 14: e1005896.
- Hou J, Ye X, Feng W, Zhang Q, Han Y, et al. (2022) Distance correlation application to gene co-expression network analysis. BMC bioinform 23:1-24.
- Mortezapour M, Tapak L, Bahreini F, Najafi R, Afshar S (2023) Identification of key genes in colorectal cancer diagnosis by co-expression analysis weighted gene co-expression network analysis. Comput Biol Med 106779.
- Stuart JM, Segal E, Koller D, Kim SK (2003) A gene-coexpression network for global discovery of conserved genetic modules. Science 302:249-255.
- Steuer R, Kurths J, Daub CO, Weise J, Selbig J (2002) The mutual information: detecting and evaluating dependencies between variables. Bioinform 18:S231-S240.
- Chi YY, Ibrahim JG, Bissahoyo A, Threadgill DW (2007) Bayesian hierarchical modeling for time course microarray experiments. Biometr 63:496-504.
- Kojima K, Yamaguchi R, Imoto S, Yamauchi M, Nagasaki M, et al. (2010) A state space representation of VAR models with sparse learning for dynamic gene networks. Gen Inform 22:56-68.
- Hirose O, Yoshida R, Imoto S, Yamaguchi R, Higuchi T, et al. (2008) Statistical inference of transcriptional module-based gene networks from time course gene expression profiles by using state space models. Bioinformatics 24:932-942.
- Sherehe S, Huiyun W, Changgui G, Huijie Y, (2022) Information flow between stock markets: A koopman decomposition approach. Chin Phys B 31:1-9.
- Schmid PJ (2010) Dynamic mode decomposition of numerical and experimental data. J Flu Mech 656: 5-28.
- Kutz JN, Brunton SL, Brunton BW, Proctor JL (2016) Dynamic mode decomposition: data-driven modeling of complex systems.SIAM.
- Tu JH, Rowley CW, Luchtenburg DM, Brunton SL, Kutz JN (2013) On dynamic mode decomposition: Theory and applications. ProQuest.
- Zaas AK, Chen M, Varkey J, Veldman T, Hero III AO, et al. (2009) Gene expression signatures diagnose influenza and other symptomatic respiratory viral infections in humans. Cell host & micr 6:207-217.
- Huang Y, Zaas AK, Rao A, Dobigeon N, Woolf PJ, et al. (2011) Temporal dynamics of host molecular responses differentiate symptomatic and asymptomatic influenza a infection. PLoS Gen 7:e1002234.
- Alter O, Brown PO, Botstein D (2000) Singular value decomposition for genome-wide expression data processing and modeling. Proc Natl Acad Sci 97:10101-10106.
- Wall ME, Rechtsteiner A, Rocha LM (2003) Singular value decomposition and principal component analysis, in: A practical approach to microarray data analysis. Springer 91-109.
- Almatrrouk S, Saba I, Abozaid S, Al-Qahtani AA, Al-Ahdal MN (2021) Virus sensing receptors in cellular infectivity of influenza a virus. J Infec Devel Countr 15:1-8.
- Liu Y, Olagnier D, Lin R (2017) Host and viral modulation of RIG-Imediated antiviral immunity. Front Immunol 7:662.
- Rehwinkel J, Gack MU (2020) RIG-I-like receptors: their regulation and roles in RNA sensing. Nat Rev Immun 20:537-551.
- El-Zayat SR, Sibaii H, Mannaa FA (2019) Toll-like receptors activation, signaling, and targeting: an overview. Bullet Natl Resear Cent. 43:1-12.
- Ioannidis I, Ye F, McNally B, Willette M, Flao E (2013) Toll-like receptor expression and induction of type I and type III interferons in primary airway epithelial cells. J Virol 87:3261-3270.
- Proell M, Riedl SJ, Fritz JH, Rojas AM, Schwarzenbacher R (2008) The Nod-Like Receptor (NLR) family: a tale of similarities and differences. PloS one 3:e2119.
- Sirard JC, Vignal C, Dessein R, Chamaillard M (2007) Nodlike receptors: cytosolic watchdogs for immunity against pathogens. PLoS Pathog. 3:e152.
- Zhong Y, Kinio A, Saleh M (2013) Functions of nod-like receptors in human diseases. Front Immunol 4:333.
- Everitt B, Dunn G (2001) Applied multivariate data analysis. Wiley.
- Krake T, Reinhardt S, Hlawatsch M, Eberhardt B, Weiskopf D (2021) Visualization and selection of dynamic mode decomposition components for unsteady flow. Vis Inform 5:15-27.
Citation: Semba S, Wan H, Gu C, Yang H (2023) Dynamical Patterns in Gene Expression Proile After Inluenza A Virus Injection. Diagnos Pathol Open S13:003. DOI: 10.4172/2476-2024.8.S13.003
Copyright: © 2023 Semba S, et al. This is an open-access article distributed under the terms of the Creative Commons Attribution License, which permits unrestricted use, distribution, and reproduction in any medium, provided the original author and source are credited.
Share This Article
Open Access Journals
Article Tools
Article Usage
- Total views: 1206
- [From(publication date): 0-2023 - Apr 07, 2025]
- Breakdown by view type
- HTML page views: 972
- PDF downloads: 234