Special Issue Article Open Access
Dynamic Torque and Soil Deformation Mechanics and Simulation of the GAP Virtual Machinery
Samuel Frimpong1*, Ying Li2 and Raymond Suglo3
1Department of Mining and Nuclear Engineering, Missouri S&T, Rolla, MO 65409, Room 226 McNutt Hall, 1870 Miner Circle, USA
2Structural Engineer, Caterpillar Global Mining, 1100 Milwaukee Avenue, South Milwaukee, WI 53172, USA
3University of Mines and Technology, P.O. Box 237, Tarkwa, Ghana
- *Corresponding Author:
- Samuel Frimpong
Department of Mining and Nuclear Engineering
Missouri S&T, Rolla, MO 65409
Room 226 McNutt Hall
1870 Miner Circle, USA
Tel: 573-341-7617
Fax: 573-341-6934
E-mail: frimpong@mst.edu
Received Date: January 15, 2013; Accepted Date: January 17, 2013; Published Date: January 26, 2013
Citation: Frimpong S, Li Y, Suglo R (2013) Dynamic Torque and Soil Deformation Mechanics and Simulation of the GAP Virtual Machinery. J Powder Metall Min S1:002. doi: 10.4172/2168-9806.S1-002
Copyright: © 2013 Frimpong S, et al. This is an open-access article distributed under the terms of the Creative Commons Attribution License, which permits unrestricted use, distribution, and reproduction in any medium, provided the original author and source are credited.
Visit for more related articles at Journal of Powder Metallurgy & Mining
Abstract
Global crude oil demand is growing at a faster rate than supply. Many conventional oil fields have peaked in
the middle of a growing demand across the globe. Oil sands and heavy oil reserves will provide partial solution to this problem in the foreseeable future. Research is thus required to provide answers to difficult and challenging problems associated with the economic extraction of oil sands. The ground articulating pipeline (GAP) system is a novel and potential technology being considered for oil sands production. This paper deals with some results of the current research initiatives on the GAP system dynamics and machine-oil sands interactions. Mathematical models governing the GAP mechanism and the oil sand terrain dynamics are modeled based on the theory of multi-body and soil mechanics, which are derived from Newton-Euler dynamics. These models consist of the GAP dynamic model for analyzing the dynamic driving torque of the system, GAP track-oil sand contact model for generating the contact force between oil sands and track and load-deformation oil sand model for capturing the dynamic behavior of oil sands. The results are used to develop 3D virtual prototype simulators using the ADAMS software. The virtual prototype models are validated using real-world data to generate the driving torque for the various GAP machine carriages and the dynamic response of the oil sands to carriage motion. The simulation results of the effect of the
friction between oil sands ground and carriage, the angular velocity of the pipeline and the load applied to each machine carriage on the driving torque show that the load and friction have a greater influence on the driving torque value than angular velocity. The interactions between oil sands and tracks at an environmental temperature of 25°C are analyzed in detail under visco-elastic material conditions. The simulation result of the effect of load on oil sand deformation indicates that maximum deformation value increases non-linearly with load varying from 0 to 60t. The research results provide fundamental insights into the effective deployment of the GAP machinery in the tough oil sands conditions.
Keywords
Ground articulating pipeline; Oil sands terrain; Dynamic modeling; Driving torque; Virtual prototype simulation; Loaddeformation
Introduction
Bitumen production from oil sands has become a viable economic venture given the success of current extraction from the Athabasca oil sands formations. Current and future investments in oil sands projects and the interests in the US tar sand deposits have energized research and technology interests for bitumen extraction from these sands. Projected production from Canadian oil sands could reach about 3 million barrels a day in the decade [1]. In the United States, successful production technologies could reduce significantly foreign imports by 50% over 80 years and 20% over 200 years [2]. Research and conceptual development are currently ongoing to develop the novel GAP technology for economic extraction of tar sands and heavy oil reserves [3-7]. This technology will be used to transport tar sands slurry from production faces to existing hydro-transport networks. The conceptual design of this technology faces three major problems, including (i) tar sands multi-phase problems in the GAP pipelines; (ii) dynamics of the GAP system and (iii) the GAP-oil sands interactions. Current research is geared toward the creation of a conceptual design of the GAP system using virtual simulation [3,5-8]. A physical simulator [8] has been developed for conceptual design examination and performance analysis of the GAP system based on the kinematics and dynamics of machinery and the ADAMS software. The system motion has been visualized in a virtual environment, with preliminary measurements of the system angular and linear displacements, forces and driving torques. Further investigations are being carried out to define and analyze the driving torque variations with angular velocity, friction coefficient and load, as well as, the GAP system-oil sands interaction for examining the bearing capacity of the oil sand terrain. The ability of the GAP system to maneuver the difficult and challenging terrain conditions in the high-temperature conditions of the summer months will lend credibility to its performance and the overall acceptance of this technology as a viable alternative to current production methods.
The GAP system-oil sands interaction can be simulated using static and dynamic models. The static model is usually proposed based on some empirical pressure-sinkage relationship [8]. This model can only be employed to estimate the static sinkage of motionless vehicles with a loading surface of uniform normal pressure and without horizontal load. In practice, oil sand terrain is subjected to dynamic loads in vertical or horizontal directions due to the movement of carriage on oil sand surface. Consequently, the load-deformation relationship of the oil sand terrain cannot be predicted exactly by the static model. To overcome the limitations of the static model, a dynamic model [9] has been proposed to model and simulate a tracked vehicle moving on soil. It is believed that the behavior of oil sands can be understood better if it is modeled and simulated by using a dynamic model with which dynamic loads can be applied on the oil sand terrain when the system moves. To achieve this objective, the GAP dynamics, track-oil sand contact and load-deformation oil sand models are developed using the Newton-Euler formulations. The main objectives of this paper are developing the: (i) dynamic torque model for the GAP carriages; (ii) track-oil sands contact force model; (iii) load deformation model; and (iv) virtual prototype model and simulation of the GAP-oil sands formation interactions.
The first two models are multi degrees-of–freedom (DOF) and non-linear multi-body dynamic systems [10] and they yield the system kinematics and dynamic equations of driving torque and contact force. The load-deformation oil sand model is treated as a mass-spring-dashpot system with two DOF with the help of the fundamentals of soil dynamics [11]. This model can be used to analyze the behavior of oil sands with applied dynamic loading, which yields 3D load-deformation equations using Newton-Euler formulation. The resulting equations are used to develop 3D virtual prototype simulators of the GAP-oil sands system within the ADAMS software environment [12,13]. These simulators are used to examine the influence of the friction coefficient, angular velocity and load on the driving torque, the load-oil sand deformation relationship and the effect of elastic modulus on oil sand deformation. The GAP-oil sands formation geometry, dynamic torque of the GAP-formation Interactions and the virtual prototype modeling and simulation and the results are discussed below with conclusions at the end.
The gap-oil sands system structure
Figure 1 shows a 3D dynamic model of the GAP system created within ADAMS. The system consists of a series of rigid pipelines, including water pipelines and slurry pipelines, one fixed pipeline and one mobile slurry system. These pipelines are connected by constraints (ball joints). The system, containing seven articulated joints, has one end anchored to the mobile slurry system and the other end to a fixed pipeline. The pipelines are supported and maneuvered by carriages. Based on the work by Frimpong et al. [2], two driving torques have to be provided by the master carriage at various joints [8]. The GAP system moves on soft homogeneous oil sands terrain with large surface deflection during operation. The design parameters for the GAP dynamic model comprise basic dimensions and data based on the conceptual design results in table 1 [8,6]. To accommodate a shovel advance of 120 m per week estimated in the GAP conceptual design, the displacement of the mobile slurry system is 120 m and the angular displacement of each unit is 60°. Figure 2 illustrates the carriage-oil sand interaction model for studying the interaction of carriage with oil sands. This model accounts for the pitch, bounce and roll (tramp) of the carriage, the bounce of two front wheels, and the bounce and pitch of the oil sands. The model comprises two sub-systems: carriage model and oil-sand model. The carriage model is an eight-DOF multi-body system; six DOFs are introduced by the basic Newton-Euler rigid body model accounting for the dynamics of vehicle body [9] and the other two DOFs are introduced by the revolute joints connecting the carriage to two sprockets. Two torques are applied to the sprockets through two revolute joints. The oil sands model is created as continuous elastically supported units connected by spherical joints. Every unit has two springs and two dashpots with two DOFs. The interface between the carriage and the oil sand models is carriage-oil sands interface, which is connected by using contact constraint.

Figure 1: Conceptual Design of the GAP System.

Figure 2: Scheme of GAP Carriage-Oil Sand Interaction Model.
| Pipeline diameter (m) [10] | 0.62(slurry), 0.45(water) | Pipeline material [8] | Steel |
|---|---|---|---|
| Pipeline angle displacement(degree) [8] | 0-60 | Specific gravity (m/s2) [10] | 1.6 (slurry), 1 (water) |
| Mobile slurry displacement (m/week) [10] | 400 | Pipeline unit length (m) [10] | 60 |
| Viscous damping coefficient [8] | 0.7 | Coulomb friction constant [8] | 0.75 |
Table 1: GAP Design Parameters.
Dynamic torque and gap-formation interaction mechanics
The mathematical model of the GAP-oil sand consists of three sub-models. The first is the dynamic model of the GAP machinery that is created to capture the driving torque on the machinery. The second is the track-oil sands contact model that is established to generate contact force between oil sands and track based on a multi-body dynamics system. The third is the load-deformation model that is built to calculate the deformation of oil sand based on a mass-spring-dashpot system. The three models are based on five assumptions, including that (i) all system components are assumed as rigid bodies and that large deformation is unsafe [10] (ii) the GAP system moves on a homogeneous and leveled oil sand terrain (iii) oil sands are visco-elastic material (although this assumption is not totally true, deformation calculated using elasticity theory is generally acceptable for low loads) (iv) the track is rigid body without lug and (v) springs and joints are massless.
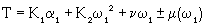
Dynamic torque model of the GAP carriages: The GAP system is reduced into a schematic diagram of the mechanism for generating the driving torque in the joints of the GAP model. The driving torque is expressed as a function of friction coefficient, angle and mass. In general, the GAP mechanism is a multi-loop linkage consisting of two or more identical slider-crank mechanisms [8] shown in figure 1. Only one slider-crank mechanism is modeled in this study. Figure 3 shows the schematic diagram of the slider-crank mechanism, which makes it easier to build the coordinate system. A fixed pipeline (link 0), two pipe arms (links 1 and 2), one slaver carriage (link 3), and four joints (revolute joints 1-3 and translational joint 4) constitute a slider-crank linkage. The coordinate system chosen for the joints is based on the Hartenberg and Denavit conditions. The coordinate (x0, y0, z0) is attached to the fixed pipeline at point O. It serves as the reference coordinate system. The coordinate (x1, y1, z1) is attached to joint 1 at point O. Similarly (x2, y2, z2) is attached to joint 2 at point A and (x3,y3, z3) to joint 3 at point B with the same sense of direction as (x0, y0, z0). When one driving torque is applied to joint 1 by a master carriage, the system will input one rotational movement ω1 about z1 of the coordinate system (x1,y1,z1). ω1 is positive in direction of the z1 axis. ri and θi are assumed as the length of link i and the angle between the x0 axis and the xi axis, respectively. θi has a positive sign in the clockwise direction and a negative sign in the reverse direction.

Figure 3: Schematic Diagram of the Slider-Crank Mechanism.
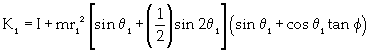
Based on the schematic diagram of slider-crank mechanism created in figure 3, the dynamic equations can be obtained by applying Newton-Euler method. The required crankshaft torque, T, during a complete mechanism cycle can be expressed as equation 1 by solving Newton-Euler dynamic equations as shown by Wilson and Sadler [11], and Nagchaudhuri [12,13].
 (1)
(1)
 (2)
(2)
 (3)
(3)
 (4)
(4)
 (5)
(5)
 (6)
(6)
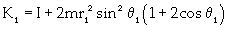
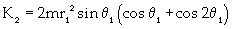
ν is the coefficient of viscous damping; μ is the coefficient of coulomb friction. When ω1 is along (opposite to) the direction of z1 axis, μ is positive (negative); I is the inertia moment of the pipeline; and m is the reciprocating mass located at point B. For the GAP system, θ1 = θ2 and r1=r2, and equations 4, 5 and 6 can be simplified as equations 7, 8 and 9, respectively.
 (7)
(7)
 (8)
(8)
 (9)
(9)
Substituting equation 9 into equations 7 and 8 yields equations 10 and 11.
 (10)
(10)
 (11)
(11)
The driving torque of the GAP system can be obtained using equations 1, 2, 3, 10 and 11. As illustrated by these equations, the dynamic torque is proportional to the mass, angular displacements and velocities and friction between carriage and the oil sands terrain. Thus, the torque requirements of the GAP system must be examined in detail using varying parameters of these dependent variables.
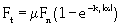
Track-oil sands contact: Figure 4 illustrates the three components of the contact force generated as the GAP track system interacts with the oil sand terrain. They are the normal reaction, Fn, lateral resistance, Ft, and longitudinal reaction, Fl, forces. The contact force between track and oil sand has a component that acts in the direction of contact normal at the track-oil sands contact patch. This component is used to calculate the normal reaction. The contact force is dependent on oil sand deflection and its rate of change, both measured along the track normal vector. The deflection and rate of change are obtained by the stiffness and damping of the oil sand model. The normal reaction function [13] is then given by equation 12.
 (12)
(12)

Figure 4: Track Forces.
k is the oil sand normal stiffness, δ is the oil sand deflection, c is the oil sand damping constant, and ∂δ /∂ t is the deflection velocity at the contact point. The lateral resistant force is caused by the track sliding laterally on deformable oil sands with noticeable sinkage. The lateral resistant force is related to the normal load through a coefficient of lateral resistance, which is the coefficient of friction changing from the initial static to the instantaneous dynamic condition. The lateral resistance [10] can be obtained by equation 13.
 (13)
(13)
μ is the friction coefficient between track and oil sand terrain, kt is the oil sand lateral stiffness, and α is the track slip angle. The traction force and motion resistance together constitute the track longitudinal reaction. The traction force is calculated by multiplying the coefficient of friction with the normal reaction. The motion resistance is mainly due to the track-oil sand interaction. It can be determined by multiplying the coefficient of motion resistance, f, with the normal reaction. The longitudinal reaction [10] can be written as equation 14.
 (14)
(14)
Equations 12 to 14 gives the three components (normal reaction, lateral resistance and longitudinal reaction forces) of contact force generated as the GAP track system interacts with the oil sand terrain. They constitute the track-oil sands interactions. Their magnitudes provide traction, buoyancy and efficient torque requirements.
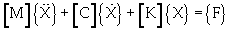
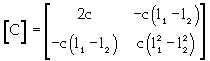
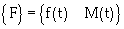
Load-deformation model: The oil sands load-deformation model is created as a continuous system with a finite number of units connected by spherical joints. Figure 5 shows a unit model with two DOFs, which have been idealized to a simple mass-spring-dashpot system. This unit will undergo translation (bounce) and rotation (pitch). The mass is equal to the mass of an oil sand unit and the spring represents the elastic properties of the oil sands. The spring stiffness k represents the elastic modulus, E, of the oil sands. The dashpot represents the damping characteristic of the oil sands. The oil sand unit is subjected to a contact force when the carriage moves on it. Based on Newton’s second law [11], the equation of deformation for the unit can be formulated as equation 15.
 (15)
(15)
 (16)
(16)
 (17)
(17)
 (18)
(18)
 (19)
(19)
 (20)
(20)

Figure 5: Load-Deformation Model.
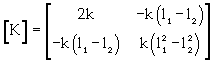
[M] is the mass matrix; m is the mass of oil sand unit; J is the mass moment of inertia about the center of gravity; [C] is the dashpot coefficient matrix; [K] is the stiffness matrix; {X} is the displacement vector, {X}={x}, x is the linear displacement of the center of gravity, and θ is the angular displacement of the unit; {F} is the external force vector; f(t) is the external force applied to the unit; and M(t) is the moment applied to the unit. Equation 15 combines motion, damping and mechanical deformation of oil sands. The deformation of oil sands can be calculated by mass, elastic modulus and damping characteristic of oil sand unit (Figure 5). The sum of all oil sand units shown in figure 2 gives the oil sands load-deformation of the GAP system.
Virtual prototype modeling and simulation
The virtual prototype models of the GAP-oil sand interaction models are developed and simulated in the ADAMS environment. The prototype development and simulation procedures are illustrated in figure 6. These procedures are summarized in a 4-step process including modeling, kinematics simulation, dynamic simulation, and refining and plotting results as described below.

Figure 6: Simulation Procedure.
Step 1 (Modeling): This involves the creation of the motion (assembly) model that contains all the necessary information for performing a dynamic simulation. The assembly is fully defined with respect to mass and inertial properties, external forces and moments and joints.
Step 2 (Kinematics simulation): The model characteristics are measured and a number of simulation runs are performed on the model to investigate the system performance under various operating conditions. The results are then animated to replay the frames that the model calculated during the simulation runs. The animation results are reviewed to understand component movements within the model.
Step 3 (Dynamic simulation): This step involves the addition of damping or friction, definition of flexible bodies and controls and implementation of force functions for simulating the prototype simulators and then examining the results with test data.
Step 4 (Refining and plotting): The design parameters are adjusted to improve system performance, and the results are plotted within a time period of interest. The virtual prototype models are validated with real-world data (in tables 1-3) from Syncude’s hydro-transport system and slurry physics and rheology.
| GAP Component | Mass (kg) | Inertia moments (kgm2) |
|---|---|---|
| Pipeline | 1.55´105 | 4.74´107 |
| Carriage | 3000 | 3900 |
| Mobile Slurry | 9.75.´105 | 8.12´106 |
Table 2: Mass and Inertial Properties of the GAP System [6].
| Each track belt width (m) | 0.8 | Oil sand damping constant (KNs/m) | c= ~120 |
| Each track belt length (m) | 3 | Friction coefficient | m=1.8-1.5 |
| Oil sand normal stiffness content(MN/m) | k= ~20 | Motion resistance coefficient | f =1 |
| Oil sand lateral stiffness content (MN/m) | kt=~20 |
Table 3: Parameters of Track Belt and Oil Sands [7].
Results and Discussions
Figure 7 shows a virtual GAP prototype simulator on an oil sands terrain within the ADAMS environment. The required torque-time curves, dynamic response of oil sand terrain to carriage and load-deformation relationship are obtained via simulation and animation based on the design parameters and the mass and inertial properties in tables 1 and 2.

Figure 7: The GAP System Simulator in ADAMS Environment.
Dynamic torque simulation
The virtual GAP prototype simulator is simulated over an extended period of time to study the mechanical behavior of the system. When the GAP model moves through one complete cycle, a forward motion of the mobile crusher extends 120 m. Figures 8a and 8b shows the GAP system in its respective retracted and extended positions. The effects of the angular velocity of pipeline, friction coefficient between ground and carriage, and the load applied to each carriage on driving torque are examined in the virtual simulator. The relationship between angular velocity () and torque is required to define optimum angular velocities required to provide appropriate driving torques. Work cycle completion times are assumed to be 5, 6, 7, 8 and 9 days, which correspond to angular velocities of 2.78E-4, 2.32E-4, 1.98E-4, 1.74E-4 and 1.54E-4 degrees per second (d/s), respectively. The friction coefficient between ground and carriage is 0.7. The load applied to each carriage is 80 tonnes (t). Figure 9a shows the driving torque variations with time for work cycle completion. The results show that, for a given angular velocity, the driving torque increases with time and for a given time, torque increases with angular velocity. However, the maximum torque is almost constant at 5.6E+007 Nm, which is independent of angular velocity or the work cycle completion time.

Figure 8: Animation of the GAP System Through One Work Cycle.

Figure 9: Torque-Time Relationship for the GAP System: (a) Angular Velocity, (b) Friction Coefficient and (c) Load.
The relationship between friction coefficient (μ) and torque is simulated to understand the GAP carriage-oil sands interactions for efficient operation within a work cycle completion time of 7 days. The load applied to each carriage is 80t and the friction coefficients between oil sands terrain and carriage are varied between 0.3 and 0.7. The effect of friction coefficient on torque with varying work cycle duration is shown in figure 9b. It is seen that, for a given friction coefficient, torque increases with time, and for a given time, torque increases with friction coefficient. In this case, the maximum torque is not constant; it depends on friction coefficient. The greater the friction coefficient, the higher is the maximum torque. The relationship between the applied load and torque is required to understand the appropriate load and its distribution for optimum machine performance. The work cycle completion and the friction coefficient between ground and carriage are assumed to be 7 days and 0.7, respectively. The loads on each carriage are varied between 40 and 120 t. Figure 9c shows the variation of torque with work cycle duration. For a given load, the torque increases with time, and for a given time, the torque increases with load. The maximum torque also increases with increasing load. The results indicate that both friction coefficient and load have greater influences on the maximum driving torque than angular velocity.
The mechanical properties of oil sands, however, change greatly with temperature. The friction coefficient between oil sands terrain and carriage is variable under different weather conditions; it is larger in the summer than in the winter. In order to operate the GAP system under the variable weather conditions, the driving torque has to be adjusted for changes in the friction coefficient. The higher the temperature, the greater is the driving torque. On the other hand, the load applied to the oil sands terrain varies with production capacity. The applied load and the driving torque increase with increasing production capacity. However, beyond a certain maximum driving torque, the GAP system may incur mechanical damage. In order to apply optimum driving torques, the friction coefficient and the applied load should be adjusted properly. For example, a maximum driving torque of 2.98E+007 Nm is required to drive an applied load of 80t when the system is operated in winter with friction coefficient of 0.3, as illustrated in figure 9b. However, in the summer with a friction coefficient of 0.7, a maximum driving torque of 2.85E+007 Nm is required to drive a smaller load of 40 t as illustrated in figure 9c.
Carriage-oil sands interaction simulation: Figure 10 shows a virtual prototype model of the GAP track-oil sand interaction in the ADAMS interface. In this model, two rigid track belts of carriage are placed on a flexible oil sand pavement with a base of natural soil. The load applied to each track is 30t [8]. Each track transfers its load to the pavement through the contact area. The model is validated using the data in table 3. The physical properties of oil sands were obtained at an environmental temperature of 25°C [7]. Figure 11 shows an animated output for the carriage motion during a simulation time of 86400s corresponding to the time steps of 50. The vertical distance between the carriage and the oil sand surface is continuously changing during the system operation. This dynamic deformation makes the carriage displace simultaneously in the bounce, roll and pitch directions. From the deformation contour on the surface of oil sand model, it can be seen that the oil sand terrain obviously exhibits uneven movement.

Figure 10: Virtual Prototype of GAPCarriage-Oil Sands Terrain.

Figure 11: Contour of Oil Sand Terrain to Carriage Motion for 86400s.
Figure 12 illustrates the dynamic response of the oil sand terrain to the carriage motion through 20 m displacement. The deformation fluctuates between 0 and 0.1 m. In order to calculate the bearing capacity of oil sand terrain, the study focused on the relationship between maximum deformation of 0.1 m and the load applied to the track. Figure 13 displays the load-maximum deformation relationship using an elastic modulus of 20 MPa, with varying applied loads between 0 and 60 t. The results show that the maximum deformation value increases non-linearly with load. The deformation has a maximum value of 0.335 m at the load of 60 t and a minimum value of 0 m at the load of 0 t. Figure 14 depicts the load-maximum deformation relationships with varying elastic modulus of 1, 20 and 70 MPa, and varying load from 0 to 60 t. The results show that the maximum deformation values are 0.392 m (E=1MPa), 0.335m (E=20MPa) and 0.328 (E=70MPa). The effect of elastic modulus on deformation is greater for E=1-20 MPa than for E=20-70 MPa. The elastic modulus increases with decreasing temperature, and thus, the oil sands deformation is larger in summer than in winter for a given load. The elastic modulus increases with decreasing bitumen content. Therefore oil sand deformation is larger when the GAP system is operated on oil sand surface of higher bitumen content than on oil sand surface of lower bitumen content.

Figure 12: Response of Oil Sand Terrain to GAP Carriage Through 20m Distance.

Figure 13: Load-Deformation Relationship.

Figure 14: Load-Deformation vs. Modulus of Elasticity.
Conclusions
Virtual prototype simulators are developed in the ADAMS simulation environment to examine the GAP torque requirements and the GAP carriage-oil sand terrain interactions based on the Newton-Euler multi-body dynamics and soil mechanics. The interactions of the oil sand terrain with the GAP system have been studied to understand the effects of angular velocity, friction coefficient and load on driving torque of the system. The 3D virtual prototype simulators of the GAP system and carriage-terrain are validated with real-world data. The results show that load and friction have greater influence on maximum driving torque than angular velocity. Thus, in order to reduce the driving torque of the GAP system, ground condition improvements and the reduction of system weight are very important. The dynamic simulation of track-oil sand interaction shows that the oil sand terrain deformation increases during the carriage motion. The simulation of the effect of load on oil sand deformation indicates that maximum deformation increases non-linearly with varying load from 0 to 60t. The applied load has a great influence on deformation. The simulation of the effect of oil sand properties on deformation shows that deformation is larger for lower elastic modulus. Temperature and bitumen content variations also have great influence on the oil sand deformation. Future research will expand current models to include the whole GAP load- oil sand deformation model simulation. Further developments are required for changing the load-deformation model into elastic-plastic finite element model for examining the bearing capacity of oil sands.
References
- ADOE/EUB (2003) Alberta Oil Sands. © Alberta Department of Energy and Energy and Utility Board, Edmonton, AB.
- Samuel F, Ying L (2004) Dynamic Torque Analysis of Ground Articulating Pipeline System for Oil Sands Haulage. Proc. of SCSC 2004, San Diego, CA, USA.
- Changirwa R, Rockwell MC, Frimpong S, Szymanski J (1999) Hybrid Simulation for Oil-Solids-Water Separation in Oil Sands Production. Miner Eng 12: 1459-1468.
- Samuel F, Ying L (2004) Modeling and physical simulation of the ground articulating pipeline system. 15th IASTED Conference, MarinaDel Rey, CA, USA.
- Frimpong S, Changirwa RM, Asa E, Szymanski J (2002) Mechanics of Oil Sands Slurry Flow in a Flexible Pipeline System. IJSM 16: 105-121.
- Hartenberg RS, Denavit J (1980) Kinematic Synthesis of Linkages. McGraw-Hill, NY, USA.
- Frimpong S, Ayodele RO, Szymanski J (2003) NUMSOSS: Numerical Simulation Software for Oil Sand Slurry Flow in Flexible Pipelines. Proc of SCSC 2003, Montreal, Quebec, Canada.
- Ferretti G, Girelli R (1999) Modelling and simulation of an agricultural tracked vehicle. Journal of Terramechanics 36: 139-158.
- Hegazy S Homer R, Hussain K (1999) Multi-Body Dynamics in Full-Vehicle Handling Analysis. Proc. of the Institution of Mechanical Engineers.
- Synge JL, Griffith BA (1959) Principles of Mechanics. McGraw Hill, USA.
- Wilson CE, Sadler JP (1991) Kinematics and Dynamics of Machinery, (2nd edn), Harper Collins College, New York, USA.
- Nagchaudhuri A (2002) Mechatronic Design of Slider Crank Mechanism. ASME International Mechanical Engineering Congress & Exposition. Louisiana: 1-6.
- Nagchaudhuri A (2000) Dynamic Modeling and Analysis of a Crank Slider Mechanism. Proc. of 2000 ASEE Annual Conference, USA.
Relevant Topics
- Additive Manufacturing
- Coal Mining
- Colloid Chemistry
- Composite Materials Fabrication
- Compressive Strength
- Extractive Metallurgy
- Fracture Toughness
- Geological Materials
- Hydrometallurgy
- Industrial Engineering
- Materials Chemistry
- Materials Processing and Manufacturing
- Metal Casting Technology
- Metallic Materials
- Metallurgical Engineering
- Metallurgy
- Mineral Processing
- Nanomaterial
- Resource Extraction
- Rock Mechanics
- Surface Mining
Recommended Journals
Article Tools
Article Usage
- Total views: 15195
- [From(publication date):
specialissue-2013 - Dec 03, 2024] - Breakdown by view type
- HTML page views : 10729
- PDF downloads : 4466