Diversity and Abundance of Seaweeds in Quilon Coast, Kerala, India
Received: 01-Feb-2023 / Manuscript No. jmsrd-23-89865 / Editor assigned: 03-Feb-2023 / PreQC No. jmsrd-23-89865 (R) / Reviewed: 17-Feb-2023 / QC No. jmsrd-23-89865 / Revised: 22-Feb-2023 / Manuscript No. jmsrd-23-89865 (R) / Published Date: 28-Feb-2023
Abstract
The diversity and abundance of common seaweeds from six different stations along the Quilon coast of Kerala state was carried out in the current investigation. The selection of sampling stations (Thangassery, Sarppakuzhi, Thirumullavaram, Ozhukkuthodu Seashore, Sakthikulangara and Neendakara Seashore) was on the basis of different environmental conditions and magnitude of sea weed colonization. A total of 24 species were recorded as commonly occurring in this coast. There were 12 species of green seaweeds, 8 species of red seaweeds and 4 species of the brown seaweeds. In general comparatively greater algal density was observed during the month of August (181.73g) and September (192.23g) for which the major contributors were Ulva intestinalis, Chnoospora minima and Ulva fasciata. In the case of algal diversity, the maximum number (14 species) was observed during the month of December. Pearson correlation coefficients between seaweed biomass and water quality parameters were calculated by using SPSS 16 software.
Keywords
Seaweed diversity; Algal biomass; Physico chemical parameters; Correlation
Introduction
Seaweeds are one of the important resources in the economy of many countries as they are used for the production of economically important phycocollids and form a stable item in the diet of many people. The diversity, abundance and distribution of seaweeds are influenced by various environmental factors such as exposure to desiccation, temperature, salinity, pH, oxygen and nutrients. Seaweeds belong to one of three taxonomic groups having different pigment composition: the Chlorophyta (green algae), the Ochrophyta (brown algae) and the Rhodophyta (red algae). It has been estimated that 30.1 million (wet weight) tonness of seaweeds were produced globally in 2016 [1] out of which 5% derived from natural beds and remaining produced from culture. Globally, China, Japan, Korea, Indonesia, Philippines, Malaysia and Vietnam are the top seven countries involved in seaweed production. About 90% of seaweed production is derived from culture based practices and China holds initial rank in seaweed production, with Laminaria species accounting for most of its production. China is followed by North Korea, South Korea, Japan, Philippines, Chile, Norway, Indonesia and USA [1]. Amongst 9000 species of seaweeds reported in the world [2], 1153 species including forms and varieties have been reported till date with total standing crop of 6,77,309 to 6,82,759 tons (wet weight) [3].
The coastline of India is 7516 km long. The seaweed diversity of the Tamil Nadu and Gujarat coasts were explored by the CSMCRI team [4] for their relative abundance and found that these two states are home to 366 seaweed species that cover nearly half of the total seaweed diversity of India. About 221 species of seaweeds are utilized commercially. Of these, about 145 species are used for food and 110 species for phycocolloids production. Because of its importance, seaweed investigations on diversity and abundance have been carried out. Seaweeds grow along the coastal waters of Tamilnadu, Gujarat, Andhra Pradesh, Orissa, West Bengal, Kerala, Maharashtra, Lakshadweep and Andaman Nicobar Islands. Besides, there are seaweed beds around Mumbai, Ratnagiri, Goa, Karwar and Chilka. On the other hand, Tamil Nadu coast stands for the maximum production of seaweeds [3]. Seaweed production from aquaculture was 1490 tonness fresh from the alga Kappaphycus alvarezii in 2010 [5,6]. Seaweeds like Gelidiella acerosa, Gracilaria edulis, Gracilaria dura and Enteromorpha compressa have not gone for commercial production although viable cultivation technologies for these seaweeds have been developed [3].
The coastline of Kerala is about 580 km that supports a large number of marine flora and fauna and a wealthy diversity of seaweeds. The distribution pattern of these seaweeds shows an extensive variation in the diversity seaweeds in different coastal areas. Survey was conducted in the Kerala coast and a total of 137 species were recorded [7]. The southern parts of Kerala coast are extended with rocks, bedrocks, cliffs and seawall which are appropriate for abundant growth of seaweeds. The central parts of the Kerala coast are completely protected with artificially laid stones/seawalls and shows less abundance of seaweeds. The northern most parts of Kerala coast are generally sandy with scattered rocks and bedrocks which hold up the greatest numbers of seaweeds. The diversity and luxuriant growth of seaweeds were recorded from Kerala coast by [7].
A study on seaweed diversity of the Quilon cost is of vital importance in the face of rapidly increasing anthropogenic influence on aquatic ecosystem in this region. Rich biodiversity is essential for sustaining the ecosystem. Hence, it is necessary to study seasonal variation of the distribution and abundance of seaweeds and to assess the effect of environmental factors on these algae. The objective of the investigation is to record the seaweed biodiversity of Quilon coast, Kerala with the aim of helping the administrators and academicians for sustainable management of seaweed biodiversity.
Materials and Methods
Study area
Kerala has a vast coastline which extends to about 590 km. The current study on a detailed survey of seaweed resources of the hitherto unexplored regions of Quilon region was carried out during January to December 2020. Six stations were identified as areas with different environmental conditions and magnitude of sea weed colonization (Figure 1). The Stations selected were, [A] Thangassery, [B] Sarppakuzhi, [C] Thirumullavaram, [D] Ozhukkuthodu seashore, [E] Sakthikulangara and [F] Neendakara Seashore. Station A is located at a site nearer to Thangassery light house. Here the coast is protected by rocks and cement tripods. Sewage discharge and dumping of domestic waste are prevailing around the harbor and coastal region. Station B is situated at the northern region of away from Thangassery here the shore line is characterized by laterite rocks which forms as a substratum for algal colonization. Drainage of municipal sewage is also found here. Station C is ~2 km far away from the station A and is a shallow water region. Anthropogenic activities are very high here. Station D is a region predominately of sandy nature with intermittent laterite rocks with supports high diversity of seaweeds. Human intervention and domestic waste disposal is found high in this station. Station E is situated near to the harbour and fish market and adjacent to break water region and Ashtamudi estuarine mouth. Station F is near to barmouth where the Ashtamudi Lake open to the sea and also adjacent to the Neendakara harbor. This station is exposed to wastes drained from the harbor. Sea shore is protected by sea wall made up of rocks which forms the substratum for algal colonization. All these six stations were selected for the study based on the preliminary survey conducted along the Kollam coast.
Methodology
A wooden frame of 50x50 cm quadrat was placed randomly over the area covered by seaweeds and the seaweeds were scraped and transferred immediately into separate polythene bags and the samples were brought to the laboratory. Triplicate samples were collected. The wet weight was recorded at site. Then the samples were fixed in 10% formaldehyde solution. In the laboratory vigorous shaking of the container containing the seaweeds and associated organisms preserved in formaldehyde solution dislodges most of the associated/clinging animals. The samples were subsequently transferred to plastic tray. The organisms were sorted to different groups, counted and recorded. The seaweeds were also sorted as per species, weighed and subsequently dried in oven at 80°C and again weighed. The total dry weight and wet weight of seaweeds were recorded. The collected marine algae were identified with the help of standard Taxonomic Keys and with the help of taxonomists (Oza and Zaidi, 2001) and grouped into classes such as Chlorophyceae, Rhodophyceae and Phaeophyceae (Figure 1).

Figure 1: Map Showing study area.
Results and Discussion
The list of sea weed species collected is given below
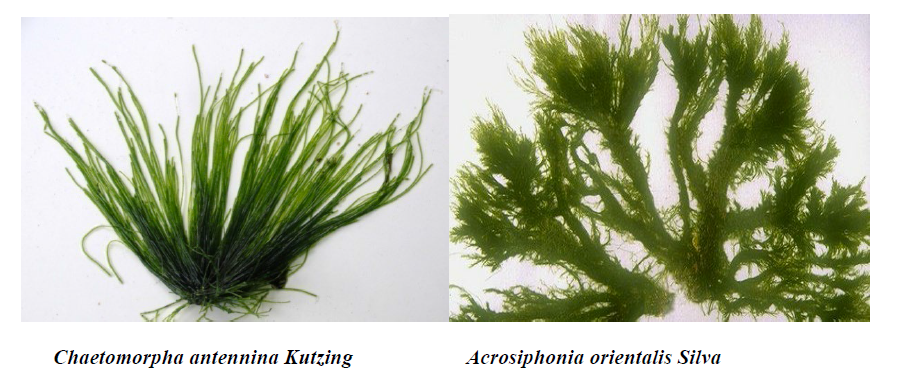
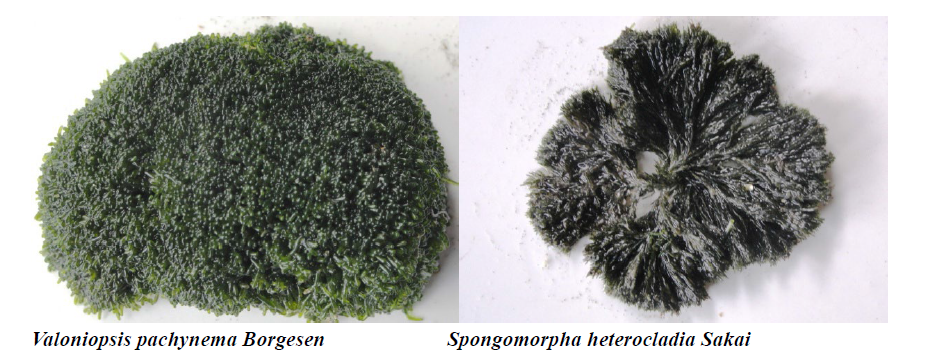
Green Algae: Chaetomorpha antennina (Bory) Kutzing 1847, Cladophora albida (Nees) Kutzing 1843, 3. Ulva lactuca Linnaeus 1753, Ulva fasciata Delile 1813, Ulva intestinalis Linnaeus 1753 (Enteromorpha intestinalis), Caulerpa chemnitzia (Esper) J.V.Lamouroux 1809 (Caulerpa peltata), Caulerpa taxifolia (M.Vahl) C.Agardh 1817, Caulerpa racemosa (Forsskal) J.Agardh, 1873, Caulerpa scalpelliformis (R.Brown ex Turner) C.Agardh 1817, Spongomorpha heterocladia Sakai 1954, Acrosiphonia orientalis (J.Agardh) P.C.Silva 1996 (= Spongomorpha indica), Valoniopsis pachynema (G.Martens) Borgesen 1934
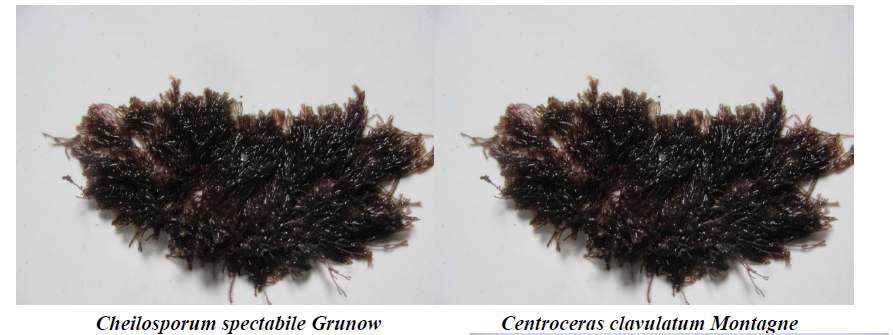
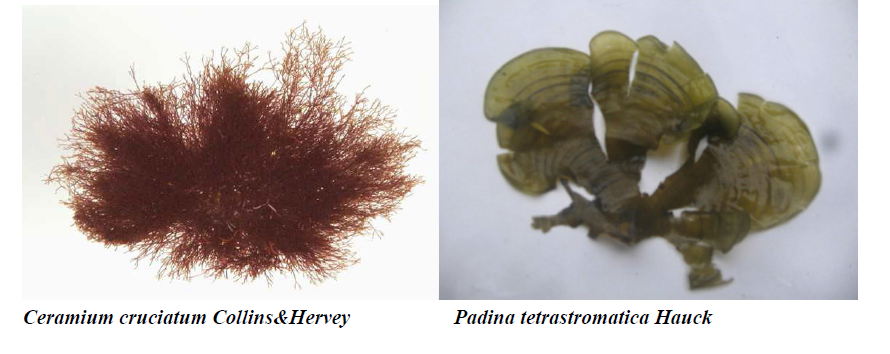
Red Algae: Gracilaria corticata (J.Agardh) J.Agardh 1852, Gelidium micropterum Kutzing 1868, Cheilosporum spectabile Harvey ex Grunow 1874, Centroceras clavulatum (C.Agardh) Montagne, 1846, Hypnea valentiae (Turner) Montagne 1841, Hypnea musciformis (Wulfen) J.V.Lamouroux 1813, Cryptonemia lomation (Bertoloni) J.Agardh 1851, Ceramium cruciatum Collins & Hervey 1917
Brown Algae: Chnoospora minima (Hering) Papenfuss 1956 (=Chnoospora fastigiata), Sargassum ilicifolium (Turner) C.Agardh 1820, Sargassum wightii Greville ex J.Agardh 1848, Padina tetrastromatica Hauck 1887.
During the study period different species of algae have been observed in the Kollam coast. The result showed that the area is rich in seaweed biodiversity. Seaweeds belonging to 3 classes, 14 orders and 14 families were collected during course of the study period from the Quilon coast. There were 7 genera of 12 species of green seaweeds, 7 genera of 8 species of red seaweeds and 3 genera of 4 species of the brown seaweeds. A total of 24 species were recorded as commonly occurring in this coast. The genera of green seaweeds were Acrosiphonia, Cheatomorpha, Caulerpa, Cladophora, Spongomorpha, Ulva and Valoniopsis. Among the green seaweeds, abundance of the genera such as Spongomorpha and Chaetomorpha was greater than that of others. The genera of brown seaweeds were Chnoospora, Padina, and Sargassum. The occurrence of genera such as Chnoospora and Sargassum was greater than that of others. The genera of red seaweeds were Ceramium, Centroceros, Cheilosporum, Cryptonemia, Gracilaria, Hypnea and Gelidium. Among these red seaweeds, occurrence of the genera such as Hypnea and Centroceros was greater than that of others.
Monthly variation in the occurrence and distribution of seaweeds was observed from different stations. The species composition also varied with stations. High diversity of seaweeds was observed from all stations during the April to May and November to December compared to other months. The lowest diversity of seaweeds in Quilon coast was observed in month of January. The most common species that occurred at all the stations throughout the period of study was Ulva fasciata belonging to the Class Chlorophyceae. All the three classes, Chlorophyceae, Rhodophyceae and Phaeophyceae were more evenly distributed only at stations A and B (Figures 2 and 3). Chlorophyceae and Rhodophyceae alone were dominant at station C (Figure 4). Algae belonging to Chlorophyceae were the most dominant flora at stations D, E, and F (Figures 5-7) throughout the year. Station F recorded only green algae throughout the study period (Figure 7). Monthly variation of total algal biomass (wet wt g/25 cm2) at different stations during the study period is given in Figures 2-7. In addition, the monthly variation of total algal biomass (wet and dry wt g/25 cm2) of individual species at different stations during 2006 is given in Tables 1-12. There were variations in diversity among stations and months. Station A and D showed the highest diversity during the April and May months, while the least diversity was found at station E during January and June (only 1 species was present). The highest diversity was recorded by the green algae. During the present investigation, 24 species of marine algae belonging to Chlorophyceae, Rhodophyceae and Phaeophyceae were encountered, which included 12 Chlorophycean, 8 Rhodophycean and 4 Phaeophycean members.

Figure 2: Monthly variation of algal biomass at Station A.

Figure 3: Monthly variation of algal biomass at Station B.

Figure 4: Monthly variation of algal biomass at Station C.

Figure 5: Monthly variation of algal biomass at Station D.

Figure 6: Monthly variation of algal biomass at Station E.

Figure 7: Monthly variation of Algal biomass at Station F.
Total biomass of algae varied across all stations. Ulva lactuca, Ulva fasciata, Chaetomorpha antennina and Gracilaria corticata were the major contributors of algal biomass during all the months studied. The magnitude of algal biomass was always least at Station F. Higher algal biomasses were observed at station A and B in January (Table 1). In February (Table 2), wet mass and dry mass reached the highest values at Station B and Station A respectively. In March (Table 3), maximum algal biomass was observed at Station E. In April (Table 4) the maximum algal biomass was noted at Station D. In May (Table 5) it showed an overwhelming increment at Station A. In June (Table 6), maximum algal biomasses were noted at Station B and Station A respectively. In July (Table 7), maximum algal biomass was noted at Station D and Station A respectively. During the month of August (Table 8) algal biomass recorded the maximum values at Station A. During the month of September, Station E had comparatively greater algal density (Table 9). In October (Table 10), the maximum algal biomass was noted at Station E and Station A respectively. During November (Table 11) maximum values were observed at Station C. During December (Table 12), algal biomass showed higher values at Station A.

Table 1: Variation of algal biomass (wt g/25 cm2) in January.

Table 2: Variation of algal biomass (wt g/25 cm2) in February.

Table 3: Variation of algal biomass (wt g/25 cm2) in March.

Table 4: Variation of algal biomass (wt g/25 cm2) in April.

Table 5: Variation of algal biomass (wt g/25 cm2) in May.

Table 6: Variation of algal biomass (wt g/25 cm2) in June.

Table 7: Variation of algal biomass (wt g/25 cm2) in July.

Table 8: Variation of algal biomass (wt g/25 cm2) in August.

Table 9: Variation of algal biomass (wt g/25 cm2) in September.

Table 10: Variation of algal biomass (wt g/25 cm2) in October.

Table 11: Variation of algal biomass (wt g/25 cm2) in November.

Table 12: Variation of algal biomass (wt g/25 cm2) in December.
In general comparatively greater algal density was observed during the month of August and September for which the major contributors were Ulva intestinalis, Chnoospora minima and Ulva fasciata. In the case of algal diversity, the maximum was observed during the month of December, during which the total number of species observed was 14, which included seven species of Chlorophyceae, two species of Phaeophyceae and five species of Rhodophyceae.
The correlation coefficient between sea weed [Chlorophyceae (C), Rhodophyceae (R), and Phaeophyceae (P)] biomass and water quality parameters are represented in (Table 13). The positively significant correlation at 1% level between sea weed biomass and water quality parameters are red highlighted. The positively significant correlation at 5% level between sea weed biomass and water quality parameters are yellow highlighted. The negatively significant correlation at 1% level between sea weed biomass and water quality parameters are blue highlighted. The negatively significant correlation at 5% level between sea weed biomass and water quality parameters are green highlighted.

Table 13: Pearson correlation coefficient matrix between water and Seaweeds biomass.
Marine microalgae, seaweeds and seagrasses are important primary producers of coastal ecosystem and also considered as outstanding carbon sequestering agents than terrestrial plants [8].Variation in the biomass and species composition of seaweeds mainly depends upon season, population structure as well as numerous other ecological factors [9,10]. Reported that the variation of seaweed biomass in related to various biotic factors which include species composition, phenological change, algal recruitment and grazing by predators. Additionally, the vegetation cover, age and height of individual plants, morphology and structure of thallus also add to the drifting of seaweeds [11]. At very low biomass, species richness is possibly restricted by abiotic factors causing low survivorship. High diversity of seaweeds was observed from all stations during the April to May and November to December compared to other months. Similar to the present observation, [12]. Reported two peak periods in biomass, one during May 2012 and the other in November, December 2012. Similarly [13]. Reported that the most suitable season for the algal growth was during the end of the winter to middle of summer.
The biomass as well as species composition of seaweeds largely depend on season, population structure and several other ecological factors [14]. In the present study the total algal biomass varied between 5.05 g/m2 and 726.92 g/m2. Wide fluctuation was also noticed between months and stations [15]. Reported from a single survey that the seaweed biomass was varying from 500 g/m2 to 6000 g/m2 from the Kerala coast. Baby [16]. Reported that the seaweed biomass varied from 50.5 g/m2 to 359 g/m2 for the whole Kerala coast. Variation in biomass is reported from various coastal areas. Island areas of the Yellow Sea, had the average seaweed biomass of 89.25 g/m2 and varies from 23.78 g/m2 to 176.68 g/m2 in the summer [17]. These studies agree with the findings made through this study. All the three classes, Chlorophyceae, Rhodophyceae and Phaeophyceae were more evenly distributed only at stations A and B. The highest diversity was recorded by the green algae. There were variations in diversity and abundance of marine macroalgae between sites and months with a total of 24 species of marine algae were recorded from Kollam coast [15]. through their investigation reported 34 species and similarly Baby [16]. Reported 37 species from Kerala coast. These reports assent with the present study. The spatial heterogeneity or habitat complexity is an environmental feature generally believed to affect species diversity directly [18]. It is usually assumed that increased habitat complexity produces increased numbers of distinct niches and consequently, allows more species to coexist [19].
In the present study, Ulva lactuca, Ulva fasciata, and Chaetomorpha antennina were dominant and contributed to high biomass. Similarly, many species of green algae of different forms which are generally stress-tolerant species present in eutrophic coastal areas [20,21]. It also indicates that carbon storage in seaweed species is species-specific in nature. The highest value is reported from E. intestinalis followed by U. lactuca and C. repens indicates the beneficial contribution made by these species from Kollam coast. This study showed that there were variations in the diversity and distribution of macroalgae between sites and seasons. Degrees of wave exposure during the wet season highly influenced the percentage cover, diversity and distribution of macroalgae. Thus, intensive investigation and experimental ecology of both physical and chemical factors (e.g. sedimentation or nutrient concentration) and biological factors (e.g. grazing or competition) will allow us to understand more about seaweed diversity and distribution. Statistical correlation indicates significant positive correlation between variation of temperature and red and brown algae. Significant negative correlation with oxygen and silicate and brown algae was observed. But such relationships were not observed uniformly between stations and species. Considerable diversity and distribution of seaweeds belonging to Chlorophyceae, Rhodophyceae and Phaeophyceae from the Quilon coast indicates that the prevailing conducive environmental conditions particularly the suitable substratum and physico-chemical parameters favorable for the growth of seaweed communities. Efforts must be taken to exploit the resources and enforce conservation measures for sustainable management.
Conclusion
vnagar. pp. 1-36.
Coastal region of southern Kerala has high diversity of seaweeds which are least explored and unexploited and can be considered as a source of food, feed, fodder, fine chemicals, agrichemicals and, medicine. This study proved that the area is rich in the diversity of seaweeds. Seaweeds belonging to 3 classes, 14 orders and 14 families were collected during course of the study period from the Quilon coast. The genera of green seaweeds were Acrosiphonia, Cheatomorpha, Caulerpa, Cladophora, Spongomorpha, Ulva and Valoniopsis. Among the green seaweeds, abundance of the genera such as Spongomorpha and Chaetomorpha was greater than that of others. The genera of brown seaweeds were Chnoospora, Padina, and Sargassum. The occurrence of genera such as Chnoospora and Sargassum was greater than that of others. The genera of red seaweeds were Ceramium, Centroceras, Cheilosporum, Cryptonemia, Gracilaria, Hypnea and Gelidium. Among these red seaweeds, occurrence the genera such as Hypnea and Centroceros was greater than that of others. Ulva lactuca, Ulva fasciata, Chaetomorpha antennina and Gracilaria corticata were the major contributors of algal biomass during all the months studied. During the month of December seven species of Chlorophyceae, two species of Phaeophyceae and five species of Rhodophyceae were observed. The station F recorded the least density and diversity among all the stations monitored. This comprehensive investigation brought to light the nature of diversity and abundance of seaweeds commonly occurring along the Kollam coast. The study also discovered the temporal variation of seaweed community along various stations in this region. Therefore this assessment of the seaweed resource will definitely contribute towards developing a planning utilization conservation of this resource.
Acknowledgements
The authors express sincere gratitude to the Department of Aquatic Biology and Fisheries, University of Kerala for all the help as well facilities provided throughout the study. We are extremely thankful to late Dr. V. Krishnamurthy, Director, Krishnamurthy Institute of Algology, Chennai, for his immense support in the identification of Algae.
References
- Anon (2018) The State of World Fisheries and Aquaculture. Meeting the Sustainable Development Goals; FAO: Rome, Italy.
- Khan W, Rayirath UP, Subramanian S, Jithesh MN, Rayorath P, et al. (2009) Seaweed extracts as biostimulants of plant growth and development. J Plant Growth Regul 28: 386–399.
- Subba RPV, Mantri VA (2006) Indian seaweed resources and sustainable utilization: Scenario at the dawn of new century. Curr Sci 91: 164-174.
- Jha B, Reddy CRK, Thakur MC, Rao MU (2009) Seaweeds of India. The Diversity and Distribution of Seaweeds of Gujarat Coast. Springer Dordrecht 215.
- Krishnan M, Narayanakumar R (2013) Social and economic dimensions of carrageenan seaweed farming in India. Food and Agriculture Organization of the United Nations, Rome, Italy, pp: 163-184.
- Periyasamy C, Anantharaman P, Subba RPV (2015) Experimental Farming of Kappaphycus alvarezii (Doty) Doty with income estimates at different sites in Mandapam Region, Palk Bay, South east Coast of India. J Appl Phycol 27: 935–944.
- Yadav SK, Palanisamy M, Murthy GVS (2015) Economically Important Seaweeds of Kerala coast, India- A Review. Elix Biosci82: 147-153.
- Zou D (2005) Effects of elevated atmospheric CO2 growth, photosynthesis and nitrogen metabolism in the economic brown seaweed, Hizikia fusiforme (Sargassaceae, Phaeophyta). Aqua 250: 726-735.
- Untawale AG, Reddy CRK, Ambiye VD (1989) Marine algal flora of submerged Angria bank (Arabian Sea). Indian J Mar Sci 18: 207-209.
- Norton TA, Mathison C, Neushul M (1982) A review of some aspects of form and function in seaweeds. Bot Mar Calif Press 25: 501-510.
- Sujatha, Sarojini YB, Lakshminarayana K (2013) Seasonal variation in the distribution of macroalgal biomass in relation to environmental factors. Int J Curr Sci 8: 21-27.
- Dadolahi SA, Garavand KM, Riahi H, Pashazanoosi H (2012) Seasonal variations in biomass and species composition of seaweeds along the northern coasts of Persian Gulf (Bushehr province). J Earth Syst Sci 121: 241- 250.
- Thakur CM, Reddy CRK, Jha B (2008) Seasonal variation in biomass and composition of seaweeds stranded along Port Okha, northwest coast of India. J Earth Syst Sci 117: 211–218.
- Krishnamurty C, Ramachandrudu VS, Kaladharan BS, Dharmaraja SK (1988) Seaweed Resources of Kerala Coast. Aqua Biol 8: 69-74.
- Baby U, Merlee TMS, Sathianandan TV, Kaladharan P (2017) Marine macroalgal resources from nine beaches along the Kerala coast, India. J Mar Biol Ass India 59: 73-81.
- Park YS, Kim YH (1990) Phytogeographical study on the summer marine algal distribution in western coast of Korea. Korean J Phycol 5:39-50.
- Dean RL, Connell JH (1987) Marine invertebrates in an algal succession. II. Test of Hypothesis to explain changes in diversity with succession. J Exp Mar Biol Ecol 109: 217-247.
- Cody ML (1981) Habitat selection in Birds: The roles of Vegetation Structure, competitors, and productivity. Bioscience 31: 107-113.
- Schramm W (1999) Factors influencing seaweed responses to eutrophication: some results from EU-project EUMAC. J Appl Phycol 11: 69-78.
- Choi HG, Lee KH, Wan XQ, Yoo HI, Park HH, et al. (2008) Temporal variations in seaweed biomass in Korean coasts: Woejodo and Jusamdo, Jeonbuk. Algae 23:335-342.
- Agarwal S, Banerjee K, Saha A, Amin G, Mitra A (2016) Can seaweed be a potential sink of carbon? . Int j res appl sci eng technol 4: 217-225.
Indexed at, Google Scholar, Crossref
Indexed at, Google Scholar, Crossref
Indexed at, Google Scholar, Crossref
Indexed at, Google Scholar, Crossref
Indexed at, Google Scholar, Crossref
Indexed at, Google Scholar, Crossref
Indexed at, Google Scholar, Crossref
Indexed at, Google Scholar, Crossref
Citation: Hashim KA, Nisha A (2023) Diversity and Abundance of Seaweeds inQuilon Coast, Kerala, India. J Marine Sci Res Dev 13: 389.
Copyright: © 2023 Hashim KA, et al. This is an open-access article distributedunder the terms of the Creative Commons Attribution License, which permitsunrestricted use, distribution, and reproduction in any medium, provided theoriginal author and source are credited.
Share This Article
Recommended Journals
Open Access Journals
Article Usage
- Total views: 2054
- [From(publication date): 0-2023 - Mar 31, 2025]
- Breakdown by view type
- HTML page views: 1794
- PDF downloads: 260