Research Article Open Access
Simulation of Spatial Distribution of Fish Species in 200 Km Stretch of Tungabhadra River on the Basis of Oxygen Variability
Chhaya Chaudhary*CSIR NET qualified (Life Science), Environmental Consultant, 1- Turner Road, Clement Town, Dehradun, Uttarakhand, India
- *Corresponding Author:
- Chhaya Chaudhary
CSIR NET qualified (Life Science), Environmental Consultant
1-Turner Road, Clement Town, Dehradun, Uttarakhand, India
Tel: 91 9808888151
E-mail: chaudharychhaya16@yahoo.com
Received date: November 29, 2013; Accepted date: January 28, 2014; Published date: February 06, 2014
Citation: Chaudhary C (2014) Simulation of Spatial Distribution of Fish Species in 200 Km Stretch of Tungabhadra River on the Basis of Oxygen Variability. J Ecosys Ecograph 4:143. doi:10.4172/2157-7625.1000143
Copyright: © 2014 Chaudhary C, et al. This is an open-access article distributed under the terms of the Creative Commons Attribution License, which permits unrestricted use, distribution, and reproduction in any medium, provided the original author and source are credited.
Visit for more related articles at Journal of Ecosystem & Ecography
Abstract
Rivers and streams have always been the major sources of drinking water for various villages and towns of developing and developed countries. India has number of rivers supplying water throughout the year. The concept of setting industries near rivers solves the problem of waste disposal. Since decades, many industries are disposing their waste water in rivers. This trend has reached to such an extent that it is adversely affecting the biological, chemical and physical aspects of the river. Heavy Discharge of effluents and sewage in a river may cause the degradation of water quality. The most important factor required for the life to exist in water is Dissolved Oxygen. An optimum amount of dissolved oxygen i.e., 6 mg/l is required for the healthy growth of ecosystem. In order to study how the effluent and sewage discharge affects the aquatic life and the spatial distribution of fish species, Dissolve Oxygen is simulated throughout the river using QUAL2K. The simulated model is then used to locate the indicator species on the river on the basis of dissolved oxygen level. Various hypothetical cases of effluent flow and the effluent loads are taken. Various hypothetical simulations are prepared showing the spatial distribution of fish species and DO level in the river stretch. These models are then compared among each other. The comparison reveals how the spatial distribution and species diversity of some fish species is varying with the variation in the effluent load and flow in the river. The best model containing maximum diversity of fish species is selected and the corresponding effluent discharge corresponding is considered to be the optimum.
Keywords
DO; Dissolved oxygen; Biochemical oxygen demand; Hypothetical; CO2 ; Carbon di oxide; m3d-1; Cubic Meter per day; Os ; Saturation dissolved oxygen; mg/L; Milligram per liter
Introduction
Fresh water is a finite resource essentially required for the existence of life on earth. Without its adequate quality and quantity sustainable development is not possible. The extents of human activities that influence the environment have increased dramatically during past decades. The general pattern of decreased prey consumption and/or feeding behaviors by fish at low dissolved oxygen concentrations has been seen for a wide range of marine, estuarine, and freshwater fishes [1]. Findlay and Kasian [2] and Kramer [3] demonstrated the importance of direct and indirect effects of excess nutrient loadings on the individual, population, and community. Breitburg [4] showed that low dissolved oxygen can directly affect nearly every aspect of predator–prey interactions, including encounter rates, percentage of time spent foraging, foraging location, attack rates, and behaviors of prey that influence their susceptibility to predation. Oxygen availability can limit activity of fishes even at saturation as the interaction of physical and biological processes often reduce DO level below saturation, oxygen is appropriately considered a resource in the sense of ecologists like [5,6]. All fishes are capable of water breathing, although their effectiveness at it, in terms of maximal rates of uptake and minimal levels in which they can still meet a given requirement, varies widely. Kramer [3], showed that a significant minority of fishes is also capable of air breathing and is therefore categorized as ‘bimodal breathers’, although they do not necessarily use both modes simultaneously. It is among the most widely introduced fish species worldwide, and a number of countries have reported negative environmental consequences in the wake of mosquito fish introduction [7].
The reduction in the fish species is because of the alteration in water quality due to point and non-point source loadings in the river. Dissolved oxygen is used by the fishes for respiration and CO2 is discharged as waste product of metabolism. The decreased oxygen concentration in water below a certain limit and an increase in CO2 tension in the medium results an unfavorable condition for fish life. They either migrate to the other region in the river where the DO level is suitable or they show mortality. Their migration to other regions also possesses threat on them, as they face more competition, predation risk, catching risk.
In this study we adopt the approach of QUAL2K model based on Streeter Phelep equation in the modeling of dissolved oxygen throughout the 200 km stretch of Tungabhadra. A database is prepared showing the tolerance level (Dissolved Oxygen, pH, Temperature) of fishes occurring in Tungabhadra. The study shows how the change in the point source loading affects the water quality in the river stretch specifically DO level and how this changed level affects the spatial distribution of the fishes inhabiting the stretch. On the basis of the database and the DO model of the river, the spatial distribution of fish species in the stretch is assessed.
Methodology
Study site
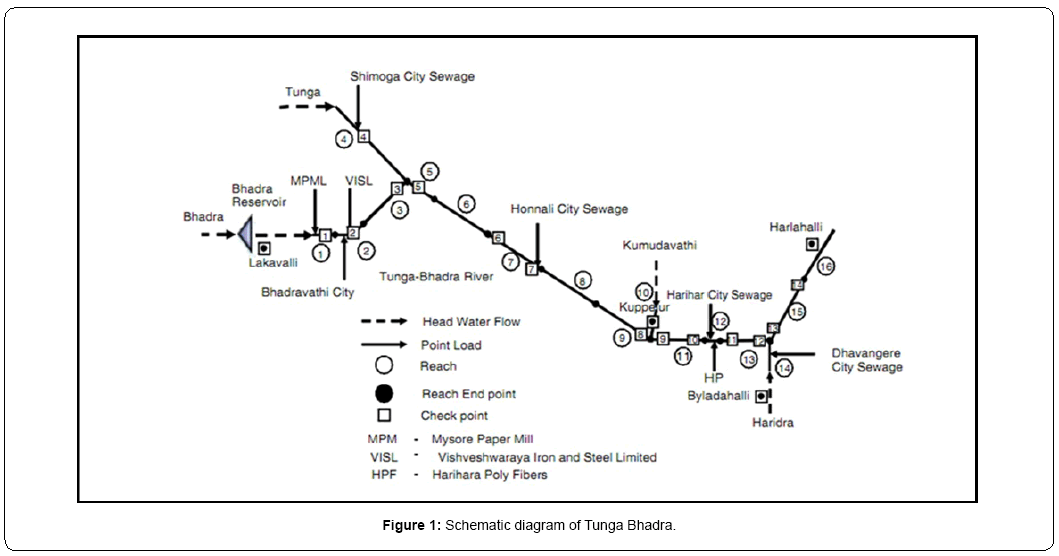
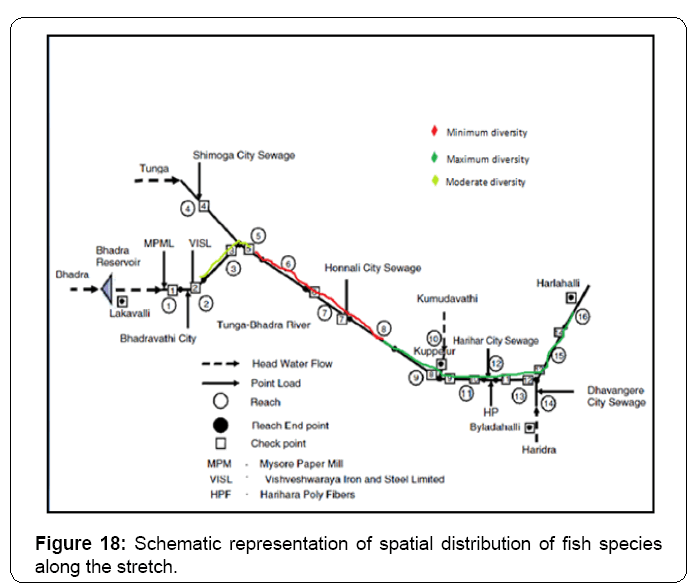
The study area includes 200 km stretch of River Tungabhadra, a peninsular river formed by the confluence of two tributaries of river Krishna, Tunga and Bhadra. The river stretch is used to study the impact of water quality due to point source discharge on the spatial distribution of fish species along the stretch. Dissolved Oxygen is considered as the major limiting factor for their spatial distribution. The river stretch receives 8 effluent and sewage discharges from the industries and cities nearby. As shown in the Figure 1, the Bhadra receives 2 effluent discharges and a sewage discharge from Vishweshwaraya Steel and Iron Limited (VISL) and Mysore Paper Mills (MPM) and Bhadravathi city, respectively. Shimoga city sewage has been discharged in Tunga. The confluence of Tunga and Bhadra forms Tunga-Bhadra, It further flows downstream and receives sewage from cities like Honalli, Harihar, Byladahalli and Devanagere. The two important indicators of health of water, zooplanktons and dissolved oxygen are considered in this study.
Adholia [8] said that High value of COD and BOD indicates high degree of organic pollution. Increasing trend of BOD and decreasing trend of DO at Bhadravathi site clearly indicates the increasing load of pollution in the stream. The pH at Bhadravathi site shows the acidic nature of water [9].The lowest DO level (5.67 mg/L) was recorded at Bhadravathi [10]. Surface water temperature is responsible for distribution of plankton [11]. Kumara [12] said that, Mining and quarrying activities, along the bank of the river Bhadra at Bhadravathi, the Mysore Paper Mills and Vishweshvarayya Iron and Steel Industries have resulted in decreased depth and increased siltation. The river has two other tributaries, Kumadavati and Haridra They join Tunga-Bhadra River from west and east directions at a distance of 84 and 124 km downstream of the junction, respectively. A study by Karnataka State Pollution Control Board [13] has highlighted pollution as result of dumping of agricultural residues/pesticides at Balehonnur in 2005 where ginger is the major crop grown which uses huge amounts of pesticides. Manjappa [14] estimated that around 15 villages in the area from Bhadravati to Kudli have been affected by industrial pollution. The study conducted by Suresh [15], considered certain biological species, both phytoplanktons and zooplanktons, also known as the bioindicators, were found only in certain zones of Tunga-Bhadra River, depending on the quality of the river water. Thus, six zones were located along the 30-km long river bank starting from Harihar town to its stream to the Sarathi Halla, near Dittur village. Shahnawaz [10] recorded only six fish species in Bhadra, They are Labeo calbasu, Osteo bramaneilli, Ompokbi maculatus, Clarias batrachus, Heteropneustes fossilis, and Oreochromismoss ambica. Fast-growing Indian major carps are the prominent commercial fishes [16]. Babu [17] stated that, the State has promoted fast-growing Indian major carps like Catla catla, Labeo rohita and Cirrhinus mrigala [18], and exotic fish like Cyprinus carpio, Hypophthalmichthys molitrix and Ctenopharyngodon idella, resulting in the decline of native fish population comprising Labeo, Cirrhinus, Puntius, Catfish, Murrels, etc [19]. The project report on the Bio – Mapping of major rivers in Karnataka carried out by Karnataka State Pollution Control Board (KSPCB) in 2006-07 [20] shows that there is change in the environmental quality of Tunga, Bhadra and Tunga-Bhadra rivers.
The manual readings of the water quality parameters at different locations on the stream can act as database for their simulation throughout the stream. Various mathematical models are given to determine the value of parameter (Dissolved Oxygen) at a particular point in the stream. These models correlate the physical parameters (depth, width, slope of the river bed, temperature) and water quality parameters (CBOD, DO, pH, alkalinity). Quantitative techniques started to be used to assess the impacts of pollutants on the river systems in 1925 when Streeter and Phelps developed a model for simulating DO in the river systems kannel [21]. Chapra [22] described a mathematical model as an idealized formulation that represents the response of a physical system to external stimuli. While similarly, [23] described a water-quality model as anything from a simple empirical relationship, through a set of mass balance equations, to a complex software suite in which a user can simulate water quality in streams and rivers by supplying physical and chemical data. Chapra and Pelletier [24] Developed QUAL2Kw, A framework for the simulation of water quality in streams and rivers, this framework includes a genetic algorithm to facilitate the calibration of the model in application to particular water bodies. It is used to find the combination of kinetic rate parameters and constants that results in a best fit for a model application compared with observed data. The study utilizes QUAL2K framework to simulate the water quality parameters (DO, BOD and Temperature) [25] throughout the river stretch. In order to predict the status of the water on the basis of ecology there, it has become very important to correlate the hydrology and biology of that area. The interaction of water quality with biological parameters gives the broader idea of the water quality and its effects [26].
Study design
The 200 km stretch of Tunga-Bhadra was divided into 16 reaches of different length on the basis of manning roughness coefficient, bed width and longitudinal slope. The Table 1 gives description of each reach.
| Point Source | Inflow (m3/s) | Temperature (°C) | Dissolved Oxygen (mg/L) | CBOD (mg O2/L) |
|---|---|---|---|---|
| MPM | 0.868 | 24.63 | 7.30 | 399 |
| Bhadravathi | 0.308 | 25.43 | 5.60 | 15 |
| VISL | 0.0579 | 25.40 | 5.55 | 275 |
| Shimoga | 0.436 | 30.85 | 2.00 | 15 |
| Honalli | 0.024 | 31.13 | 2.00 | 15 |
| Harihara | 0.129 | 31.09 | 2.00 | 15 |
| HPF | 0.5093 | 27.44 | 6.76 | 15 |
| Davangere | 0.867 | 31.80 | 2.00 | 15 |
Table 1: Reach Details Source: Karnataka Pollution Control Board [13].
This study deals with the interaction among biological parameters which includes indicator fish species and the hydrological parameters. To study the impact assessment for river faunal ecology in the river using hypothetical point source loading scenarios. The water quality parameters determined by laboratory techniques at various locations along the river can be used as database in the simulation of water quality parameter at any particular location along the river, without using laboratory techniques and field work. For this purpose QUAL2K, a mathematical model is used. Hence, water quality modeling is proved to be an efficient and less time consuming way. The primary water quality variables affected by point source loading are DO, BOD, CBOD, pH and Temperature. The surface variables input to a water quality model are stream flow, water temperature and point source loadings are considered for the data analysis. In order to find the spatial distribution of fish species along the river stretch, the water quality variables are related to the tolerance aspect of the various fish species. On the basis of the present scenario of the point source inflow, loading, stream flow and temperature at the significant point and the available data, the water quality parameters were simulated throughout the river. This was done with the help of QUAL2K, developed by the United States Environmental Protection Agency (USEPA).QUAL2K is based on Streeter-Phelps equation.
Biochemical oxygen demand
BOD is the amount of oxidizable organic matter in the sample. On the basis of mass balance equation, BOD model for a stream can be written as:

L= loading in mg/L; U= Velocity (m/s); kr = total removal rate;
In case of complete mixing at the location of discharge, an initial concentration Lo can be calculated as the flow weighted average of the loading (subscript w) and the BOD in the river upstream of the discharge (subscript r)

Qw= Flow rate of point source (m3d-1); Qr= Flow rate of river (m3d-1);
Lw= BOD of point source (mg/L); Lr= BOD loading of stream (mg/L)
The Lo (initial concentration) can be used to simulate the BOD at any point on the river by solving the equation:

Thus, BOD is reduced by decomposition and settling as it is carried downstream.
Mass balance for DO can be written as

Where, os is the saturation DO. To simplify the oxygen balance variable dissolved oxygen deficit, D, is introduced.
Point- Source Streeter- Phelps equation:
For modeling of a stream with a single point source of BOD, the reach is at steady state and characterized by plug flow with constant hydrology and geometry. The simplest manifestation of the classic of Streeter- Phelps model is:


ka= assimilation constant; kr = reaeration constant
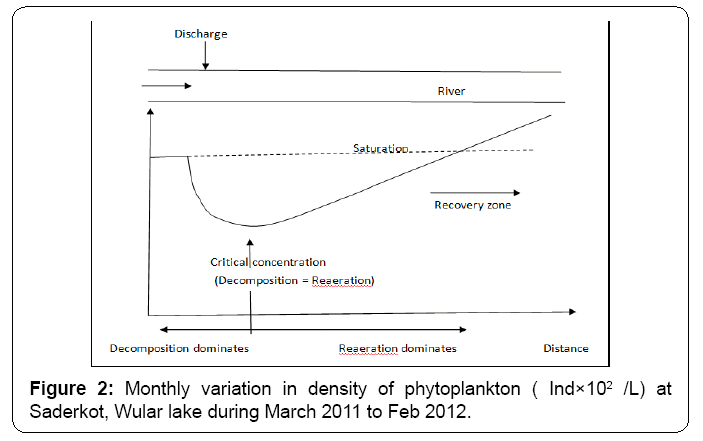
Streeter-Phelps equation is the basis of modeling of the DO and BOD in streams. Various models like QUAL2E and QUAL2K are based on this equation (Figure 2).
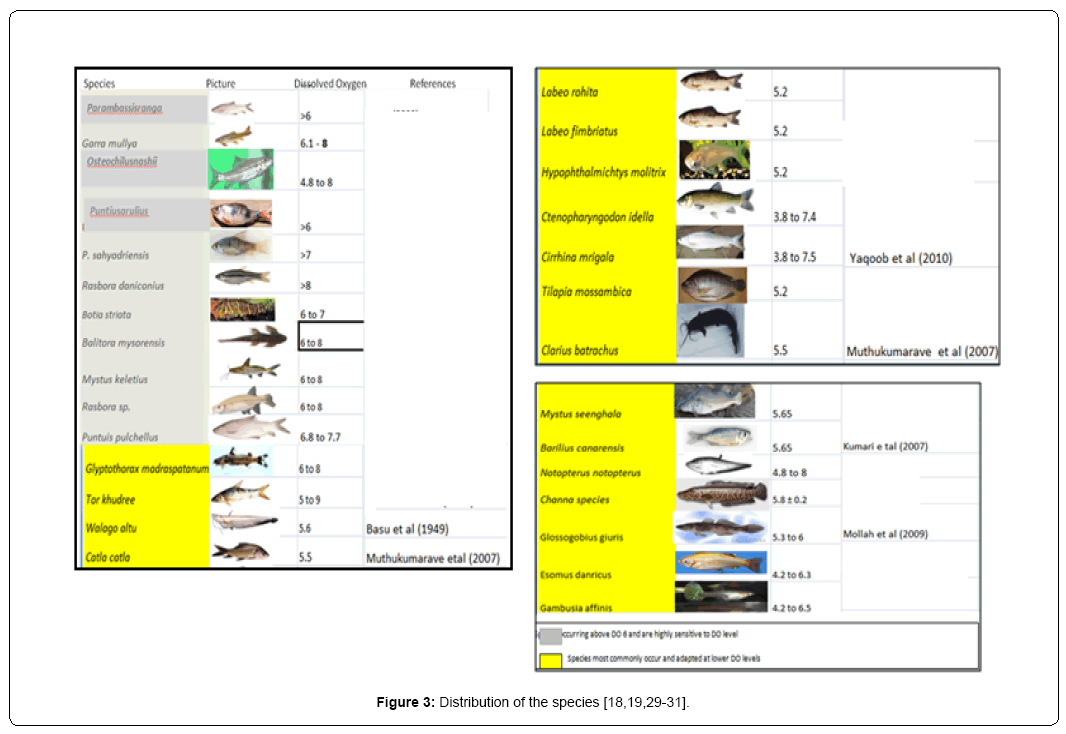
Coming to the biological aspect of the study, the species data found in Tunga-Bhadra is collected from the literature available. Their tolerance value in terms of dissolved oxygen is surveyed from the literature available. In the Figure 3 below they are placed opposite to their corresponding DO values.
The detail of the effluent load and inflow rate is taken from Rehana and Mujumdar [27], is considered as standard. In order to obtain a DO curve throughout the river stretch, the collected data is used as an input in the available software QUAL2K for the simulation of Dissolved Oxygen, CBOD and temperature.
On the basis of simulated levels of dissolved oxygen, the 16 Reaches are divided into 3 zones: Zone 1; DO = 6, Zone 2(critical zone); DO < 5, Zone 3; DO > 6. We have taken six hypothetical cases, in which the inflow rate and effluent load is varied in every case, the DO curve obtained is analyzed and used for the biological comparison, by keeping the fish species icon in their corresponding tolerance value zone. Fish species are indicated through their pictures in the model. The distribution of the species is indicated on the map with the help of Map Info.
Result and Analysis
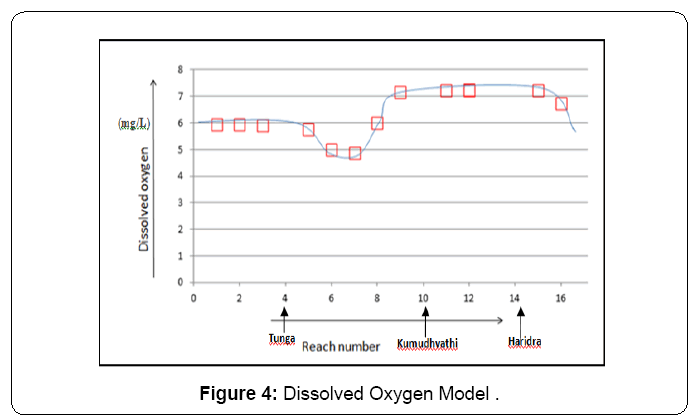
The DO simulation model along Tunga-Bhadra is shown in Figure 4, based on the present given data in Table 2 is considered as the standard model.
| Reach Number | Reach Length (Km) | Channel Slope | Manning roughness Coefficient (n) | Bed Width (m) |
|---|---|---|---|---|
| 1 | 4 | 0.001660 | 0.0492 | 61.85 |
| 2 | 3 | 0.001660 | 0.0492 | 61.85 |
| 3 | 20 | 0.001660 | 0.0492 | 61.85 |
| 4 | 20 | 0.000270 | 0.0492 | 138.03 |
| 5 | 20 | 0.000062 | 0.0905 | 162.15 |
| 6 | 20 | 0.000062 | 0.0905 | 162.15 |
| 7 | 10 | 0.000062 | 0.0905 | 162.15 |
| 8 | 14 | 0.000062 | 0.0905 | 162.15 |
| 9 | 20 | 0.000062 | 0.0905 | 162.15 |
| 10 | 2 | 0.000124 | 0.1235 | 23.28 |
| 11 | 16 | 0.000062 | 0.0905 | 162.15 |
| 12 | 2 | 0.000062 | 0.0905 | 162.15 |
| 13 | 12 | 0.000062 | 0.0905 | 162.15 |
| 14 | 2 | 0.000062 | 0.0905 | 162.15 |
| 15 | 19 | 0.000062 | 0.0905 | 162.15 |
| 16 | 20 | 0.000062 | 0.0905 | 162.15 |
Table 2: Details of Point Sources in TungaBhadra (Present Scenario); Source: Karnataka Pollution Control Board(2011) [13].
According to the simulated model the level of Dissolved Oxygen varies between 4.99 to 7.50 mg/L. The oxygen concentration in initial reaches (1 to 5), is near 6 mg/L, but shows a decreasing trend from downstream of reach 5, the minimum level of DO is found between reach 6 and downstream of reach 7, and this zone is considered as critical zone. The health status of water in these areas is not so good, as the fresh water DO varies from 8 to 15 mg/L [28]. The point sources in these reaches are Shimoga and Honalli, the reach 3 is carrying the BOD load from Bhadravati, VISL and MPM are also joining the reach 5. The DO level raises upto 7mg/L in reach 9 and varies between 7 and 7.5 mg/L along the reaches downstream 8 to 15.
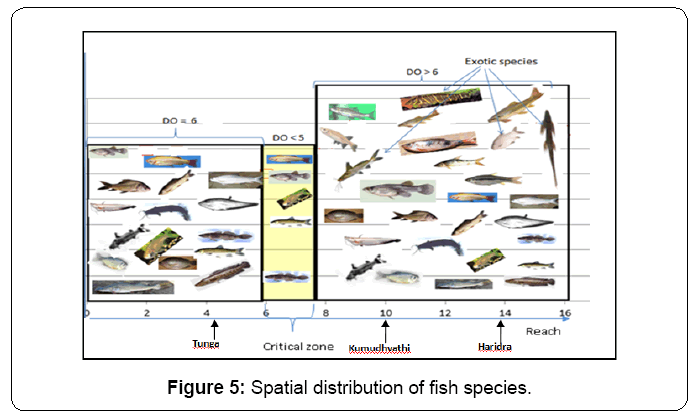
As per the Figure 5, shows the spatial distribution of fish species; Reach 1 to 4 comes under zone 1, where DO level is near 6 mg/l. 15 species of fish are found commonly in this zone 1. The species capable of tolerating a maximum oxygen concentration of 6 mg/L are Barilius canarensis, Catla catla, Labeo rohita , Labeo fimbriatus, Hypophthalmichtys molitrix, Ctenopharyngodon idella, Glossogobiusgiuris, Gambusia affinis, Esomus danricus, Osteochilu snashii, Tor khudree, Clarius batrachus, Walaga attu, Mystus seenghala, Channa species), while downstream of reach 4 to 7 have maximum oxygen concentration as 5 mg/L comes under critical zone. This zone contains only 5 fish species, these fish species are generally adapted to low oxygen concentration >3.5 mg/L and feed upon the insects like May fly, Rotifers and their larvae occurring in this zone and are generally referred as cleaning fishes. The five species occurring in this zone are (Hypophthalmichtys molitrix, Ctenopharyngodon idella, Glosso gobiusgiuris, Gambusia affinis, Esomus danricus).Whereas, Zone 3 constitutes Reaches from 8 to 16. The DO level in this zone is above 7mg/L and supports the maximum number of species. The four native species (Biota striata, Balitora mysorensis, Puntuis pulchellus, Mystus keletius) in Tunga-Bhadra are only found in this zone, as these species are very specific to the oxygen concentrations. Along with them, the other species Garra mullya, Osteochilusnashii, Barilius canarensis, Puntiu sarulius, Rasbora daniconius, Parambassisranga also occur in this zone, the species inhabiting zone 1 are also common in this zone, as this zone have healthy water to support more diverse life.
Case 1
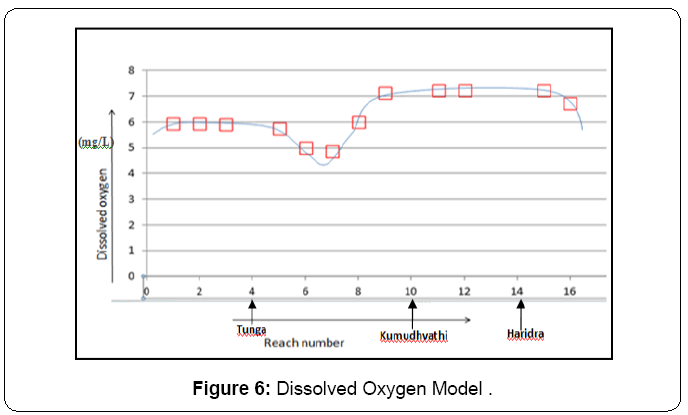
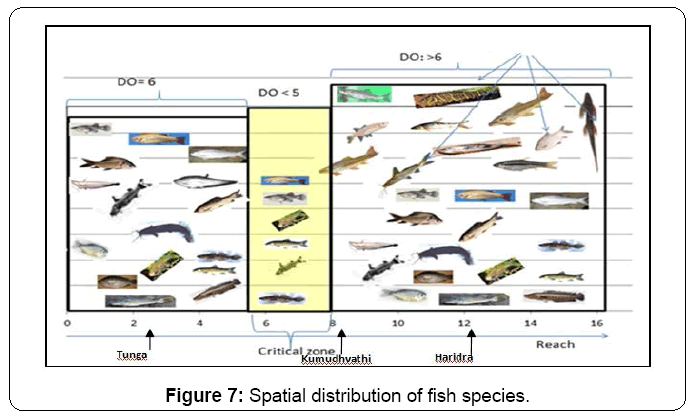
The effluent load at every point source is increased by 200 mg/L, keeping the inflow rate same as in present scenario. According to the simulated model the level of DO varies between 4.30 to 7.50 mg/L (approx). The oxygen concentration in initial reaches (1 to 4), is near 6 mg/L, but shows a decreasing trend to the downstream of reach 4, critical zone lies between reach 4 mid-stream and reach 8 upstream, where minimum level of DO (5 mg/L – 4.30 mg/L) is found. The DO level rises up to 7mg/L in reach 9 and varies between 7 and 7.50 mg/L between reaches 9 to 15. The fish species as described in standard model are found in their respective zones. The only difference is that, the critical zone has expanded (from reach 5 midstream to reach 8 upstream), as shown in (Figures 6 and 7) the migration of the fish species to the reaches having higher oxygen concentration and their disappearance from their initial habitat is observed on increasing the load on the stream.
Case 2
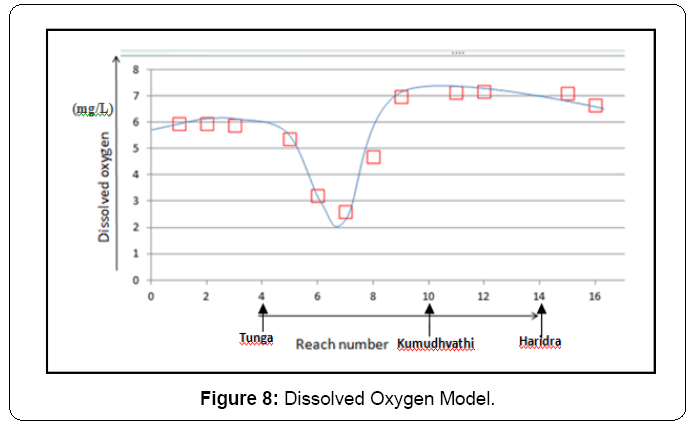
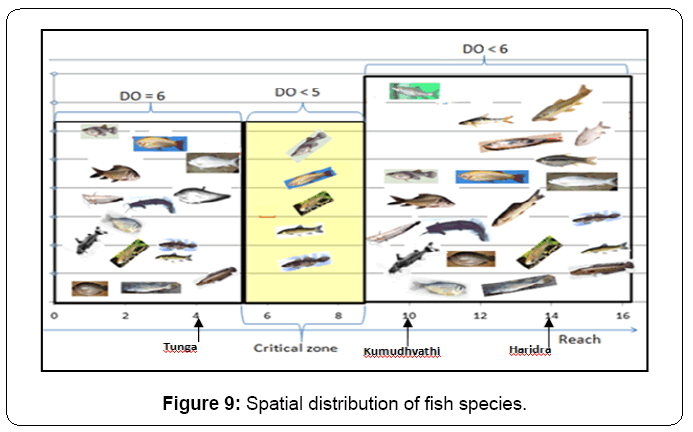
The inflow at every point source is increased by 2 m3/s; the level of Dissolved Oxygen varies between 2 to 7.25 mg/L, minimum level of DO (5 - 2 mg/L) is found between reach 4 and reach 8 downstream (Figures 8 and 9). The migration of the fish species to the reaches having higher oxygen concentration and their disappearance from their initial habitat is observed on increasing the effluent flow in the stream. The disappearance of highly sensitive native species is very prominent in the model.
Case 3
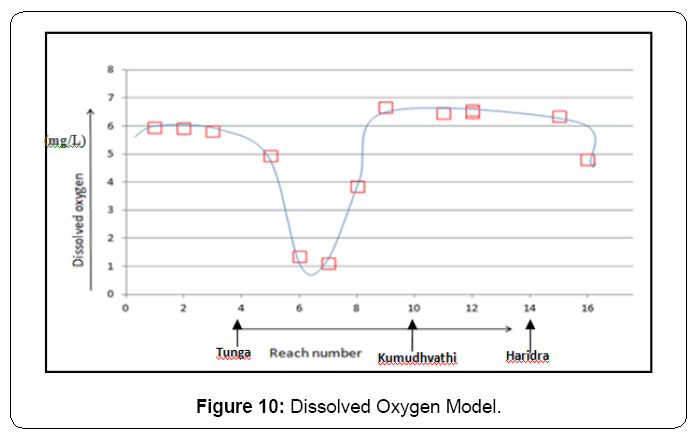
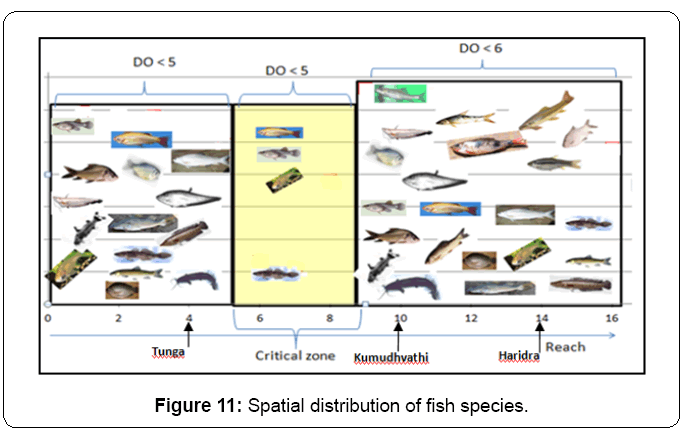
Both the effluent load and the inflow of every point source were increased by 200 mg/L and 2 m3/s, respectively. the level of Dissolved Oxygen varies between below 1 mg/L to 7.25 mg/L, minimum level of DO (below 1 to 5mg/L) critical zone is found between reach 3 downstream and Reach 8 downstream. The hypoxic conditions are developed at reach 6 midstream, where DO have reached below 1 mg/L, in such hypoxic condition fishes have disappeared while the protozoan and copepods have taken their place (Figures 10 and 11). In regions of oxygen concentration of 3-5 mg/L, only cleaning fishes, rotifers, copepods, and meroplanktons can be seen. The migration of the fish species to the reaches having higher oxygen concentration and their disappearance from their initial habitat is observed on increasing both the effluent flow and the BOD level in the stream. The disappearance of the native species throughout the stretch is very prominent.
Case 4
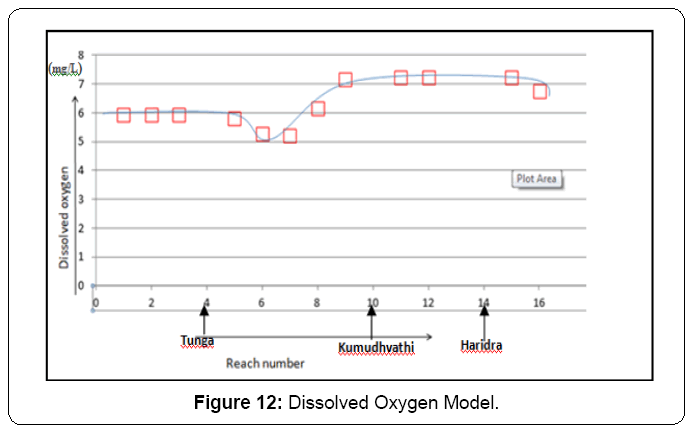
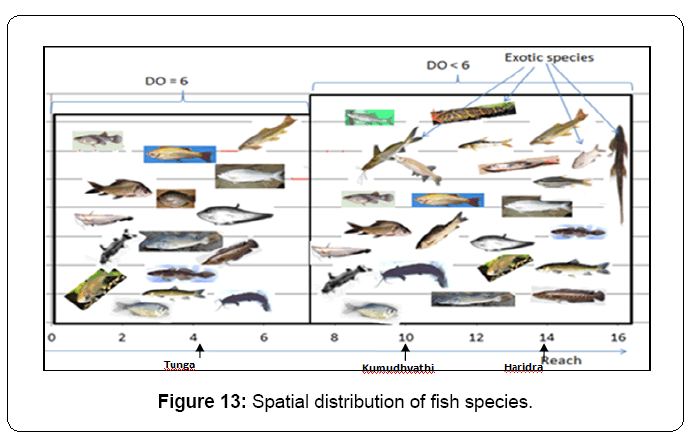
The effluent load was reduced keeping the inflow rate same as in present situation. According to the simulated model the level of Dissolved Oxygen varies between 5 mg/L to 7.5 mg/L. The critical zone has disappeared because no reach has DO level less than 5. the reduction in the BOD load in the stream has caused the disappearance of critical zone and the microorganisma inhabiting there.The fish species as described in standard model are found in their respective zones. The native species have returned to their habitat and have increased their area of living from reach 8 to reach 16. Therefore the diversity of the fish species has increased on decreasing the load in the river (Figures 12 and 13).
Case 5
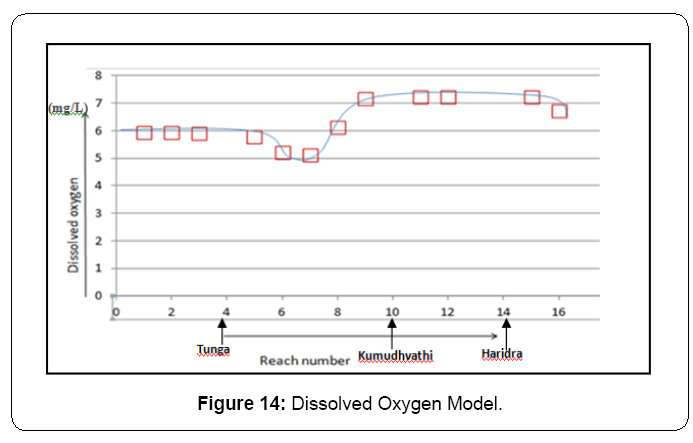
The inflow at every point source is reduced keeping the effluent loading same as in present scenario. The level of Dissolved Oxygen varies between 5 mg/L to 7.5 mg/L. The reduction in the effluent flow in the stream has caused the disappearance of critical zone and the microorganisms inhabiting there as shown in Figures 14 and 15. The fish species as described in standard model are found in their respective zones. The native species have returned to their habitat and have increased their area of living from reach 8 to reach 16. Therefore the diversity of the fish species has increased due to the decrease in the point source inflow along the river.
Case 6
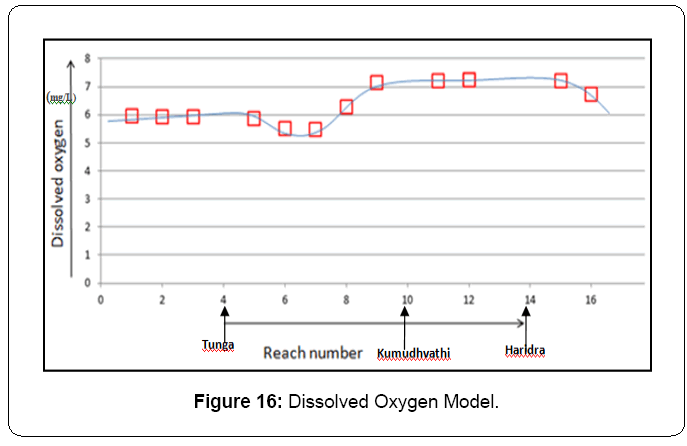
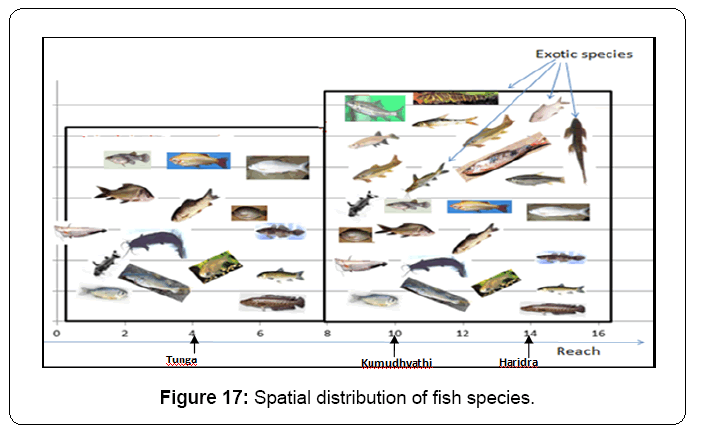
Both the effluent load and the inflow of every point source are reduced to certain extents as shown in the Table 3. According to the simulated model the level of Dissolved Oxygen varies between 5.5 mg/L to 7.5 mg/L. The critical zone has disappeared as there is no reach with DO level less than 5 mg/L. DO levels which represents the status of health of the Tunga-Bhadra river for Case 6 and this is sufficient to support the maximum diversity of fishes, it also shows that, the reduction in the effluent flow and the BOD load in the stream has caused the disappearance of critical zone and the microorganism inhabiting there. The fish species as described in standard model are found in their respective zones. The native species have returned to their habitat and have increased their area of living from upstream of reach 8 to reach 16. Therefore the diversity of the fish species has increased due to decrease in the load and effluent flow in the river (Figures 16 and 17).
| Point Source | Inflow (m3/s) | Temperature (°C) | Dissolved Oxygen (mg/L) | CBOD (mg O2/L) |
|---|---|---|---|---|
| MPM | 0.568 | 24.63 | 7.30 | 199 |
| Bhadravathi | 0.008 | 25.43 | 5.60 | 2 |
| VISL | 0 | 25.40 | 5.55 | 179 |
| Shimoga | 0.136 | 30.85 | 2.00 | 2 |
| Honalli | 0 | 31.13 | 2.00 | 2 |
| Harihara | 0 | 31.09 | 2.00 | 2 |
| HPF | 0.209 | 27.44 | 6.76 | 2 |
| Davangere | 0.567 | 31.80 | 2.00 | 2 |
Table 3: Details of Point Sources in Tunga-Bhadra in Case 6.
Conclusion
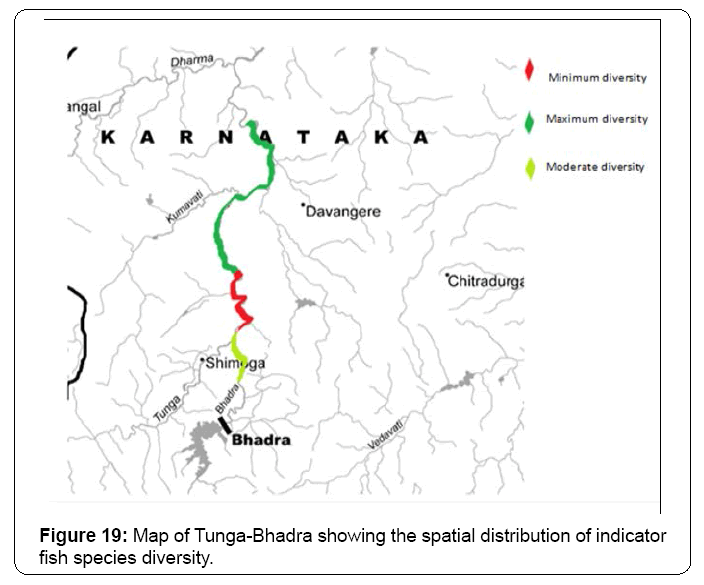
In the present situation the maximum diversity of fishes is limited to reach (7 downstream to 16) and the critical zone is between reach 6 and downstream of reach 7. On increasing the effluent load or flow rate or both, the critical zone expands and the diversity of fish reduces. The species which are highly sensitive to the DO concentration will die or migrate to the region having higher oxygen concentration. While on decreasing the effluent load or flow rate or both, the dissolved oxygen level will increase and the critical zone decreases or completely vanishes, indicating that the water quality is improving. The fish diversity will increase throughout the stream and the ecology of the river will not be harmed. Therefore, from the study it is concluded that fish species highly depends on dissolved oxygen in water, higher the concentration of oxygen in water higher will be the fish species diversity in that zone (Figure 18).
The effluent discharge also plays an important role in limiting the fish species diversity and its spatial distribution in the stream. Dissolved oxygen acting as limiting factor for the fish survival, is highly influenced by the point source loading in the stream. In order to preserve the fish species diversity in the river, the effluent discharged in the stream should be reduced (Figure 19).
References
- Bejda AJ, Phelan BA, Studholme AL (1992) The effect of dissolved oxygen on the growth of young-of-theyear winter flounder Pseudopleuronectes americanus. Environmental Biology of Fishes 34: 321-327.
- Findlay DL, Kasian SEM (1987) Phytoplankton community responses to nutrient addition in Lake 226, Experimental Lakes Area, north-western Ontario. Journal of Fisheries and Aquatic Sciences 44: 35-46.
- Kramer DL (1987) Dissolved oxygen and fish behaviour. Environmental Biology of Fishes 18: 81-92.
- Breitburg D, Loher T, Pacey CA, Gerstein A (1997) Varying effects of low dissolved oxygen on trophic interactions in an estuarine food web.Ecological monographs 67: 489–507.
- Tilman D (1982) Resource competition and community structure, Princeton University Press, Princeton.
- Andrewartha HG, Birch LC (1984) The ecological web. University of Chicago Press, Chicago.
- Fish Base (2004) Species profile: Gambusia affinis Mosquito fish, Comparison of Growth Performance of Major and Chinese Carps Fed on Floating and Sinking Pelleted Supplementary Feeds in Ponds, Pakistan. J Zool 42: 765-769.
- Adholia UR (1992) Bioenergetics of Mansarover Reservoir of Bhopal with special reference to fish production. Tech Rep ICAR Project.
- Sunkad BN, Patil HS (2003) Water quality assessment of Rakaskippa reservoir of Belgaum, Karnataka, Indian J Ecol 30: 106.
- Shahnawaz, Venkateshwarlu M, Somashekar DS, Santosh K (2010) Fish diversity with relation to water quality of Bhadra River of Western Ghats (INDIA) Environmental Monitoring Assessment 161: 83–91.
- Chandrahas, Vernekar D (2001) A study on physico-chemical parameters of Tunga-Bhadra River at Koodle. Eco Env Cons 7: 331-335.
- Kumara BKH, Srikantaswamy S, Bai S (2010) Environmental flows in Bhadra River, Karnataka, India, International. Journal of Water Resources and Environmental Engineering 2: 164-173.
- KSPCB (2011) Annual report on water quality. Karnataka State Pollution Control Board, Government of Karnataka.
- Manjappa S (2002) Studies on the heavy metal pollution in river Bhadra near Bhadravathi town, Karnataka, Ph.D Thesis, Kuvempu University, Shimoga, Karnataka.
- Suresh B, Manjappa S, Puttaiah ET (2009) The contents of zooplankton of the Tunga-Bhadra river, near Harihar, Karanataka and the saprobiological analysis of water quality. Journal of Ecology and the Natural Environment 1: 196-200.
- Sugunan VV (2000) Ecology and fishery management of reservoirs in India, Hydrobiology 430: 121-147.
- Babu KL, Kumara BKH (2009) Environmental flows in river basins: a case study of River Bhadra, current Science, 96: 475-479.
- Basu SP (1949) Some Experimental Data Regarding the Oxygen Requirements of the Indian fishes, Catla catla, Labeo rohita, Labeo bata and Cirrhina mrigala proc. Nat Inst Sci India XV.
- Kumari J, Swain T, Sahoo PK (2003) Dietary bovine lactoferrin induces changes in immunity level and disease resistance in Asian catfish Clarias batrachus. Veterinary Immunology and Immunopathology 94: 1-9.
- KSPCB (2007) Annual Report. Karnataka State Pollution Control Board, Government of Karnataka.
- Kannel PR, Kanel SR, Lee S, Lee Y, Gan TY (2011) A Review of Public Domain Water Quality Models for Simulating Dissolved Oxygen in Rivers and Streams, Environ Model Assess 16: 183-204.
- Chapra S (1996) Surface water quality Modelling. Dissolved oxygen modelling.
- Cox BA (2003) A review of currently available in-stream water-quality models and their applicability for simulating dissolved oxygen in lowland rivers. The Science of the Total Environment 314: 335–377
- Chapra S, Pelletier G (2005) QUAL2K: A Modeling Framework for Simulating River and Stream Water Quality, Documentation and User’s Manual Version 2: 3-10.
- Cordy GE (2001) A Prime on Water Quality.
- Water Quality (1991) Cuyahoga River Water Quality Monitoring Program, Cleveland State University.
- Rehana S, Mujumdar PP (2011) River water quality response under hypothetical climate change scenarios in Tunga-Bhadra River, India, Hydrol Process 25: 3373-3386.
- WHO (1996) Guidelines for drinking water quality (2nd edition Health criteria and other supporting information.
- Yakoob AF, Sikoki FD, Abowei JFN, Hart SA (2010) A comparative study of phytoplankton communities of some rivers creeks and borrow pits in the Niger Delta Area. Journal of Applied Science Environment and Management 4: 41-46.
- Muthukumaravel K, Kumarasamy P, Amsath A, Paulraj MG (2007) Toxic Effect of Cadmium on the Electrophoretic Protein Patterns of Gill and Muscle of Oreochromis mossambicus. E-Journal of Chemistry 4: 284-286.
- Mollah MFA, Mamun MSA, Sarowar MN, Roy A (2009) Effects of stocking density on the growth and breeding performance of brood fish and larval growth and survival of shol, Channa striatus (Bloch). JBangladesh Agril Univ 7: 427-432.
Relevant Topics
- Aquatic Ecosystems
- Biodiversity
- Conservation Biology
- Coral Reef Ecology
- Distribution Aggregation
- Ecology and Migration of Animal
- Ecosystem Service
- Ecosystem-Level Measuring
- Endangered Species
- Environmental Tourism
- Forest Biome
- Lake Circulation
- Leaf Morphology
- Marine Conservation
- Marine Ecosystems
- Phytoplankton Abundance
- Population Dyanamics
- Semiarid Ecosystem Soil Properties
- Spatial Distribution
- Species Composition
- Species Rarity
- Sustainability Dynamics
- Sustainable Forest Management
- Tropical Aquaculture
- Tropical Ecosystems
Recommended Journals
Article Tools
Article Usage
- Total views: 15779
- [From(publication date):
December-2014 - Jul 06, 2025] - Breakdown by view type
- HTML page views : 11119
- PDF downloads : 4660

